Statistics of Flares Sweeping across Sunspots
Abstract
Flare ribbons are always dynamic, and sometimes sweep across sunspots. Examining 588 (513 M-class and 75 X-class) flare events observed by Transition Region and Coronal Explorer (TRACE) satellite and Hinode/Solar Optical Telescope (SOT) from 1998 May to 2009 May, we choose the event displaying that one of the flare ribbons completely sweeps across the umbra of a main sunspot of the corresponding active region, and finally obtain 20 (7 X-class and 13 M-class) events as our sample. In each event, we define the main sunspot completely swept across by the flare ribbon as A-sunspot, and its nearby opposite polarity sunspots, B-sunspot. Observations show that the A-sunspot is a following polarity sunspot in 18 events, and displays flux emergence in 13 cases. All the B-sunspots are relatively simple, exhibiting either one main sunspot or one main sunspot and several small neighboring sunspots (pores). In two days prior to the flare occurrence, the A-sunspot rotates in all the cases, while the B-sunspot, in 19 events. The total rotating angle of the A-sunspot and B-sunspot is 193∘ on average, and the rotating directions, are the same in 12 events. In all cases, the A-sunspot and B-sunspot manifest shear motions with an average shearing angle of 28.5∘, and in 14 cases, the shearing direction is opposite to the rotating direction of the A-sunspot. We suggest that the emergence, the rotation and the shear motions of the A-sunspot and B-sunspot result in the phenomenon that flare ribbons sweep across sunspots completely.
1 INTRODUCTION
Solar flares are one of the most spectacular phenomena in solar physics. They are sudden brightening in the solar atmosphere, and consist of a number of components including post-flare loops (Li & Zhang, 2009a), flare ribbons (Isobe et al., 2002; Asai et al., 2004; Isobe et al., 2007), etc. The flare ribbons are located on either side of the magnetic neutral line, have magnetic polarities opposite to each other, and move apart during the process of the flare. Based on the CSHKP magnetic reconnection model (Carmichael, 1964; Sturrock, 1966; Hirayama, 1974; Kopp & Pneuman, 1976), the flare ribbons are caused by the precipitation of nonthermal particles and/or the effect of thermal conduction which are produced after magnetic field lines reconnect in the corona. At successive reconnections, the reconnection points (X-points) move upward, and therefore, newly reconnected field lines have their footpoints further out than the footpoints of the field lines that have already reconnected, which leads us to recognize the ‘apparent’ separation motion of the flare ribbons. The separation of the flare ribbons has been used to estimate the electric field in the reconnecting current sheet (e.g. Qiu et al., 2002; Asai et al., 2004) and also the coronal magnetic field strength and the reconnection rate (e. g. Isobe et al., 2002; Li & Zhang, 2009b). As we all know, the separation of the flare ribbons generally stop at the edge of the sunspots. However, in some flare events, flare ribbons sweep across the main sunspot of the flare source region completely.
In this Letter, we statistically study the evolution of the sunspots and the magnetic fields in the source region of 20 flare events. This investigation will help us understand the storage and release of the magnetic energy associated with the flares. The criteria for the data selection and the methods of the data analysis are described in Section 2. We present the results and a brief discussion in Section 3.
2 DATA AND OBSERVATIONS
The Transition Region and Coronal Explorer (TRACE; Handy et al., 1999) mission explores the dynamics and evolution of the solar atmosphere from the photosphere to the corona with high spatial and temporal resolution. It observes the photosphere (white-light, WL), the transition region (1216, 1550, and 1600 Å), and the 1-2 MK corona (171, 195, and 284 Å). The Hinode/Solar Optical Telescope (SOT; Tsuneta et al., 2008) focuses on the vector magnetic field in the photosphere, and dynamics of both the photosphere and chromosphere associated with the magnetic fields. The Broadband Filter Imager (BFI) of SOT obtains data in the Ca II H spectral line (397 nm) and G-band (430 nm) with a 2 minutes cadence and a pixel size of 0.108″.
In this work, we check all the 75 X-class and 513 M-class flare events111http://hea-www.harvard.edu/trace/flare_catalog/index.html from May 1998 to May 2009 observed by TRACE and Hinode/SOT, and choose the event displaying that one of the flare ribbons completely sweeps across the umbra of one main sunspot of the source region. Finally, we get 7 X-class and 13 M-class events as our sample (see Table 1). For each event, we mainly use TRACE 1600 Å and SOT Ca II H images to study the separation of the flare ribbons. TRACE WL and SOT G-band images are employed to study the changes of the sunspots, and Solar and Heliospheric Observatory (SOHO)/Michelson Doppler Imager (MDI; Scherrer et al., 1995) observations, are used to survey the evolutions of the magnetic fields in the source regions.
For the 20 events, we define the main sunspot completely swept across by the flare ribbon as A-sunspot, and its nearby opposite polarity main sunspots, B-sunspot. In order to investigate the evolution of the flares and their source regions quantitatively, we examine a set of parameters including the rotating angle (RAa) and rotating speed (RSa) of the A-sunspot, the rotating angle (RAb) and rotating speed (RSb) of the B-sunspot, the shearing angle (As) and shearing speed (Ss) of the A-sunspot around the B-sunspot, the swept area (SA) of the A-sunspot umbra, the sweeping duration (SD) between the beginning of the flare and the time when the flare ribbon sweeps across the A-sunspot completely, and the sweeping speed (SS) of the flare ribbon across the A-sunspot. To describe the sunspot rotations (shear motions) conveniently, we denote that the clockwise direction is positive, and the counter-clockwise one, negative.
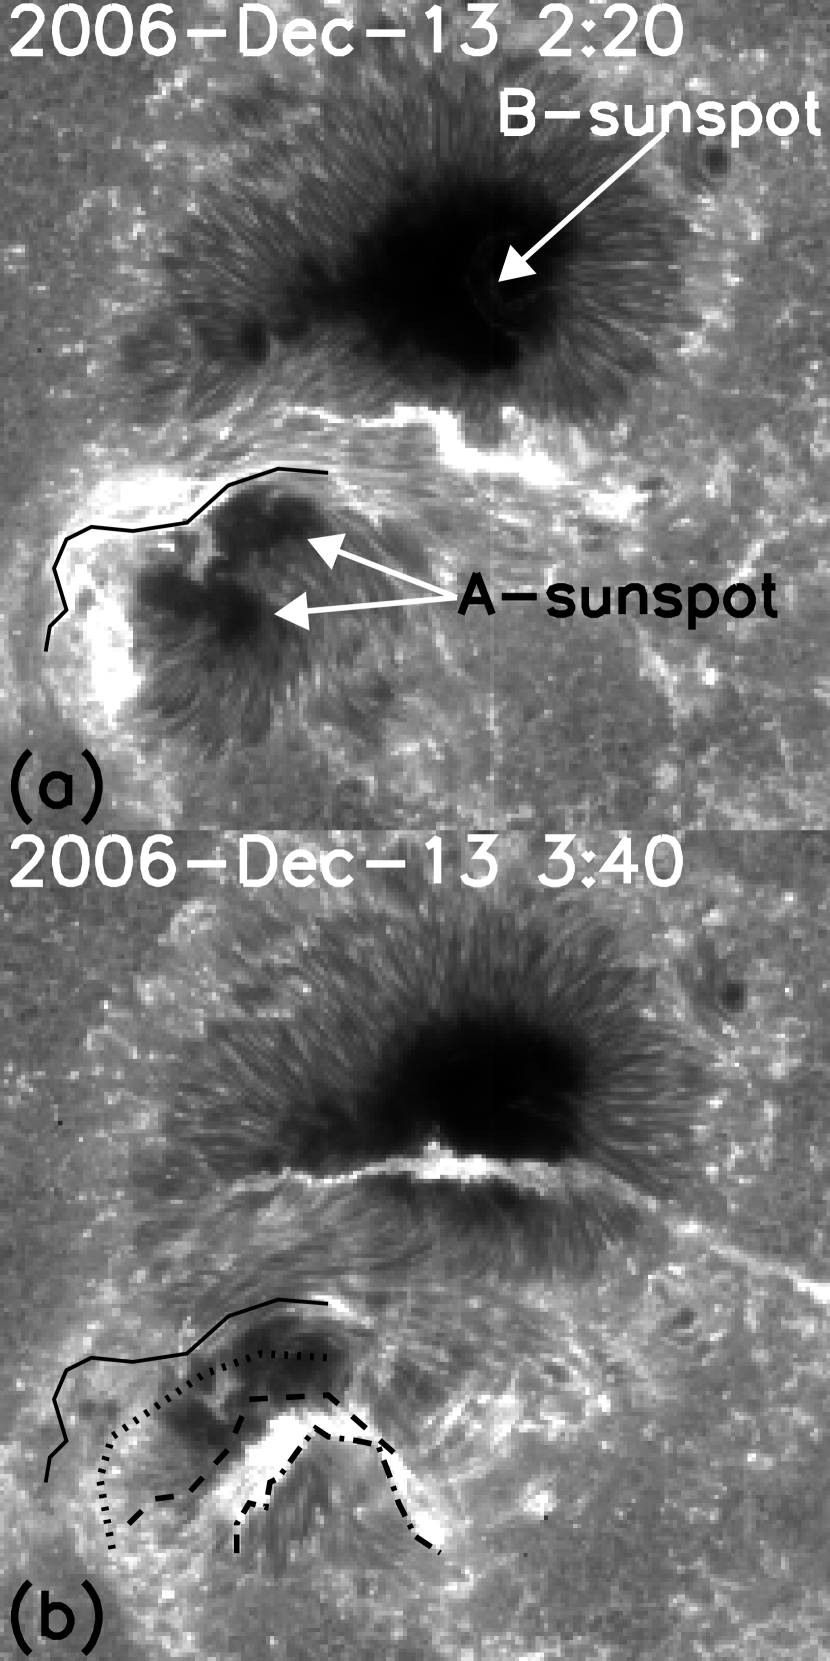
In order to illustrate how to measure these parameters, an X3.4 class flare event occurred in active region (AR) 10930 on 2006 December 13 is taken as an example, which is studied by many authors, e.g. Zhang et al. (2007) surveyed the rotation of the flare source region and concluded that the interaction between the fast rotating sunspot and the ephemeral regions triggered the flare, Isobe et al. (2007) studied the flare ribbons and presented that the G-band flare ribbons on sunspot umbrae showed a sharp leading edge followed by a diffuse inside, Jing et al. (2008) used the separation of the flare ribbons to study the spatial distribution of the magnetic reconnection, and Guo et al. (2008) extrapolated the 3-dimensional magnetic field configuration with the optimization method. Figure 1 shows two SOT Ca II H images at the beginning and the decaying phases of the flare (see also Figure 1 in Jing et al., 2008). The solid, dotted, dashed and dash-dotted lines display the outer edges of the southern flare ribbon at 2:20, 2:30, 2:40, and 3:40 UT, respectively. It indicates that the southern flare ribbon swept across the southern sunspots completely. According to our definition, the southern sunspots are A-sunspot, and the northern ones, B-sunspot. The A-sunspot are the following polarity sunspots, and the B-sunspot, consisting of one main sunspot and several small neighboring pores, the leading polarity ones. The parameters SD, SA, and SS in this event are 34 minutes, 120.1 Mm2, and 15.1 km s-1, respectively.
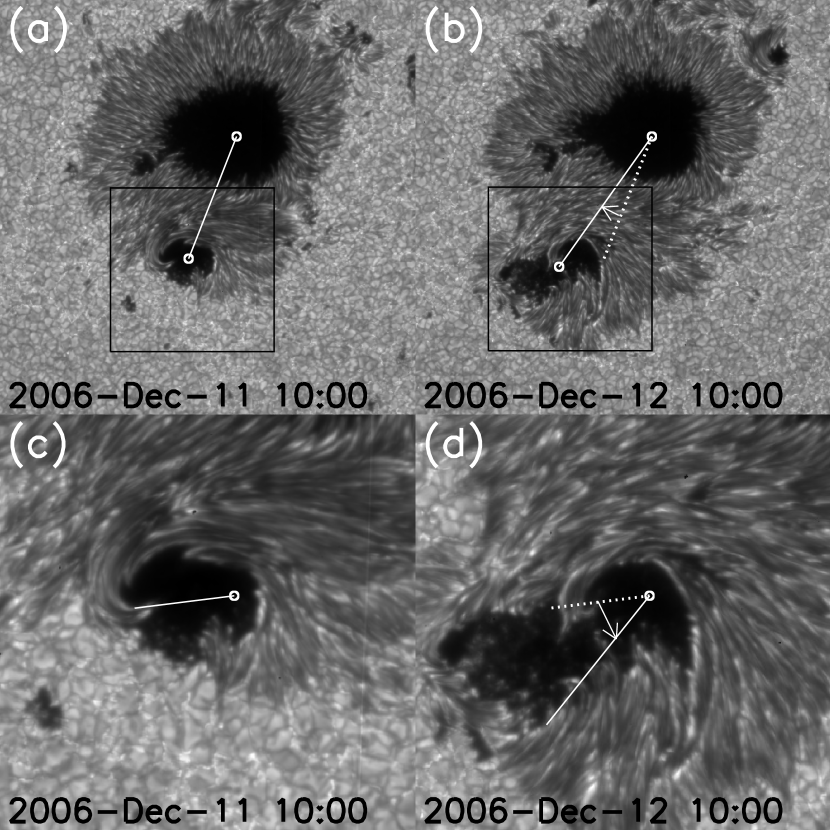
Figures 2(a)-(b) display two SOT G-band images which show the shear motion of the sunspots in AR 10930. The parameter As represents the shearing angle (denoted by the arrow in Figure 2(b)) of the A-sunspot around the B-sunspot, and reaches 28∘ in the two days before the occurrence of the flare. Using a linear polynomial fit to the data points, we get the average shearing speed Ss to be 0.5∘ hr-1. Figures 2(c)-(d) show the rotation of the A-sunspot. The parameter RAa (marked by the arrow in Figure 2(d)) is calculated using the rotation of penumbral fibrils around the rotating center (see the circles in Figures. 2(c)-2(d)). In two days prior to the flare occurrence, the RAa is 169.5∘, and the rotating speed RSa, 2.4∘ hr-1. The parameters RAb and RSb are obtained using the same methods. In this event, RAb and RSb are 11.6∘ and 0.5∘ hr-1, respectively. Comparing Figure 2(c) with Figure 2(d), we notice that the A-sunspot exhibits obvious flux emergence before the occurrence of the flare.
3 RESULTS AND DISCUSSION
In this work, nine parameters (RAa and RSa of the A-sunspot, RAb and RSb of the B-sunspot, As and Ss of the shear motion, SA of the A-sunspot, SD and SS of the flare ribbon) are considered to characterize the phenomenon that the flare ribbon sweeps across the A-sunspot completely, and listed in Table 1.
Among all the 75 X-class and 513 M-class flare events observed by TRACE and Hinode/SOT, 7 X-class and 13 M-class cases illustrate that one of the flare ribbons completely sweeps across the A-sunspot, possessing 9.3 and 2.5, respectively. In these 20 cases, the A-sunspot is the following polarity sunspot in 18 (90) cases, and displays new emergence in 13 (65) cases. The A-sunspot rotates in all cases, and the B-sunspot, in 19 (95) cases. Among these 19 cases, the rotating directions of the B-sunspot are consistent with those of the A-sunspot in 12 cases, occupying 63. In two days prior to the occurrence of the flare, the total rotating angles of the A-sunspot and B-sunspot in all events range from 118 to 315∘, and the average value is 193∘. The rotating speeds range from 0.2 to 10.6∘ hr-1, with an average value of 3.2∘ hr-1. Except one flare event in which the B-sunspot appears as a diffusive network region, 19 cases show that the B-sunspot is relatively simple, consisting of either a main sunspot or a main sunspot and several small neighboring sunspots (pores). All the 19 events exhibit shear motions of the sunspots, and the shearing directions of 14 (74) cases are opposite to the rotating directions of the A-sunspot. The Ass are from 7 to 71∘, with an average value of 28.5∘, and the Sss, range from 0.2 to 3.3∘ hr-1, with an average value of 0.9∘ hr-1 in two days before the flare occurrence. The SAs, SDs, and SSs are 12.5-120.1 Mm2, 8-67 minutes, and 1.6-16.8 km s-1, with an average value of 48.4 Mm2, 35.2 minutes, and 6 km s-1, respectively. All the statistical results are listed in Table 2.
Only 20 (3.4) flare events among 588 ones display that flare ribbons sweep across sunspots completely, indicating that this phenomenon is few and far between. The A-sunspot is the following polarity sunspot in 90 cases, showing that it is easier for the following polarity sunspots than the leading polarity ones to be completely swept across by the flare ribbons.
Flares are common phenomena and quickly release magnetic energy stored in the corona in a short time. The manners of storing the magnetic energy include rotation and shear motion of sunspots, and magnetic flux emergence, etc. Rotating sunspots have already been observed for one century (Evershed, 1910; Maltby, 1964; Gopasyuk, 1965), and Stenflo (1969) suggested that sunspot rotation may be involved with the buildup of magnetic energy, which later released by a flare. Régnier & Canfield (2006) presented that the slow rotation of the sunspot in NOAA 8210 enables the storage of magnetic energy and allows for the release of magnetic energy as flares. Recently, more and more observations provided the evidence that the rotating sunspot is involved in the large flare activity (e.g. Zhang et al., 2007; Yan & Qu, 2007). In our sample, all the flare events are associated with the sunspot rotation, consistent with the results mentioned above. The rotating directions of the A-sunspot and B-sunspot are the same in 63 cases, which is identical with Yan et al. (2008) who proposed that the two sunspots with the same rotating direction have higher flare productivity than those with opposite rotating directions, and this scenario is easier to store magnetic energy and increase the helicity of the flux tube. Furthermore, we find shear motions of the A-sunspot around the B-sunspot in 19 cases, and the shearing directions of 74 cases are opposite to the rotating directions of the A-sunspot. It seems that the two sunspots with the same rotating direction and the opposite shearing direction are much easier to accumulate magnetic energy and produce flares. Brown et al. (2003) have shown that some sunspots rotate up to 200∘ about their umbral center, and the corresponding loops in the corona fan twist and erupt as flares. Gerrard et al. (2003) have simulated the rotation of a pore around a sunspot, and found that when the pore rotates 180∘ around the sunspot, the current increases rapidly as the center of the pore makes contact with the large sunspot, which could be an explanation of an observed flare. In this work, the average total rotating angles of the A-sunspot and B-sunspot is 193∘ in two days prior to the occurrence of the flare, which is corresponding to the results of Brown et al. and Gerrard et al.. Schrijver et al. (2008) used non-linear force-free modeling to show the evolution of the coronal field associated with a rotating sunspot, and suggested that the flare energy comes from an emerging twisted flux rope. In this letter, 13 (65) flare events display new flux emergence, that is identical with the simulation of Schrijver et al.. The parameter SA may represent the magnetic flux included in the flare. We use the average swept area of 48.4 Mm2 and the magnetic field strength of 1500 G to estimate the magnetic flux involved in a flare, and get a value of 7.31020 Mx.
The magnetic field structures and sunspot evolution may respond for the phenomenon that the flare ribbons sweep across the sunspots. In our study, the B-sunspot is relatively simple, which means that almost all the magnetic field lines of the A-sunspot may connect with the B-sunspot. The rotation and shear motions of the sunspots twist the magnetic field lines above the source region together, accumulate the magnetic energy, and inject the emerging twisted flux into the corona, then sigmoids/ loops erupt as flares and coronal mass ejections (Canfield et al., 1999; Pevtsov, 2002; Régnier & Amari, 2004). In the process of the flare, all the twisted field lines of the A-sunspot are re-arranged by the successive magnetic reconnection. It is why we observe that the flare ribbon sweeps across the A-sunspot completely.
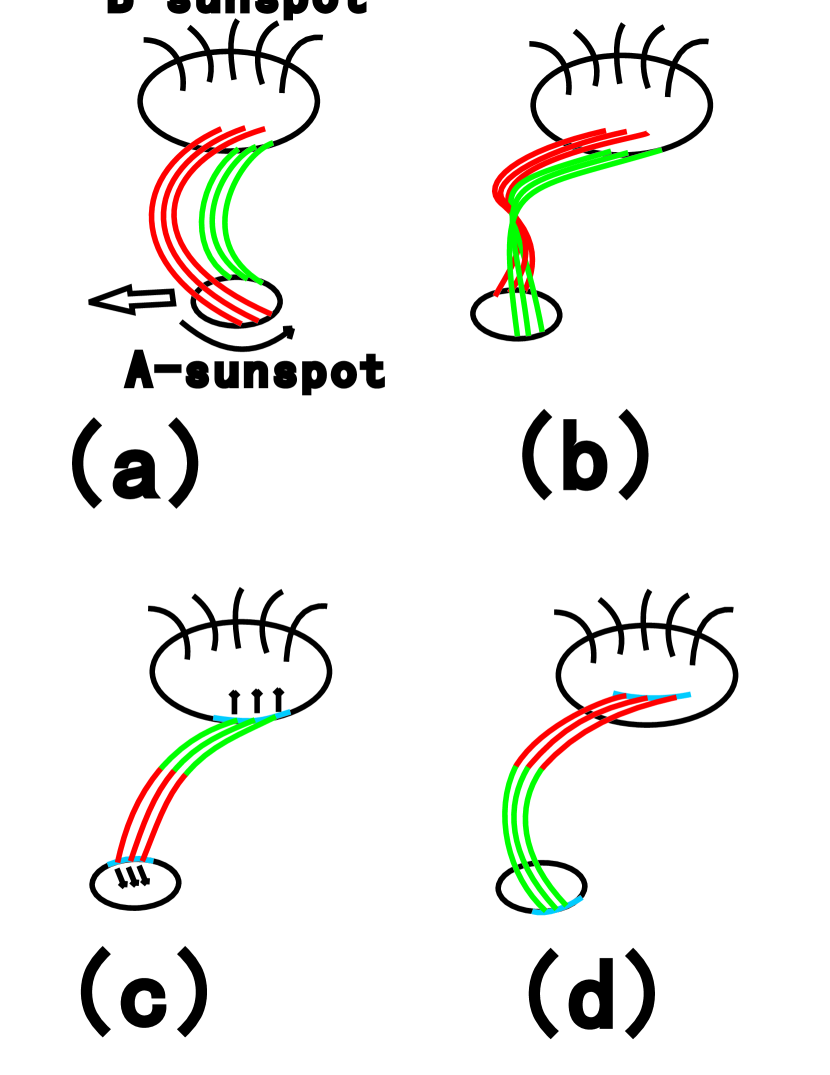
According to the statistical results, we use schematic diagrams to illustrate the evolution of the magnetic field lines of the A-sunspot. Figure 3(a) shows the magnetic configuration of the AR two days before the flare, displaying that all the field lines (see the green and the red lines) of the A-sunspot connect with the B-sunspot (see also Guo et al., 2008). In the following two days, the rotation (see the thin arrow) and shear motion of the sunspots (see the hollow arrow) twist the field lines of the A-sunspot together, inject twisted flux into the corona, form complicated magnetic topology in the AR (see Figure 3(b)), and accumulate the magnetic energy. When the magnetic energy exceeds a critical value, e.g. the rotating angle is beyond 180∘, the twisted field lines reconnect, the magnetic energy release, and the flare begin. At the beginning of the flare, the lower field lines reconnect (see the red and green lines in Figure 3(c)), and then the lower post-flare loops appear. The footpoints of these post-flare loops form the flare ribbons (see the blue lines in Figure 3(c)). Therefore, we find that the flare ribbons first appear near the magnetic neutral lines of the two sunspots. As the magnetic reconnection continues and the reconnection points move upward, the flare ribbons separate (see the arrows in Figure 3(c)) from each other. As a result, we notice that the flare ribbons sweep the umbrae of the sunspots. Figure 3(d) shows the reconnected field lines (see the green and red lines) and the flare ribbons (see the blue lines) in the decaying phase of the flare. During the flare, all the field lines of the A-sunspot are involved in the process of the magnetic reconnection. Therefore, we find that the flare ribbons sweep across the A-sunspot completely.
However, the statistics is one aspect. More observations, simulation and theoretical study are needed in order to fully understand the nature of this phenomenon. An analysis of a typical example of high-resolution images and magnetograms compared with simulations is planned.
References
- Asai et al. (2004) Asai, A., Yokoyama, T., Shimojo, M., & Shibata, K. 2004, ApJ, 605, L77
- Brown et al. (2003) Brown, D. S., Nightingale, R. W., Alexander, D., et al. 2003, Sol. Phys., 216, 79
- Canfield et al. (1999) Canfield, R. C., Hudson, H. S., & McKenzie, D. E. 1999, Geophys. Res. Lett., 26, 627
- Carmichael (1964) Carmichael, H. 1964, in The Physics of Solar Physics, ed. W. N. Hess (NASA SP-50; Washington, DC: NASA), 451
- Evershed (1910) Evershed, J. 1910, MNRAS, 70, 217
- Gerrard et al. (2003) Gerrard, C. L., Brown, D. S., Mellor, C., Arber, T. D., & Hood, A. W. 2003, Sol. Phys., 213, 39
- Gopasyuk (1965) Gopasyuk, S. I. 1965, Izv. Krymskoi Astrofiz. Obs., 33, 100
- Guo et al. (2008) Guo, Y., Ding, M. D., Wiegelmann, T., & Li, H. 2008, ApJ, 679, 1629
- Handy et al. (1999) Handy, B. N., et al. 1999, Sol. Phys., 187, 229
- Hirayama (1974) Hirayama, T. 1974, Sol. Phys., 34, 323
- Isobe et al. (2002) Isobe, H., et al. 2002, ApJ, 566, 528
- Isobe et al. (2007) Isobe, H., Kubo, M., Minoshima, T., et al. 2007, PASJ, 59, S804
- Jing et al. (2008) Jing, J., Chae, J. C., & Wang, H. M. 2008, ApJ, 672, L73
- Kopp & Pneuman (1976) Kopp, R. A., & Pneuman, G. W. 1976, Sol. Phys., 50, 85
- Li & Zhang (2009a) Li, L. P., & Zhang, J. 2009, ApJ, 690, 347
- Li & Zhang (2009b) Li, L. P., & Zhang, J. 2009, ApJ, 703, 877
- Maltby (1964) Maltby, P. 1964, Astrophs. Norvegica, 8, 205
- Pevtsov (2002) Pevtsov, A. A. 2002, Sol. Phys., 207, 111
- Qiu et al. (2002) Qiu, J., Lee, J., Gary, D. E., & Wang, H. M. 2002, ApJ, 565, 1335
- Régnier & Amari (2004) Régnier, S., & Amari, T. 2004, A&A, 425, 345
- Régnier & Canfield (2006) Régnier, S., & Canfield, R. C. 2006, A&A, 451, 319
- MDI; Scherrer et al. (1995) Scherrer, P. H., et al. 1995, Sol. Phys., 162, 129
- Schrijver et al. (2008) Schrijver, C. J., et al. 2008, ApJ, 675, 1637
- Stenflo (1969) Stenflo, J. O. 1969, Sol. Phys., 8, 115
- Sturrock (1966) Sturrock, P. A. 1966, Nature, 211, 695
- SOT; Tsuneta et al. (2008) Tsuneta et al. 2008, Sol. Phys., 249, 167
- Yan & Qu (2007) Yan, X. L., & Qu, Z. Q. 2007, A&A, 468, 1083
- Yan et al. (2008) Yan, X. L., Qu, Z. Q., & Kong, D. F. 2008, MNRAS, 391, 1887
- Zhang et al. (2007) Zhang, J., Li, L. P., & Song, Q. 2007, ApJ, 662, L35
| Date | Flare | RAa (∘) | RSa (∘/hr) | RAb (∘) | RSb (∘/hr) | As (∘) | Ss (∘/hr) | SA (Mm2) | SD (min) | SS (km/s) |
|---|---|---|---|---|---|---|---|---|---|---|
| 1998-Aug-23 | M2.2 | 193.4 | 4 | -121.9 | -2 | 27.3 | 0.6 | 18.1 | 28 | 2.1 |
| 2000-Feb-08 | M1.3 | -43.1 | -4.1 | -98.8 | -9.5 | 17.9 | 1.9 | 35.2 | 28 | 4.7 |
| 2000-Jun-10 | M5.2 | -118.1 | -2.4 | - | - | - | - | 32.6 | 22.6 | 4.4 |
| 2000-Jun-23 | M2.6 | -197.5 | -10.6 | 77 | 3.6 | -30.1 | -1.6 | 12.5 | 8.8 | 9.4 |
| 2001-Jan-20 | M7.7 | -52.1 | -3 | -129.1 | -7.4 | 11.3 | 0.6 | 51.9 | 45 | 2.2 |
| 2001-Apr-09 | M7.9 | 70.2 | 1.4 | 56.4 | 1.1 | -34.9 | -0.7 | 104.4 | 36.1 | 6.5 |
| 2001-Apr-11 | M2.3 | 80.8 | 1.4 | 70.8 | 1.4 | -35 | -0.7 | 64.4 | 37.7 | 3.6 |
| 2001-Apr-12 | X2.0 | 158.1 | 3.5 | 50.1 | 1.1 | -31 | -0.7 | 85.9 | 52 | 3.3 |
| 2001-May-12 | M3.0 | 91.9 | 4.7 | 29.5 | 1.3 | 71.3 | 3.3 | 13.8 | 50.3 | 9.2 |
| 2002-Jul-29 | M4.7 | -122.4 | -2.7 | 69.3 | 1.3 | 36 | 0.9 | 28.8 | 50.4 | 2.6 |
| 2003-Mar-18 | X1.5 | 76.7 | 1.7 | 48.3 | 1 | -47.4 | -1 | 37.1 | 25 | 2.7 |
| 2003-May-29 | X1.2 | -173.6 | -8.1 | -128.6 | -6.1 | -24.2 | -1.1 | 39.1 | 17.4 | 8.5 |
| 2004-Apr-06 | M2.4 | 123.7 | 2.6 | 154.9 | 2.8 | -60.9 | -1.1 | 47.5 | 39.2 | 4.1 |
| 2004-Jul-20 | M8.6 | 81.4 | 2.2 | 77.4 | 2.2 | -7.1 | -0.2 | 26.4 | 10.3 | 16.8 |
| 2005-Jul-09 | M2.8 | -96.6 | -2 | -85.5 | -0.8 | 22.6 | 0.4 | 30.6 | 27.3 | 5.9 |
| 2005-Aug-01 | M1.0 | 84.7 | 1.6 | -78 | -1.5 | 16.4 | 0.4 | 31.4 | 67 | 1.6 |
| 2005-Sep-09 | X6.2 | 36.6 | 1.2 | 101 | 4.3 | -10.5 | -0.4 | 72.5 | 58.5 | 1.8 |
| 2006-Dec-06 | X6.5 | -213.9 | -9.9 | 11.6 | 0.5 | 14.5 | 0.5 | 34.7 | 18.2 | 7.3 |
| 2006-Dec-13 | X3.4 | -169.5 | -2.4 | 12.9 | 0.2 | 28 | 0.5 | 120.1 | 34 | 15.1 |
| 2006-Dec-14 | X1.5 | -257.4 | -5.1 | 15.6 | 0.3 | 15.4 | 0.3 | 81.1 | 53.4 | 7.5 |
| Character | Rotation | Shear | motion | A Flux | A polarity | ||
|---|---|---|---|---|---|---|---|
| Type | A | B | A=B | S | SA | Emergency | Following |
| Numbers | 20 | 19 | 12 | 19 | 14 | 13 | 18 |
| Percentage | 100 | 95 | 63 | 95 | 74 | 65 | 90 |
Note. — A represents the A-sunspot, B, the B-sunspot, and S, the shear motion. A=B means that the rotating directions of the A-sunspot and B-sunspot are the same, and SA, the shearing direction is opposite to the rotating direction of the A-sunspot.