The Highest Resolution Chandra View of Photoionization and Jet-Cloud Interaction in the Nuclear Region of NGC 4151
Abstract
We report high resolution imaging of the nucleus of the Seyfert 1 galaxy NGC 4151 obtained with a 50 ks Chandra HRC observation. The HRC image resolves the emission on spatial scales of , 30 pc, showing an extended X-ray morphology overall consistent with the narrow line region (NLR) seen in optical line emission. Removal of the bright point-like nuclear source and image deconvolution techniques both reveal X-ray enhancements that closely match the substructures seen in the Hubble Space Telescope [OIII] image and prominent knots in the radio jet. We find that most of the NLR clouds in NGC 4151 have [OIII] to soft X-ray ratio 10, despite the distance of the clouds from the nucleus. This ratio is consistent with the values observed in NLRs of some Seyfert 2 galaxies, which indicates a uniform ionization parameter even at large radii and a density decreasing as as expected for a nuclear wind scenario. The [OIII]/X-ray ratios at the location of radio knots show an excess of X-ray emission, suggesting shock heating in addition to photoionization. We examine various mechanisms for the X-ray emission and find that, in contrast to jet-related X-ray emission in more powerful AGN, the observed jet parameters in NGC 4151 are inconsistent with synchrotron emission, synchrotron self-Compton, inverse Compton of CMB photons or galaxy optical light. Instead, our results favor thermal emission from the interaction between radio outflow and NLR gas clouds as the origin for the X-ray emission associated with the jet. This supports previous claims that frequent jet-ISM interaction may explain why jets in Seyfert galaxies appear small, slow, and thermally dominated, distinct from those kpc scale jets in the radio galaxies.
1 Introduction
X-ray counterparts to the powerful radio jets which extend beyond kpc, or even Mpc, distances from radio loud active galactic nuclei (AGNs) are well-studied (e.g., M87, Cen A, 3C273; see Harris & Krawczynski 2006 for a review). However, their weaker analogs, the smaller jets found on the scales of the narrow-line region (NLR) in many radio quiet Seyfert galaxies (Nagar et al. 1999; Terashima & Wilson 2003; Ulvestad 2003 and references therein) are less well-studied in the X-rays. The limiting reasons are the angular resolution achievable in X-rays, even with the Chandra X-ray Observatory, and the complex circumnuclear environment often including X-ray emission contributed from starburst and the ionized gas in the NLR (e.g., Wilson et al. 1992; Young et al. 2001; Wilson & Yang 2002; Wang et al. 2009)
Although challenging, studying these jets and the emission line gas with high resolution imaging provides a valuable probe of the interstellar medium (ISM) fueling the central engine and the interaction between the AGN and the host galaxy (e.g., Bianchi et al. 2006). In particular, such high resolution data allows the investigation of the importance of AGN jets in the energetics and kinematics of the NLR in addition to the direct ultraviolet (UV) emission from the nucleus.
An ideal object for such a study is NGC 4151 ( Mpc; Mundell et al. 1999). It is often considered as the nearest archetypal Seyfert 1 galaxy (see Ulrich 2000 for a review) and the nucleus contains a linear radio jet (230 pc; Wilson & Ulvestad 1982; Carral et al. 1990; Pedlar et al. 1993; Mundell et al. 1995). The biconical NLR and the extended NLR (ENLR) are elongated up to along the northeast and southwest of the nucleus and not aligned with the radio jet (Mundell et al. 2003). The ionized gas appears clumpy in high resolution images (e.g., Boksenberg et al. 1995; Winge et al. 1997; Kaiser et al. 2000). Previous Chandra ACIS images show extended X-ray emission that is well correlated with the optical forbidden line emission at (e.g., Ogle et al. 2000; Yang et al. 2001), but cannot investigate the association between X-ray emission and the radio jet due to pile-up and resolution.
In this paper we present the first Chandra High Resolution Camera (HRC) observation of the NGC 4151 nucleus. The smaller pixel size of HRC microchannel plate ( pixel-1; Chandra Proposers’ Observatory Guide111http://cxc.harvard.edu/proposer/POG/) allows good sampling of the Chandra High Resolution Mirror Assembly (HRMA; van Speybroeck et al. 1997; Weisskopf et al. 2002) point spread function (PSF; FWHM), which is instead undersampled by the ACIS detector because of the larger physical size of CCD pixel ( pixel-1). Lack of pile-up, the superior spatial resolution of the HRC data allows us to examine the X-ray morphology of the nuclear region, and identify enhancements in the X-ray image with features seen in other wavebands.
2 Observations and Data Reduction
NGC 4151 was observed on 2008 March 2 starting at 10:19:48 (UT) with the Chandra HRC-I for 50.18 ks. The nominal pointing was (, ), which places the optical nucleus of the galaxy (, , Clements 1981) on-axis. The total region covered was . The HRC data were reprocessed222http://cxc.harvard.edu/ciao/threads/createL2/ with CIAO tool hrc_process_events333http://cxc.harvard.edu/ciao4.1/ahelp/hrc_process_events.html using the Chandra Interactive Analysis of Observations software package (CIAO) version 4.1 and Chandra Calibration Database (CALDB) version 4.1.2, to generate new level 2 file that has the latest calibration applied and the amplifier ringing effect removed. The total exposure time was 49.67 ks after filtering of good time intervals.
To improve the accuracy of astrometry, X-ray source detection was performed on the HRC image using the wavdetect algorithm (Freeman et al. 2002) and the positions of X-ray point sources were compared to the coordinates from the USNO-B1.0 Catalog (Monet et al. 2003), yielding excellent absolute astrometric accuracy of (1).
3 Image Analysis and Results
3.1 X-ray Morphology
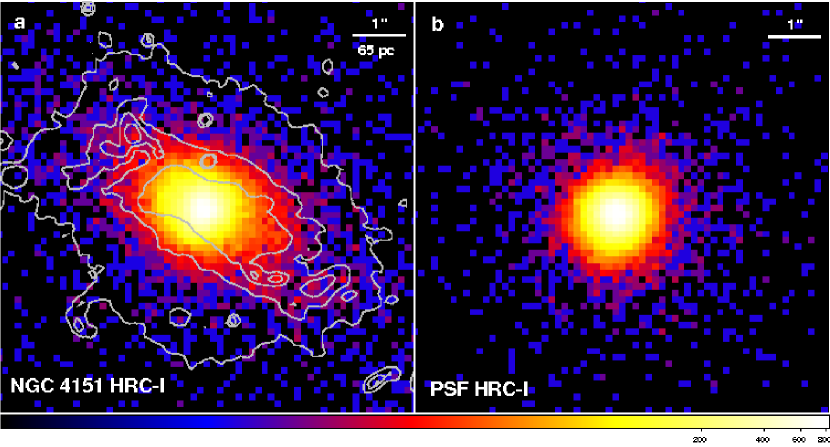
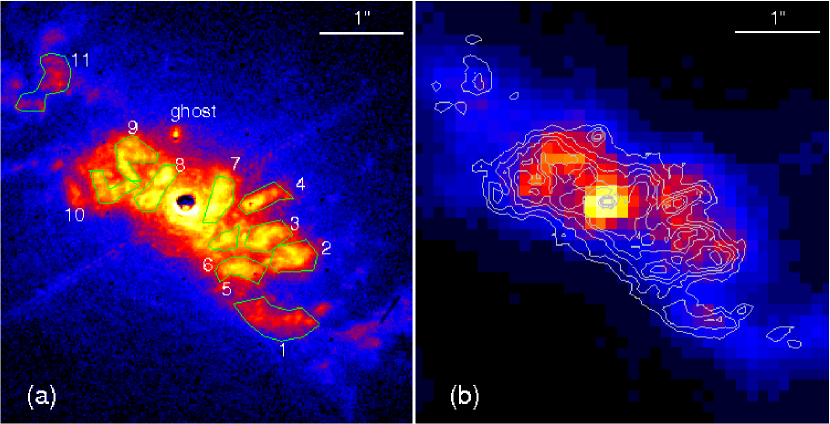
Figure 1 presents the HRC-I image of the NGC 4151 nuclear region, showing the central region. The X-ray emission in the nuclear region is resolved into distinct components in the HRC image, namely a bright point-like, unresolved nucleus and resolved extended regions towards northeast (NE) along position angle (P.A.) 48 and southwest (SW) along P.A. 233. The curved X-ray emission SW of the nucleus shows distinct segments in the HRC, which closely follows the [OIII]5007 emission (e.g., /WFPC2 F502N image, Kaiser et al. 2000). Although the ACIS and HETG zeroth order images show similar elongation and hints of structure, some features seen in the HRC image were not discernible due to the larger ACIS pixel size (c.f. Figure 1 in Yang et al. 2001). Results on new deep ACIS imaging and detailed spectral study focusing on X-ray emission associated with the ENLR will be presented in a separate paper (Wang et al. 2009, in preparation).
3.2 Preliminary Extent Analysis
In order to look for low brightness emission around the bright nucleus, we performed PSF subtraction at the nucleus position. The Chandra PSF was simulated with the Chandra Ray Tracer (ChaRT444http://cxc.harvard.edu/chart/) using a monochromatic energy at 1 keV, sufficient for HRC data (see ChaRT thread noted above). The rays were then projected onto the HRC detector with CIAO tool psf_project_ray adopting a Gaussian blurring, which gives a PSF that has a sharper radial profile matching the inner data well and will be used to perform the PSF subtraction later. Figure 1 and Figure 1 compare the source image and the PSF image.
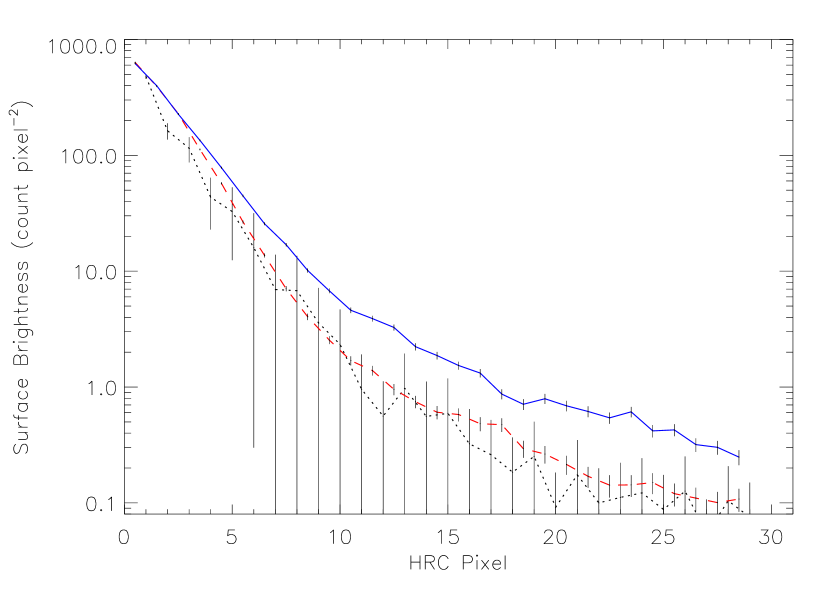
In Figure 2, we illustrate the presence of extended emission along NE-SW direction by comparing surface brightness profiles. The nucleus radial profile deviates above the simulated PSF profile at pixels (), indicating presence of extended emission. In contrast, the radial profile extracted from two sectors perpendicular to the extended emission (between P.A.290∘ and 20∘, and between P.A.110∘ and 200∘), which accurately follows the simulated PSF profile.
From the HRC count rate, we estimate the absorption corrected 0.5–10 keV flux erg s-1 cm-2 ( erg s-1) and erg s-1 cm-2 ( erg s-1) with PIMMS, assuming a power law spectrum (, cm-2; Schurch & Warwick 2002) and a thermal bremsstrahlung spectrum ( keV, cm-2; Yang et al. 2001) for the nuclear point source and the extended emission (within a radius of the nucleus), respectively. Note that although these flux values agree with previous measurements in the literature (e.g., Weaver et al. 1994, Yang et al. 2001), they rely on the assumed spectral models and should be treated as estimates. For example, varying the between 0.3 keV to 1 keV results in a deviation from the current flux. Adopting the Raymond-Smith thermal plasma model for the same keV will increase the flux to erg s-1 cm-2 due to presence of strong emission lines.
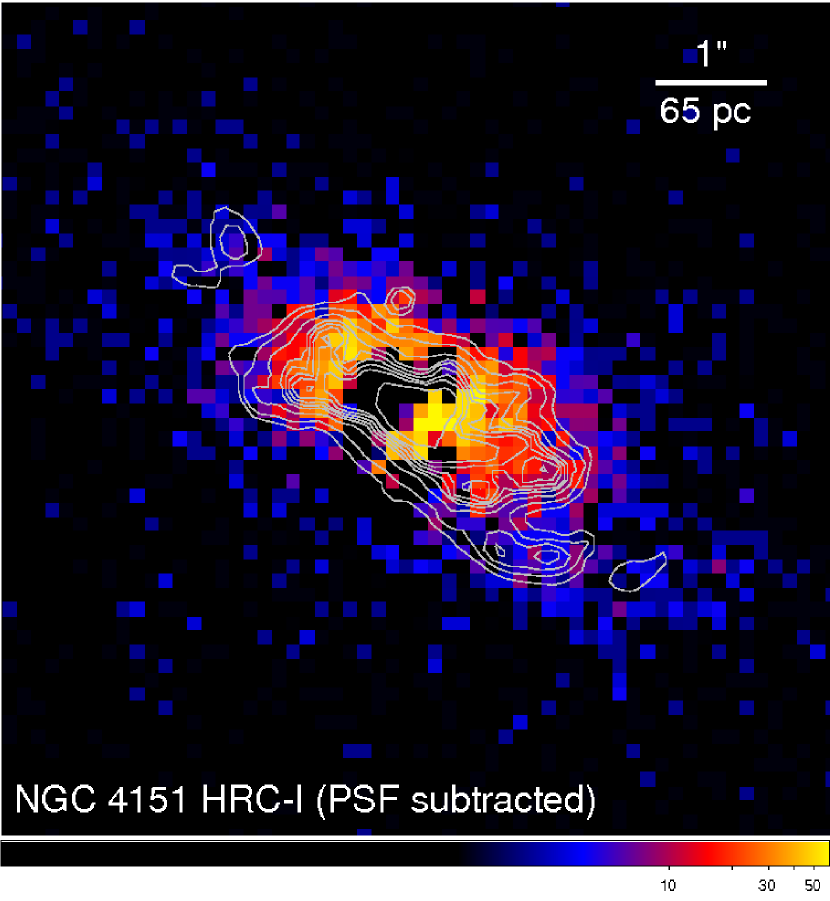
3.3 Image with PSF Subtraction
The peak of the PSF image is centered at the observed brightness peak of the point-like source at detector position (, )=(16320, 16289), and its peak intensity is renormalized to match the point-like source. The resulting PSF-subtracted HRC image in the central region is shown in Figure 3 and will be compared with the images restored with deconvolution algorithms in § 4. To check how misalignments between source image and PSF image may affect the subtraction, we offset the PSF image pixel around the observed brightness peak of the point-like source at detector position and redid the subtraction. There are significant asymmetries (point source residuals) in all these offset PSF-subtracted images with over-subtraction towards the shifted direction and bright residual in the opposite direction, indicating that the subtraction is off-center and our initial choice is justified.
3.4 Image with Deconvolution
To cross check the features recovered in the PSF subtracted image, we performed image restoration with deconvolution techniques including the widely-used Richardson-Lucy method (Richardson 1972; Lucy 1974) and the expectation through Markov Chain Monte Carlo (EMC2; Esch et al. 2004) method. The Richardson-Lucy method is not well-suited for low statistics photon-counting image, but introduces “speckled” appearance for extended objects (White 1994). The EMC2 algorithm is described in details in Esch et al. (2004) and Karovska et al. (2005) and has well-defined convergence criteria, reliable counts and noise estimate. It is designed to work with low count Poisson data and can capture point sources and sharp features in the image as well as larger scale extended features (Esch et al. 2004; Karovska et al. 2005). The effectiveness of this method was demonstrated with images of astronomical objects, including interacting galaxies NGC 6240 (Esch et al. 2004), and symbiotic binary systems Mira AB (Karovska et al. 2005) and CH Cyg (Karovska et al. 2007).
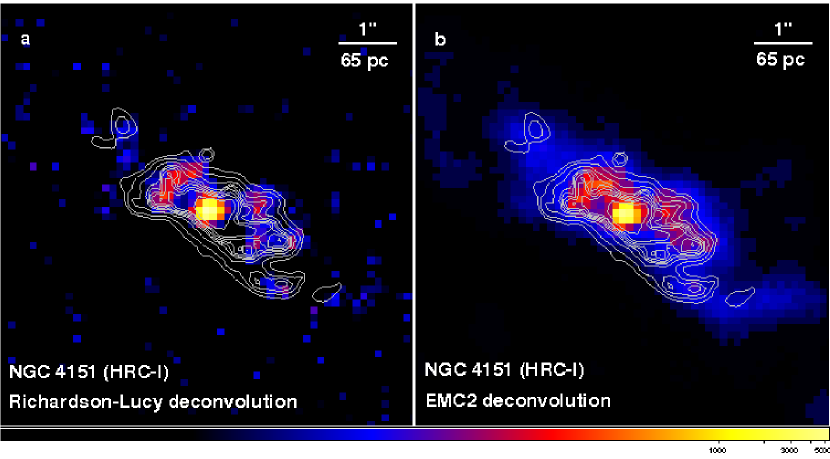
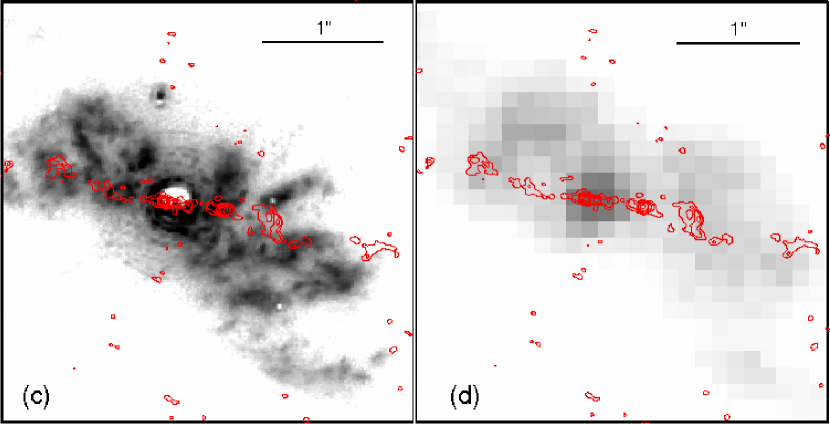
The restored images from both techniques are presented in Figure 4. The Richardson-Lucy method (100-200 iterations) gives more point-like features, while the EMC2 method (500 iterations) shows the point-like features plus fainter extended emission. The two images show effectively identical X-ray enhancements along the NE-SW direction, also share a great similarity of morphology with the PSF-subtracted image.
4 Discussion
The PSF-subtracted image and deconvolved images show similar X-ray structures, clearly indicating some relation to the NLR gas, the radio jet, and the interaction of the jet with the ISM. Overall, there is a good correlation between enhancements in [OIII] and X-ray emission (Figure 3 and 4), possibly because both originate from the same photoionized gas. In the following sections, we investigate how the X-ray emission is associated with the NLR clouds and with the bright knots in the radio jet.
4.1 Constraints on the X-ray Emission from the [OIII] Clouds
Bianchi et al. (2006) surveyed the NLRs of 8 nearby Seyfert 2 galaxies with and Chandra, and found kpc-scale soft X-ray emission coincident with the extent and morphology of the [OIII] emission. They suggested that the same gas photoionized by the AGN continuum can simultaneously produce the X-ray and [OIII] emission with the observed ratios. Note that these ratios were the average values over kpc regions as the ACIS images did not allow comparisons of the X-ray emission with the small clumps seen in images.
For NGC 4151, the unprecedented high spatial resolution HRC image enables us to compare the substructures of the X-ray emission and those of the NLR clouds. Figure 5 compares the details of a Faint Object Camera (FOC) f/96 [OIII] image of the nuclear region (Winge et al. 1997) with the restored HRC image using EMC2 deconvolution. Note the striking correspondence of the optical [OIII] substructures to the X-ray morphology, especially the faint cloud to the NE and a curved extension to the SW. The main cloud features are labeled. Using the calibrated FOC image, we measured the [OIII] fluxes for the clouds following the FOC Data Handbook555http://www.stsci.edu/hst/foc/documents/foc_handbook.html, and listed them in Table 1. Figure 5 also shows the VLBA radio image contoured on the FOC image and the HRC image with EMC2 deconvolution, outlining the plasma flow of the spine of the jet and the X-ray emission with respect to the jet. We will discuss the radio-X-ray correspondence in § 4.2 and the overall radio, [OIII], and X-ray comparison in § 4.3.
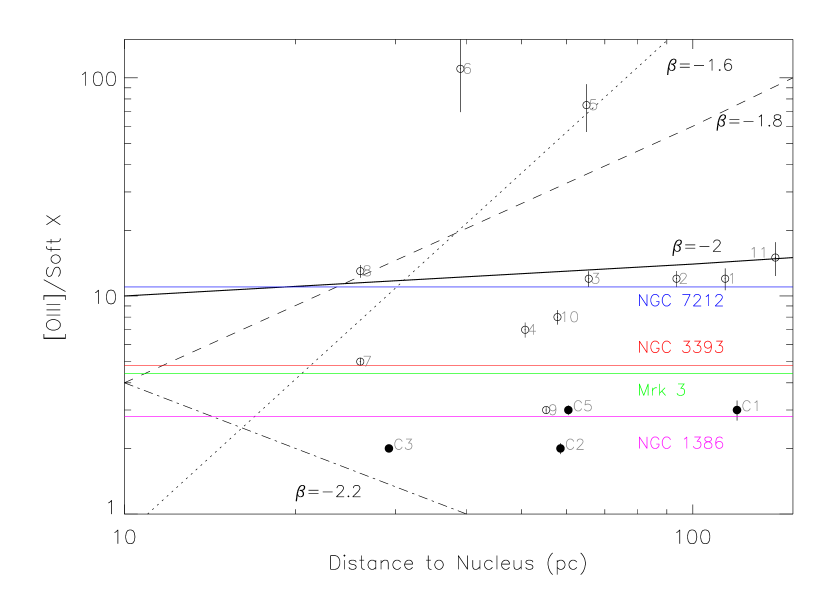
To compare with results in Bianchi et al. (2006), the 0.5–2 keV X-ray fluxes were also derived using counts extracted from the same regions, with the deconvolved HRC image and PIMMS. To check the levels of ionization in different clouds, in Figure 6 we show the [OIII] to soft X-ray ratio for the distinct cloud features (Table 1) at various radii to the nucleus (25 pc–150 pc).
We note that two clouds (#5 and #6) show much higher [OIII]/X-ray ratio (100) than the typical value, implying lower ionization at these locations. Both clouds lie along the outermost edge of the SW cone (Figure 5; see also Figure 9). Comparing to other clouds at the same radii (e.g., #3), their lower ionization could be explained by either a lower incident ionizing flux because of more screening at these locations from absorbers covering the nuclear source (see Kraemer et al. 2008), or higher density in these clouds as they are swept up by the outflow. It has been suggested that the NLR could consist of different components with various degree of ionization (e.g., Kinkhabwala et al. 2002).
In addition, the [OIII]/X-ray ratios at the 4 jet knot locations (C1, C2, C3, C5; see § 4.2 and Figure 7) were measured, and found to be uniformly low, 2. Only one cloud (#9) has a similar low ratio of 3. This implies higher X-ray emission compared to other clouds under photoionization. The enhanced X-ray emission is likely associated with the outflowing radio plasma, as many radio jets have X-ray counterparts originating from non-thermal and thermal processes (Harris & Krawczynski 2006). We explore the origin of the X-ray emission associated with these knots in the next section.
To explain the X-ray and [OIII] ratio in a single photoionized medium, Bianchi et al. (2006) generated a photoionization model with CLOUDY (version 96.01, last described by Ferland et al. 1998). We also plot the model predicted curves in Figure 6 for different radial density profiles, where the electron density was assumed to have a power-law radial dependence ( is constant density, and represents a freely expanding wind).
We find that the 8 remaining NLR clouds in NGC 4151 have [OIII]/X-ray(0.5–2 keV) ratio close to 10, despite the distance of the clouds from the nucleus. This ratio is consistent with the range of 3-11 in the Seyfert galaxies observed by Bianchi et al. (2006), although it is at the higher end. The fairly constant [OIII]/X-ray ratios indicate an almost uniform ionization parameter even at large radii, requiring a density dependence close to , as expected for a wind from the nucleus (e.g., Krolik & Kriss 1995; Elvis 2000). This agrees with the conclusion in Bianchi et al. (2006) and the results found for some well-studied NLRs (e.g., Kraemer & Crenshaw 2000; Collins et al. 2005; Kraemer et al. 2008).
4.2 Constraints on the X-ray Emission from the Radio Jet Knots
Figure 7 shows the inner region of the PSF subtracted image and the restored image using EMC2 deconvolution, overlaid with contours of the radio jet (MERLIN 1.4 GHz map, Mundell et al. 1995). There are five main radio components in the radio jet (C1-C5) from a number of studies (Carral et al. 1990; Pedlar et al. 1993; Mundell et al. 1995). C4 is known as the position of the nucleus and was used to align the X-ray peak. In jet components C3 and C5, the radio knot and X-ray enhancement appear to originate in the same volume at current resolution of the X-ray image. On the other hand, C2 has little X-ray emission but is straddled by two X-ray blobs and coincides with jet deflections in “Z”-like shape (see Figure 7 and also Figure 5).
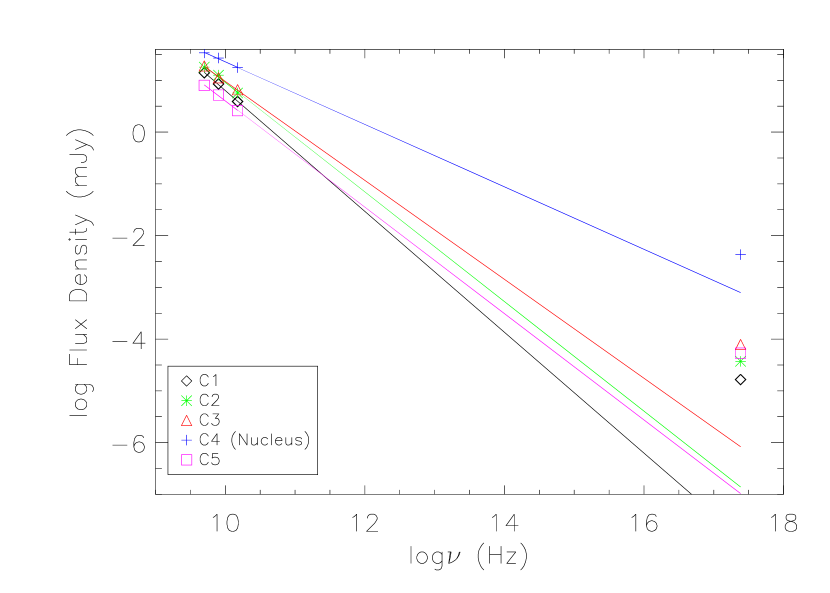
To understand the association of X-ray emission with the jet knots, we consider the following emission mechanisms in the general framework of X-ray emission processes in radio jets (Harris & Krawczynski 2006). The spectral index of a power law is defined by flux density, following the radio convention. To evaluate the X-ray flux densities of the knots, we extracted HRC counts from the EMC2 deconvolved image using regions defined by radio contour ( at 1 mJy), which have comparable resolution (, Mundell et al. 1995). We also attempted to extract HRC counts from the PSF subtracted image using regions defined by resampling radio contours to match the lower HRC resolution, which yielded similar counts (excluding the nucleus, C4). The HRC has poor energy resolution and the data are not amenable to standard spectral fitting, therefore the X-ray flux is estimated over 0.1-10 keV range with PIMMS (see Table 2 footnote for details) assuming a power law index , a typical value in low radio power jets (Harris & Krawczynski 2006) and Galactic-only absorption ( cm-2; Yang et al. 2001). Radio flux densities of the knots were taken from Pedlar et al. (1993).
Synchrotron Emission – In many radio jets, circumstantial evidence exists for the synchrotron process generating the X-rays in the knots. If this is the dominant process in the NGC 4151 jet, the X-ray intensity would be consistent with a single power law extrapolation or a broken power law concaving downward. Table 2 gives the emission parameters of the radio components. Following the minimum energy argument (or equipartition) generally adopted for synchrotron sources (e.g., Govoni & Feretti 2004), we listed in Table 3 the typical magnetic fields in the knots, most of which have mG, assuming a proton-to-electron ratio (Pedlar et al. 1993). Figure 8 shows spectra of the radio knots. The observed X-ray intensities lie orders of magnitude above the extension of the radio synchrontron spectra. This cannot be attributed to the uncertainties in the radio or X-ray flux density measurements, which indicate that a simple synchrotron model is insufficient for the X-ray emission.
Inverse Compton Emission – Low frequency photons are scattered by relativistic electrons to higher frequency through the inverse compton (IC) process. One common emission process in radio jets is the synchrotron self-compton (SSC) emission. The photon energy density from the synchrotron spectrum in each knot can be calculated, using (Wilson et al. 2000), and assuming uniformly emitting spheres to derive volumes, where is the radio luminosity, is the sphere radius, is speed of light, and is the volume. Another common IC process in radio jets is the IC scattering of the cosmic microwave background (CMB), which has the photon energy density ergs cm-3.
Both and are much lower than photon energy density of the combined AGN and star light in the NGC 4151 nuclear region, therefore considering the latter as the dominant seed photons is more appropriate. To simplify the estimate, we approximate the photon field as blackbody radiation peaking at K, with a energy density ergs cm-3. Following Blumenthal & Gould (1970), we derive an estimate of the magnetic field from the ratio between the X-ray and radio fluxes. For all the cases, the required values for IC mechanism to explain the X-ray emission are orders of magnitude larger than the equipartition magnetic field mG, which is unlikely.
To ease the requirement on the magnetic field, beaming model with relativistic bulk jet velocity must be invoked to boost IC emission. However, there is strong evidence against a highly relativistic bulk velocity of NGC 4151 jet. First, the angle between the jet and our line of sight is (Pedlar et al. 1993). The knots that have similar distance to the nucleus (C2 and C5) also have comparable X-ray/radio intensities. The fact that we see a two-sided, non-boosted radio jet suggests the bulk velocity is not highly relativistic. Secondly, Ulvestad et al. (2005) measured the speeds of the jet component with VLBI and found 0.05 and 0.028 at 0.16 and 6.8 pc from the nucleus, respectivelly, confirming the non-relativistic jet motions. None of the forms of IC emission can account for the observed X-ray fluxes.
Thermal Bremsstrahlung Emission – The X-ray emission from the radio features may originate from hot gas rather than from non-thermal mechanism, although with the current resolution we cannot distinguish if the hot gas is located within the radio emitting volume or around the jet. Considering the morphology, jet-cloud interaction seems to be present. We adopted a keV for the thermal model as a low is typical of the X-ray emission from the NLR ionized gas and measured from the X-ray spectral fitting (Yang et al. 2001). In Table 3 we calculated the emission measure, electron number density, thermal pressure for each knot. It is often argued that the absence of Faraday rotation and depolarization places a limit on the required electron densities (e.g., de Young 2002). In NGC 4151 we derive cm-3 from optical polarization measurement of Kruszewski (1971), assuming an equipartition field G. The required for thermal emission is orders of magnitude smaller than this limit. A thermal origin is thus highly plausible.
4.3 X-ray, Radio, and [OIII] Comparison
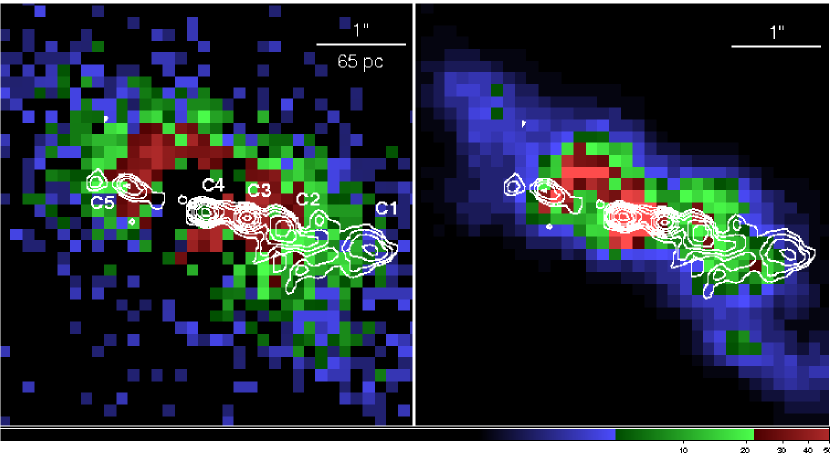
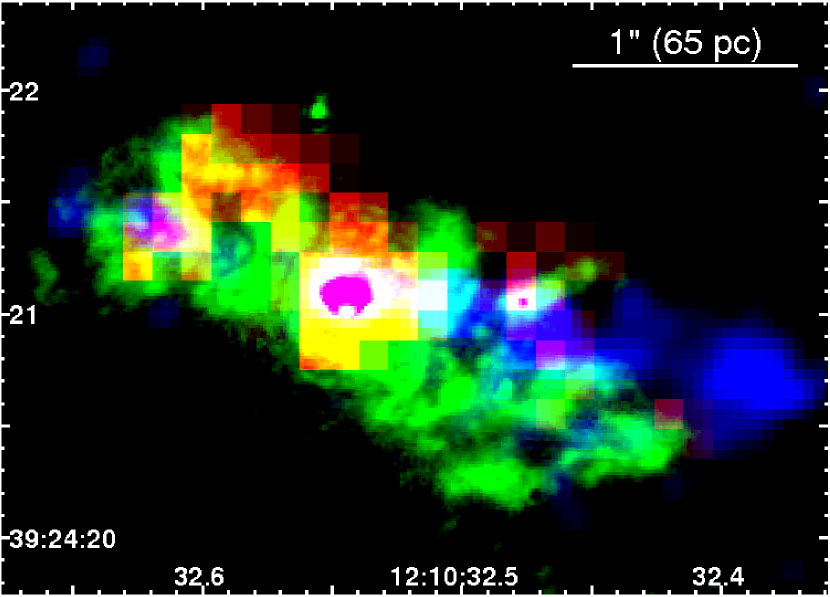
Figure 9 compares altogether X-ray emission (red) with the radio jet (blue; MERLIN 1.4 GHz map, Mundell et al. 1995) and optical NLR emission (green; /FOC F502N [OIII] image, Winge et al. 1997) in projection. The radio component C4 contains the AGN (see higher resolution VLBA studies by Ulvestad et al. 2000; Mundell et al. 2003). Assuming the peak of the optical nuclear emission originates from the AGN, we aligned the X-ray, optical and radio nuclei.
There are X-ray enhancements associated with the bright radio knots in the jet as well as the NLR clouds (see also Figure 7). The overall morphology in the three bands is consistent with the scenario that clumpy material lies in the path of the jet and is shock-heated to X-ray emitting temperature from the impact with the outflowing radio plasma from the nucleus. C1 has largely diffuse morphology in the radio and weak X-ray emission; it is mostly in an [OIII]-emission cloud free region. Around knots C2 and C5, as noted in Mundell et al.(2003), a number of [OIII] clouds are closely associated with the radio knots and appear to bound the radio knots (see Figure 5c). The morphologically disturbed radio jet may have cleared a path through the NLR (Mundell et al. 2003).
Some evidence has been reported supporting this jet-cloud interaction scenario. Kinematic studies mapping the full velocity field of the NLR clouds (Winge et al. 1999; Kaiser et al. 2000) found that the jet may be influential in producing the high velocity dispersions for the clouds in the inner , although not directly responsible for the acceleration of the gas (Crenshaw et al. 2000; Das et al. 2005). Mundell et al. (2003) examined the apparent radio correspondence with these clouds, suggesting that sites of radio jet deflection are aligned in projection with high velocity dispersion clouds.
Storchi-Bergmann et al. (2009) mapped near infrared emission-line intensities and ratios in the NLR of NGC 4151, which probe the effects of shocks produced by the jet on the NLR gas. We note that there are enhancements of the [Fe II] emission at the locations of radio knots C2 and C5 in these IR maps (e.g., the [Fe II]/Pa), consistent with being the spots of jet-cloud interaction. As a minimal requirement of the shock scenario, following Kraft et al. (2009) the pressure of the knots must be less than the ram pressure of the jet, which translates to ( is the pressure of a knot, is the jet power, is the cross-section area, and is the jet velocity). Using an estimated jet power ergs s-1 (Allen et al. 2006), (Ulvestad et al. 2005), and pc, we find dyne cm-2, which is satisfied by our derived pressure (Table 3).
Our estimates for the NGC 4151 jet assuming thermal origin of the X-ray emission match well with the characteristics of the jets in hydrodynamical simulations (e.g., Rossi et al. 2000, Saxton et al. 2005), which are relatively heavy ( cm-3) and slow ( km s-1). This is also consistent with the conclusion of Whittle et al. (2004, 2005) studies of a jet-dominated Seyfert Mkn 78, where a thermally-dominated, slow and dense Seyfert jet encountering dense gas clouds was identified.
Such jet-cloud interaction may explain why the jets in Seyfert galaxies seem very different from those in radio-loud AGNs (Middelberg et al. 2007): they are not able to propagate freely as do the well-collimated, galactic scale jets in radio galaxies. Besides NGC 4151, there is strong evidence for interactions of radio jets with the ISM on the scales of NLRs in Seyfert galaxies (e.g., NGC 1068, Wilson & Ulvestad 1982; IC 5063, Oosterloo et al. 2000; NGC 2110, Evans et al. 2006; III Zw 2, Brunthaler et al. 2005; NGC 3079, Middelberg et al. 2007), which would be worth Chandra follow-up imaging to locate the X-ray emission.
It is also worth noting that the NE part of the X-ray emission (e.g., cloud #9) appears brighter than the SW part. According to the modeled geometry of the bicone of ionized gas and host galaxy in Das et al. (2005), the SW side is closer to us and our line of sight is outside of the bicone. One plausible explanation for the enhanced X-ray emission in NE is that, the NE bicone intersects with the NE galactic disk and the X-ray emitting medium there may have higher density. On the other hand, although SW part of the bicone also intersects the disk, our line of sight to the intersection goes through the cone and may be subject to higher absorption (see Figure 10 in Evans et al. 1993).
As a cautionary note, physical association between the features seen in different bands along the line of sight is not warranted because of the projection effect. At the knot position, at least part of the X-ray emission could be contributed from the NLR clouds directly ionized by the AGN (e.g., Bianchi et al. 2006). But as we showed in § 4.1, C1, C2, and C5 are not associated with any bright NLR clouds. Instead, thermal X-ray emission is expected in the jet-ISM interaction scenario described above, which is well supported by the low [OIII]/soft-X ratios and the enhancement of [FeII], together with the multiwavelength morphologies.
5 Conclusions
The high resolution imaging of the NGC 4151 nucleus obtained with Chandra HRC shows X-ray morphology that is both overall consistent with the NLR seen in optical line emission, with substructures closely matching the [OIII] clouds, and with knots in the radio jet, implying X-ray emission associated with both the photoionized gas and the jet components.
We find that most of the NLR clouds in NGC 4151 have [OIII] to soft X-ray ratio 10, at or a factor of 10 in distance of the clouds from the nucleus. The radially constant ratio indicates a uniform ionization parameters even at large radii and a density dependence as expected for a nuclear wind.
The calculations of required jet parameters from observed X-ray and radio properties do not favor synchrotron emission, SSC emission, or IC of CMB photons and the local galaxy light. Thermal emission from interaction between radio outflow and the NLR clouds is the most favorable explanation.
Future high spatial resolution X-ray observatories, such as Generation-X with an angular resolution of (Brissenden 2009), will be able to unambiguously resolve the X-ray emission from the jets and the NLR with high spectral resolution and so gain important new knowledge of the outflows of both thermal and non-thermal plasma from Seyfert galaxies.
References
- Allen et al. (2006) Allen, S. W., Dunn, R. J. H., Fabian, A. C., Taylor, G. B., & Reynolds, C. S. 2006, MNRAS, 372, 21
- Bianchi et al. (2006) Bianchi, S., Guainazzi, M., & Chiaberge, M. 2006, A&A, 448, 499
- Brunthaler et al. (2005) Brunthaler, A., Falcke, H., Bower, G. C., Aller, M. F., Aller, H. D., & Teräsranta, H. 2005, A&A, 435, 497
- Blumenthal & Gould (1970) Blumenthal, G. R., & Gould, R. J. 1970, Reviews of Modern Physics, 42, 237
- Boksenberg et al. (1995) Boksenberg, A., et al. 1995, ApJ, 440, 151
- Brissenden (2009) Brissenden, R. J. V. 2009, Bulletin of the American Astronomical Society, 41, 388
- Carral et al. (1990) Carral, P., Turner, J. L., & Ho, P. T. P. 1990, ApJ, 362, 434
- Clements (1981) Clements, E. D. 1981, MNRAS, 197, 829
- Collins et al. (2005) Collins, N. R., Kraemer, S. B., Crenshaw, D. M., Ruiz, J., Deo, R., & Bruhweiler, F. C. 2005, ApJ, 619, 116
- Crenshaw et al. (2000) Crenshaw, D. M., et al. 2000, AJ, 120, 1731
- Das et al. (2005) Das, V., et al. 2005, AJ, 130, 945
- de Young (2002) de Young, D. S. 2002, The physics of extragalactic radio sources, University of Chicago Press
- Elvis (2000) Elvis, M. 2000, ApJ, 545, 63
- Esch et al. (2004) Esch, D. N., Connors, A., Karovska, M., & van Dyk, D. A. 2004, ApJ, 610, 1213
- Evans et al. (1993) Evans, I. N., Tsvetanov, Z., Kriss, G. A., Ford, H. C., Caganoff, S., & Koratkar, A. P. 1993, ApJ, 417, 82
- Evans et al. (2006) Evans, D. A., Lee, J. C., Kamenetska, M., Gallagher, S. C., Kraft, R. P., Hardcastle, M. J., & Weaver, K. A. 2006, ApJ, 653, 1121
- Ferland et al. (1998) Ferland, G. J., Korista, K. T., Verner, D. A., Ferguson, J. W., Kingdon, J. B., & Verner, E. M. 1998, PASP, 110, 761
- Freeman et al. (2002) Freeman, P. E., Kashyap, V., Rosner, R., & Lamb, D. Q. 2002, ApJS, 138, 185
- Govoni & Feretti (2004) Govoni, F., & Feretti, L. 2004, International Journal of Modern Physics D, 13, 1549
- Harris & Krawczynski (2006) Harris, D. E., & Krawczynski, H. 2006, ARA&A, 44, 463
- Kaiser et al. (2000) Kaiser, M. E., et al. 2000, ApJ, 528, 260
- Karovska et al. (2005) Karovska, M., Schlegel, E., Hack, W., Raymond, J. C., & Wood, B. E. 2005, ApJ, 623, L137
- Karovska et al. (2007) Karovska, M., Carilli, C. L., Raymond, J. C., & Mattei, J. A. 2007, ApJ, 661, 1048
- Kinkhabwala et al. (2002) Kinkhabwala, A., et al. 2002, ApJ, 575, 732
- Kraemer & Crenshaw (2000) Kraemer, S. B., & Crenshaw, D. M. 2000, ApJ, 544, 763
- Kraemer et al. (2008) Kraemer, S. B., Schmitt, H. R., & Crenshaw, D. M. 2008, ApJ, 679, 1128
- Kraft et al. (2009) Kraft, R. P., et al. 2009, ApJ, 698, 2036
- Krolik & Kriss (1995) Krolik, J. H., & Kriss, G. A. 1995, ApJ, 447, 512
- Kruszewski (1971) Kruszewski, A. 1971, Acta Astronomica, 21, 311
- Lucy (1974) Lucy, L. B. 1974, AJ, 79, 745
- Middelberg et al. (2007) Middelberg, E., Agudo, I., Roy, A. L., & Krichbaum, T. P. 2007, MNRAS, 377, 731
- Monet et al. (2003) Monet, D. G., et al. 2003, AJ, 125, 984
- Mundell et al. (1995) Mundell, C. G., Pedlar, A., Baum, S. A., O’Dea, C. P., Gallimore, J. F., & Brinks, E. 1995, MNRAS, 272, 355
- Mundell et al. (1999) Mundell, C. G., Pedlar, A., Shone, D. L., & Robinson, A. 1999, MNRAS, 304, 481
- Mundell et al. (2003) Mundell, C. G., Wrobel, J. M., Pedlar, A., & Gallimore, J. F. 2003, ApJ, 583, 192
- Nagar et al. (1999) Nagar, N. M., Wilson, A. S., Mulchaey, J. S., & Gallimore, J. F. 1999, ApJS, 120, 209
- Ogle et al. (2000) Ogle, P. M., Marshall, H. L., Lee, J. C., & Canizares, C. R. 2000, ApJ, 545, L81
- Oosterloo et al. (2000) Oosterloo, T. A., Morganti, R., Tzioumis, A., Reynolds, J., King, E., McCulloch, P., & Tsvetanov, Z. 2000, AJ, 119, 2085
- Pedlar et al. (1993) Pedlar, A., Kukula, M. J., Longley, D. P. T., Muxlow, T. W. B., Axon, D. J., Baum, S., O’Dea, C., & Unger, S. W. 1993, MNRAS, 263, 471
- Richardson (1972) Richardson, W. H. 1972, Journal of the Optical Society of America (1917-1983), 62, 55
- Rossi et al. (2000) Rossi, P., Capetti, A., Bodo, G., Massaglia, S., & Ferrari, A. 2000, A&A, 356, 73
- Saxton et al. (2005) Saxton, C. J., Bicknell, G. V., Sutherland, R. S., & Midgley, S. 2005, MNRAS, 359, 781
- Schurch & Warwick (2002) Schurch, N. J., & Warwick, R. S. 2002, MNRAS, 334, 811
- Storchi-Bergmann et al. (2009) Storchi-Bergmann, T., McGregor, P. J., Riffel, R. A., Simões Lopes, R., Beck, T., & Dopita, M. 2009, MNRAS, 394, 1148
- Terashima & Wilson (2003) Terashima, Y., & Wilson, A. S. 2003, ApJ, 583, 145
- Ulrich (2000) Ulrich, M.-H. 2000, A&A Rev., 10, 135
- Ulvestad (2003) Ulvestad, J. S. 2003, Radio Astronomy at the Fringe, 300, 97
- Ulvestad et al. (2005) Ulvestad, J. S., Wong, D. S., Taylor, G. B., Gallimore, J. F., & Mundell, C. G. 2005, AJ, 130, 936
- van Speybroeck et al. (1997) van Speybroeck, L. P., Jerius, D., Edgar, R. J., Gaetz, T. J., Zhao, P., & Reid, P. B. 1997, Proc. SPIE, 3113, 89
- Wang et al. (2009) Wang, J., Fabbiano, G., Elvis, M., Risaliti, G., Mazzarella, J. M., Howell, J. H., & Lord, S. 2009, ApJ, 694, 718
- Weaver et al. (1994) Weaver, K. A., et al. 1994, ApJ, 423, 621
- Weisskopf et al. (2002) Weisskopf, M. C., Brinkman, B., Canizares, C., Garmire, G., Murray, S., & Van Speybroeck, L. P. 2002, PASP, 114, 1
- White (1994) White, R. L. 1994, Proceedings of The Restoration of HST Images and Spectra - II, 104, Edited by R.J. Hanisch and R.L. White., Space Telescope Science Institute
- Whittle & Wilson (2004) Whittle, M., & Wilson, A. S. 2004, AJ, 127, 606
- Whittle et al. (2005) Whittle, M., Rosario, D. J., Silverman, J. D., Nelson, C. H., & Wilson, A. S. 2005, AJ, 129, 104
- Wilson & Ulvestad (1982) Wilson, A. S., & Ulvestad, J. S. 1982, ApJ, 263, 576
- Wilson et al. (1992) Wilson, A. S., Elvis, M., Lawrence, A., & Bland-Hawthorn, J. 1992, ApJ, 391, L75
- Wilson et al. (2000) Wilson, A. S., Young, A. J., & Shopbell, P. L. 2000, ApJ, 544, L27
- Wilson & Yang (2002) Wilson, A. S., & Yang, Y. 2002, ApJ, 568, 133
- Winge et al. (1997) Winge, C., Axon, D. J., Macchetto, F. D., & Capetti, A. 1997, ApJ, 487, L121
- Winge et al. (1999) Winge, C., Axon, D. J., Macchetto, F. D., Capetti, A., & Marconi, A. 1999, ApJ, 519, 134
- Yang et al. (2001) Yang, Y., Wilson, A. S., & Ferruit, P. 2001, ApJ, 563, 124
- Young et al. (2001) Young, A. J., Wilson, A. S., & Shopbell, P. L. 2001, ApJ, 556, 6
|
|
|
|
|
|
|||||||||||
|---|---|---|---|---|---|---|---|---|---|---|---|---|---|---|---|---|
| 1 | 1.76 | 114 | 1.1 | 0.91 | 12 | |||||||||||
| 2 | 1.44 | 93.6 | 1.9 | 1.61 | 12 | |||||||||||
| 3 | 1.01 | 65.6 | 2.2 | 1.84 | 12 | |||||||||||
| 4 | 0.78 | 50.7 | 1.3 | 1.91 | 7 | |||||||||||
| 5 | 1.0 | 65.0 | 1.5 | 0.23 | 75 | |||||||||||
| 6 | 0.6 | 39. | 1.1 | 0.12 | 110 | |||||||||||
| 7 | 0.4 | 26. | 3.4 | 7.38 | 5 | |||||||||||
| 8 | 0.4 | 26. | 3.3 | 2.60 | 13 | |||||||||||
| 9 | 0.85 | 55.2 | 2.4 | 9.59 | 3 | |||||||||||
| 10 | 0.89 | 57.8 | 1.6 | 2.00 | 8 | |||||||||||
| 11 | 2.15 | 139.7 | 0.6 | 0.45 | 15 | |||||||||||
| C1 | 1.84 | 119.6 | 0.3 | 1.14 | 3 | |||||||||||
| C2 | 0.9 | 58.5 | 0.8 | 3.58 | 2 | |||||||||||
| C3 | 0.45 | 29.2 | 3.3 | 13.9 | 2 | |||||||||||
| C5 | 0.93 | 60.4 | 1.4 | 4.49 | 3 |
Note. — The knot containing nucleus C4 is not included here.
|
|
|
|
|
|
|
|
|||||||||||||
|---|---|---|---|---|---|---|---|---|---|---|---|---|---|---|---|---|---|---|---|---|
| C1 | 143 | 0.14 | 0.04 | 14 | 8.5 | 3.9 | 1.0 | |||||||||||||
| C2 | 316 | 0.32 | 0.09 | 18 | 12.6 | 5.7 | 0.9 | |||||||||||||
| C3 | 1224 | 0.64 | 0.19 | 19 | 11.2 | 6.6 | 1.0 | |||||||||||||
| C4 | 23342 | 100. | 10.4 | 34 | 27 | 17.6 | 0.4 | |||||||||||||
| C5 | 390 | 0.39 | 0.13 | 8 | 5.2 | 2.6 | 0.9 |
Note. — A fixed Galactic column cm-2 is applied to all. cm-2 is assumed for an extra absorption column towards the nucleus (C4; Yang et al. 2001). The X-ray flux is derived assuming a spectral index , representative of X-ray jets in low power radio galaxies (Harris & Krawcznski 2006).
|
|
|
|
|
|
|
|
||||||||
|---|---|---|---|---|---|---|---|---|---|---|---|---|---|---|---|
| C1 | 0.5 | 3.1 | 0.8 | 14.6 | |||||||||||
| C2 | 0.5 | 1.6 | 2.1 | 22.1 | |||||||||||
| C3 | 0.2 | 1.2 | 7.8 | 194.9 | |||||||||||
| C5 | 0.3 | 0.6 | 1.1 | 53.1 |
Note. — is the energy density of synchrontron emission. is the equipartition magnetic field strength. is the magnetic field required to produce the observed X-ray emission through IC process. E.M. is the thermal emission measure of the hot gas. is the electron number density. is the thermal pressure of the hot gas. The knot containing nucleus, C4 is not included here.