Spectroscopic Cosmological Surveys in the Far-IR
Abstract
We show the feasibility of spectroscopic cosmological surveys with the SAFARI instrument onboard of SPICA. The work is done through simulations that make use of both empirical methods, i.e. the use of observed luminosity functions and theoretical models for galaxy formation and evolution. The relations assumed between the line emission to trace AGN and star formation activity have been derived from the observations of local samples of galaxies. The results converge to indicate the use of blind spectroscopy with the SAFARI FTS at various resolutions to study galaxy evolution from the local to the distant (z3) Universe.
Specifically, two different and independent galaxy evolution models predict about 7-10 sources to be spectroscopically detected in more than one line in a 2’ 2’ SAFARI field of view, down to the expected flux limits of SAFARI, with about 20% of sources to be detected at z2. SPICA-SAFARI will be therefore excellent at detecting high-z sources and at assessing in a direct way their nature (e.g whether mainly AGN or Star Formation powered) thanks to blind spectroscopy.
keywords:
Galaxies: evolution, active galactic nuclei, starburst – Missions: SPICA1 Introduction
In the last years our perspective of galaxy evolution has greatly changed thanks to two main findings: A) the strong correlation observed in the local Universe between the mass of the black hole at the centre of a galaxy and the velocity dispersion of the stellar component of the galactic bulge (the so-called Magorrian relation), and B) the evidence that most, if not all, galaxies during their evolution pass through a FIR/submillimetre bright phase.
A) The Magorrian relation (Magorrian et al, 1998; Ferrarese & Merrit, 2000) implies that the processes of black hole growth - through mass accretion - and bulge formation - through star formation - are intimately linked. While large elliptical galaxies with old stellar bulges are known to follow the Magorrian relation, we are not able to explain this tight correlation for active galaxies in the local Universe, as the two processes appear - at least in local Seyfert galaxies (Tommasin et al, 2009) to be almost independent of each other. The Magorrian relation therefore has to find its origins at earlier epochs.
The study of galaxy evolution necessarily implies investigation of the full cosmic history of energy generation by stars (star formation and stellar evolution) and black holes (accretion), as well as of the energy loss processes such as the feedback from AGNs, because all these are responsible for the build up of the baryonic mass in the Universe and must ultimately be consistent and set up the observed local relation between luminosity and mass in galaxies. To understand the Magorrian relation we need to make the cosmic connections between stars in a galaxy and its massive black hole. The global accretion power, measured at X-rays (Hasinger et al, 2005) and the star formation power, measured by H and rest-frame UV observations (Shim et al, 2009) were 20 times higher at z=1-1.5 than today. On a cosmic scale, the evolution of supermassive black holes (SMBHs) appears related to the evolution of the star-formation rate (SFR), strongly suggesting the presence of co-evolution (Marconi et al, 2004; Merloni et al, 2004; Shankar et al, 2009). As suggested by various authors (Heckman et al, 2004; Granato et al, 2004), the growth of bulges through SF may be directly linked to the growth of black holes through accretion. Quasars have been advocated as a source of negative feedback that would quench star formation, however no clear evidence for this ”negative feedback” has yet been found, while instead star formation is often, although not always, concomitant with AGN/QSO activity over rather long duty cycles (100 Myr - few 100 Myr). It has also been realized that the optically bright phase of quasars covers not more than one tenth of their host lifetime, as observations generally constrain quasar lifetimes to the range 107 - 108 yr. Optical studies of local galaxies show that most, if not all, large galaxy spheroids host massive relic black-holes (Richstone et al, 1998) which, in turn, suggests that a mass-accreting AGN phase is one through which all galaxies pass.
B) To account for the total energy generated by stars and that by black hole accretion, one first has to determine how much of the observed luminosity is partly or heavily extinguished (reddened or obscured). We know from both galactic and extragalactic studies that the processes of star formation and early stellar evolution is usually deeply enshrouded in dust. Active galactic nuclei (AGNs) are often optically obscured, both locally e.g. (e.g. Goulding & Alexander (2009)) and at high redshifts (Hernán-Caballero et al, 2009). Thus, galaxies pass a significant fraction of their lifetime deeply obscured by dust.
Furthermore, recent observational studies assesses that during their evolution most (if not all) galaxies pass through a FIR/submillimetre bright phase, where star formation is probably the dominant energy production mechanism, but where also supermassive black-hole accretion may contribute significantly. The luminous and ultra-luminous infrared galaxies, discovered in the 80’s by the all-sky survey of IRAS, are rare in the local Universe, but they become much more common at high-redshift, as shown by the detection of the Submillimeter Galaxies (SMG). Their integrated luminosity accounts for a significant fraction of the cosmic infrared background (CIRB) (Dole et al, 2006), the total energy of which exceeds that of the optical background and implies that more than half the star-formation activity in the universe is hidden by dust extinction.
2 MIR/FIR imaging spectroscopy is the key
Hot and young stars and black hole accretion disks show strong differences in the shape of their ionizing continuum. However the far-UV continuum, dominating the total bolometric output luminosity in both processes, is in general not directly observable, due to absorption by HI. The best tracers and indeed discriminators of accretion and star formation processes are therefore emission lines from the photo-ionized gas. In both stabursts and AGN a fairly constant fraction (10–20%) of the ionising continuum gets absorbed by gas and then re-radiated as line emission, making this observable a powerful diagnostic tool. Detecting the exact fraction of the ionizing radiation absorbed by the gas surrounding the powering sources is however not crucial if one uses emission line ratios, which are therefore the most efficient observable probes of energy production mechanisms. To overcome heavy extinction, emission lines in the near-, mid- and far-IR have to be used, especially to probe obscured regions, such as those dominated by star formation and AGN activity. MIR/FIR imaging spectroscopy is therefore essential to trace galaxy evolution throughout cosmic times in an unbiased way and so to minimize dust extinction.
By the launch of SPICA, deep cosmological surveys undertaken by ISO, AKARI and Spitzer along with those planned for Herschel and SCUBA-2 will have produced catalogues containing the fluxes of many tens of thousands of faint MIR/FIR/submm sources. Photometric surveys, however, can only be used to determine source counts and a great amount of multiwavelength photometric data and a priori assumptions are required for obtaining redshifts and luminosities. Even more importantly, photometric data alone do not allow to unambiguously differentiate between AGN and star formation activity.
Substantial progress in studying galaxy evolution can only be achieved by using spectroscopic surveys. Having direct MIR/FIR spectroscopy can not only provide us with measured (rather than estimated) redshifts, but can also unambiguoulsly characterise the detected sources, measuring the AGN and starburst contributions to their bolometric luminosities over a wide range of cosmological epochs. And this will all happen in a single observation. The great difference between the surveys that Herschel will perform and those made possible by an instrument like SAFARI is precisely this: the capability of obtaining unbiased spectroscopic data in a rest-frame spectral range that has been shown in the local Universe: 1) to be unaffected by extinction and 2) to contain strong unambiguous signatures of both AGN emission and star formation.
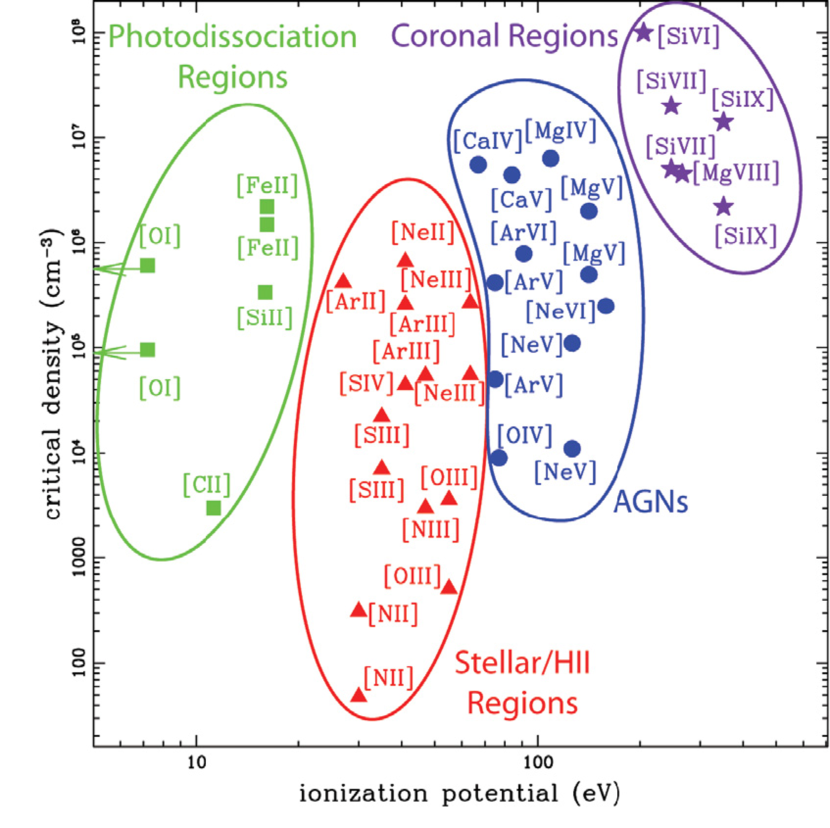
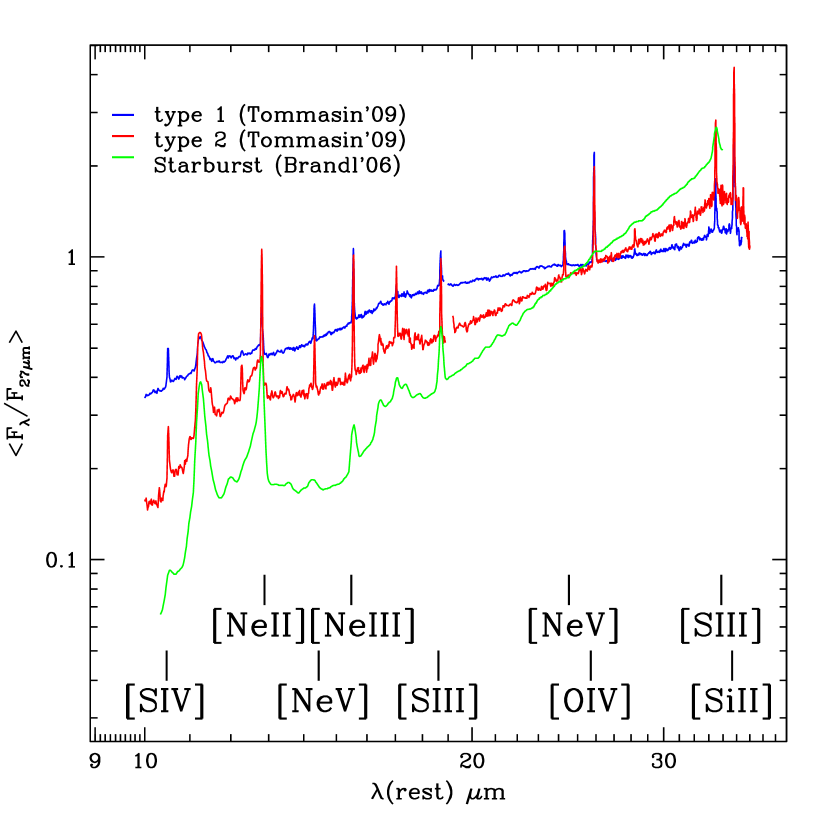
Figure 1 shows how the IR fine structure lines cover the two main physical quantities - density and ionization - characterising photoionized and photon dissociated gas. Both star formation and stellar evolution processes as well as black-hole accretion can be traced from a devoted study of a combination of lines and line ratios. The long wavelength of these lines ensures that dust extinction is minimized. Spinoglio & Malkan (1992) first predicted line intensities of AGN and starburst galaxies using photoioization codes. To have an idea of the galaxies that could be observed by SAFARI in the far-IR in the redshift range 0.4z4.0, one has to look at the rich rest frame mid-IR spectra of local galaxies that have been recently observed by the Spitzer satellite. Figure 2 shows the average Spitzer IRS high-resolution mid-IR spectra (Tommasin et al, 2009) of the 12m sample of Seyfert galaxies (Rush, Malkan & Spinoglio, 1993), compared to those of starburst galaxies (Brandl et al, 2006). The quality of the data is very high and shows the many features that can differentiate between AGN and star formation processes.
3 Are local templates observable at high z ?
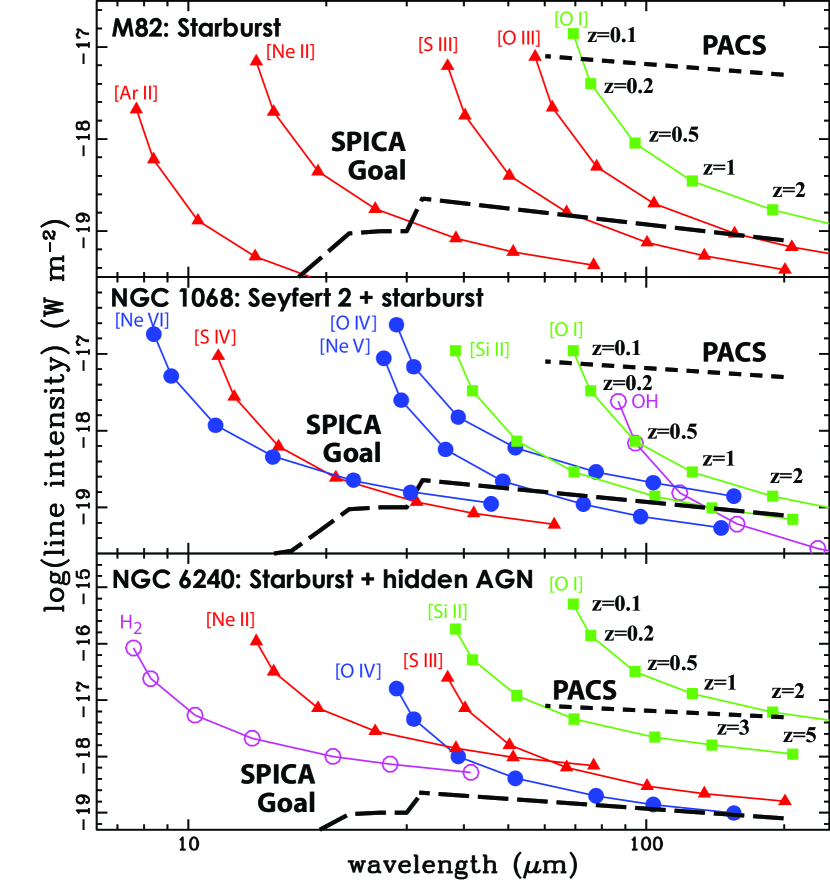
The main question that we need to answer, before moving to more detailed modeling, is if the local galaxies, for which we have detailed knowledge of their IR spectra, can be observed at high redshifts. In order to do so, we predicted the line intensities as a function of redshift (in the range z=0.1-5) for three local template objects: NGC1068 (Alexander et al, 2000; Spinoglio et al, 2005), a prototypical Seyfert 2 galaxy containing both an AGN and a starburst; NGC6240 (Lutz et al, 2003), a bright starburst with an obscured AGN and M82 (Forster Schreiber et al, 2001; Colbert et al, 1999), the prototypical starburst galaxy. We assumed that the line luminosities scale as the bolometric luminosity and adopted a luminosity evolution proportional to (z+1)2, consistent with recent Spitzer results at least up to redshift z=2 (Perez-Gonzalez et al, 2005).
For simplicity111 We note that the dependence on different cosmological models is not very strong. The popular model with = 0.27, =0.73, H0=71 km s-1 Mpc-1 would imply greater dilutions on line intensities, dilutions which increase with z by a factor of 1.5 for z=0.5 to 2.5 for z=5., we adopted an Einstein-De Sitter model Universe, with = 0 and = 1, H0=75 km s-1 Mpc-1. The luminosity distances have been derived using:
. The results for the three template objects are reported in Figure 3. Among the brightest lines we show the [SIV]10.5m, the [NeII]12.8m and the [OIII]52m diagnostic for the stellar/HII regions, the [NeV]24.3m and the [OIV]25.9m for the AGN component, the [OI]63m and the [SiII]33.5m, for the photodissociation regions and the OH and H2 rotational lines for the warm molecular component.
It is clear from the figure that the PACS spectrometer will be able to observe only the most favorable object (NGC6240) up to z=2 in the brightest line ([OI]63m), while the SPICA spectrometer goal sensitivities will allow deep infrared spectroscopic studies of these relatively low luminosity objects (LIR=4, 20, 50 10 for M82, NGC1068 and NGC6240, respectively) up to z 1-2 for most lines and pushing this limit to even higher redshifts for the brightest lines.
4 Starburst and AGN at z=0-4 with SAFARI
With the goal of estimating the number of galaxies at different redshifts that can be detected by SAFARI spectroscopic surveys, we have followed the method of: (1) identifying star formation and AGN activity by rest frame mid-IR spectroscopic tracers; (2) determining the correlations between line and continuum IR luminosity in the Local Universe; (3) using reliable IR continuum luminosity functions (derived from both observations and models) and (4) transforming the continuum luminosity functions (z=0-4) into line luminosity functions, from which to derive the number of detectable sources per redshift range. The use of different models (listed below) allows to provide a reliable range for SPICA-SAFARI predictions.
4.1 Line ratio diagrams for AGN and starbursts
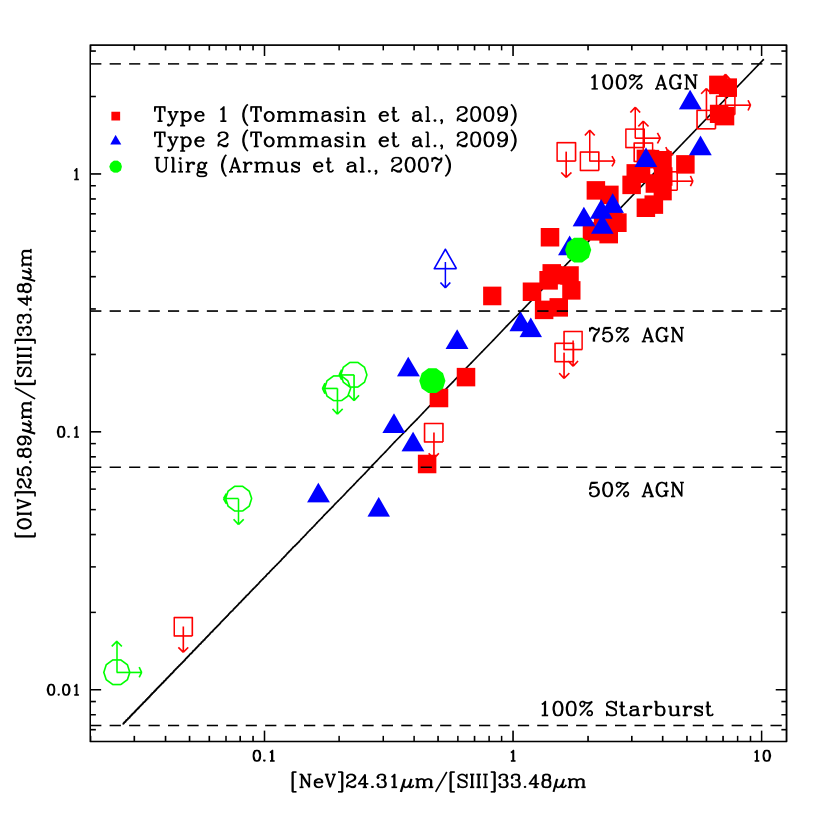
A suitable line ratio diagram able to separate the emission from the AGN from that of the starburst can be built by using lines which can be produced only in the high ionization environment due to black-hole accretion (such as the [NeV] lines and, at a less extent, [OIV]26m), together with lines generated by processes due to stellar formation and evolution (such as those which are bright in HII regions: [NeII], [SIII], etc.). However, because we aim at covering a wide redshift range as possible with the SAFARI spectrometer, we must choose lines which reside at long enough wavelengths. So we have concentrated on the [OIV]26m/[SIII]33.5m vs [NeV]24.3m/[SIII]33.5m line diagnostic diagram, that we show in Figure 4, because all these can be detected in the SAFARI spectral range for any redshift between z=0.4 and 5. In this figure we show that such line ratios can well separate AGN from star formation dominated galaxies, where we have plotted the line ratios of the 12m selected Seyfert galaxies (Tommasin et al, 2009) and the ULIRG data (Armus et al, 2007).
4.2 Correlations between line and continuum
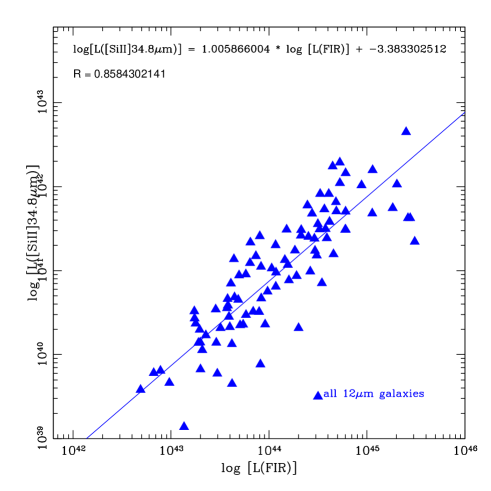
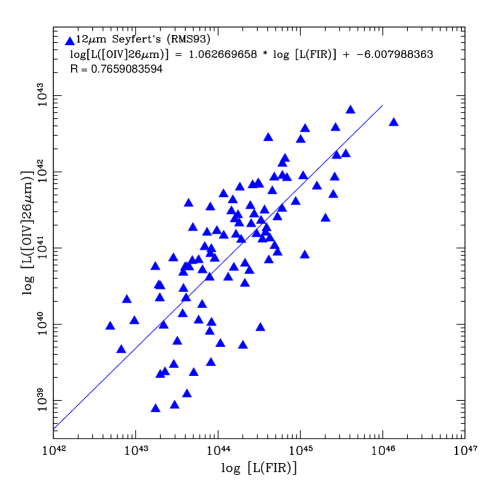
To be able to convert the IR and far-IR continuum luminosity functions into line luminosity functions, we have derived the correlations between line and continuum luminosities using the relatively large and complete sample of local Seyfert galaxies selected at 12m which counts for more than 100 objects. We present in Figure 5 and Figure 6 the relation obtainedfor this sample between the far-IR luminosity vs the [SiII]34.8m and [OIV]26m line luminosities, respectively. From such a relation we then derived an analytical formula (obtained by least squares fits) to be used in the following analysis.
4.3 Simulations with the Gruppioni model
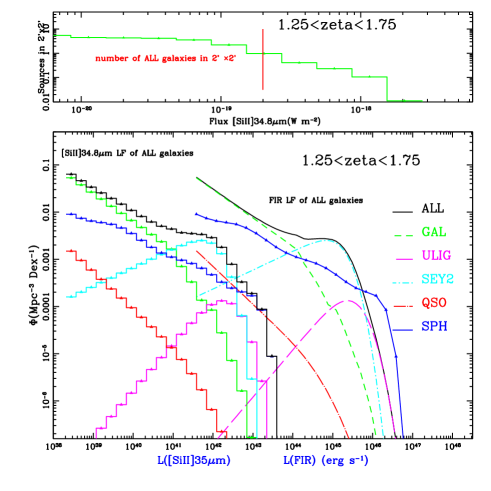
Our first method is based on the galaxy evolution model developed by Gruppioni and collaborators (Gruppioni & Pozzi, 2009; Gruppioni et al, 2009), which makes use of all the available IR data to extrapolate continuum luminosity functions from to , with distinct contributions from starbursts and AGN. To account for the population of spheroids (proto-ellipticals) which locally do not appear as substantial far-IR emitting sources, but are expected to be relevant at high redshifts (e.g. SMG galaxies), we integrated the model by Granato et al (2004) which uses an ab-initio approach for galaxy formation and evolution (see also Lapi et al (2006)) capable to predict multi-wavelength luminosity functions and number counts. As an example, we show in Figure 7 the continuum and line luminosity functions and the predicted number of sources detectable in the [SiII]34.8m line in the redshift range 1.25z1.75, as derived from the modeled FIR luminosity function.
By following this approach, we expect to detect about 7 sources per field of view, over the redshift range 0.z4.0, in the [SiII]34.8m line, which is a star formation indicator. We assumed a 5, 1 hour detection limit of 2 10. The lines of [OIV]26m (indicator of AGN activity) and [SIII]33m are, in the local galaxy population, a factor 1.5-2 fainter than the [SiII] line, though they are found to be of the same order of magnitude in LIRGs and ULIRGs (Veilleux et al, 2009). Given the above, we expect to detect all three lines simultaneously in all the observed sources.
4.4 Simulations with the Franceschini model
As a second approach we adopted the model developed by Franceschini and collaborators at Padova University (Franceschini et al, 2009). This is a backward evolution model which fits all available data from Spitzer, ISO, COBE, SCUBA, etc. It includes direct determinations of multi-wavelength redshift-dependent luminosity functions from Spitzer and accounts in great detail not only for star forming galaxies, but also for type-1 and type-2 AGNs.
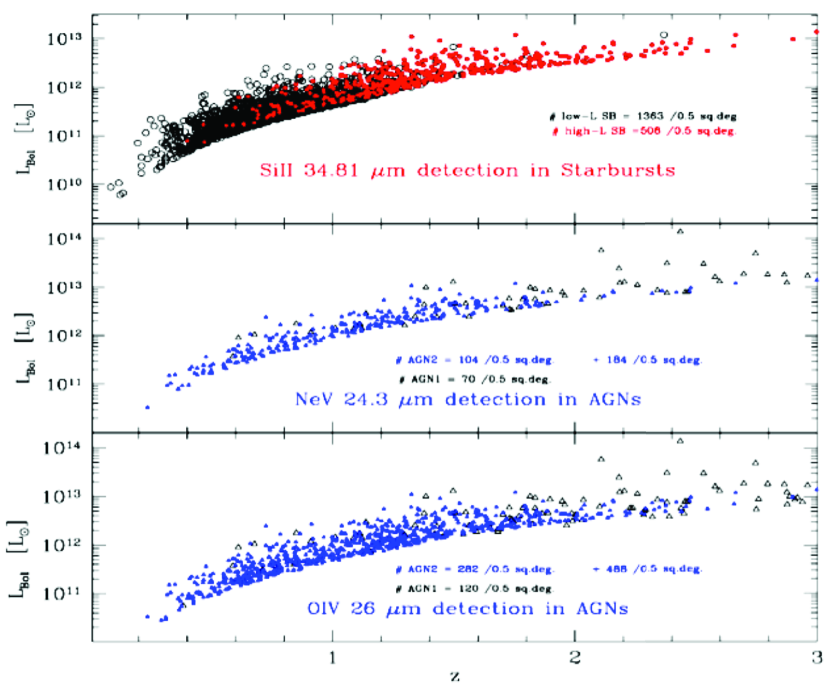
The simulation has considered the contributions of: moderate-luminosity starburst galaxies and high-luminosity starbursts, for which we have considered the [SiII]34.81m line; Type-1 Active Galactic Nuclei and quasars, for which we have considered the [NeV]24.3m and [OIV]26m lines. Type-2 AGNs also provide substantial contributions to the detection statistics (they are considered to be a fraction of the low-L and high-L SBs) We referred to the 2.0 10-19 W m-2 5, 1hr limit. We predict 4 starburst, 2 type-2 and 1 type-1 AGN per SAFARI field of view of 2\arcmin 2,́ for a total of 7 sources, in good agreement with the predictions obtained in Section 4.3 with a totally independent model. We show, as an example, in Figure 8 the results of a spectroscopic survey over 0.5 square degrees.
5 Conclusions
The main conclusions of this work are:
-
-
After decades of efforts we are close to having reliable IR measures of star formation rate and AGN accretion power, through IR/FIR spectroscopic surveys, completely unaffected by dust, allowing us to study the evolution of galaxies in terms of the power produced by the main energy production mechanisms.
-
-
Accurately measuring the power due to stellar formation & evolution and that due to gravity in collapsed nuclei is the first step towards understanding them, and how they have been related over the history of the Universe.
-
-
We learned how to measure these in local galaxies through mid-IR spectroscopy.
-
-
Blind FIR spectroscopic surveys with SAFARI can be the mean to physically measure galaxy evolution, provided that a sensitivity of 2 10-19 W/m2 (5, 1 hour) can be reached.
-
-
Two different and independent galaxy evolution models predict about 7-10 sources to be spectroscopically detected in more than one line in a 2’ 2’ SAFARI field of view, down to the expected flux limits of SPICA, with about 20% of sources to be detected at z2. SPICA-SAFARI will be therefore excellent at detecting high-z sources and at assessing in a direct way their nature (e.g whether mainly AGN or Star Formation powered) thanks to blind spectroscopy.
Acknowledgements.
This work has been funded in Italy by the Italian Space Agency (ASI) with contract ASI-I/057/08/0.References
- Alexander et al (2000) Alexander, T. et al 2000, ApJ, 536, 710
- Armus et al (2007) Armus, L. et al 2007, ApJ, 656, 148
- Brandl et al (2006) Brandl, B. R. et al . 2006, ApJ, 653, 1129
- Colbert et al (1999) Colbert J. et al 1999, ApJ, 511, 721
- Dole et al (2006) Dole, H. et al. 2006, A&A, 451, 417
- Ferrarese & Merrit (2000) Ferrarese, L. & Merrit, D. 2000, ApJ, 539, L9
- Forster Schreiber et al (2001) Forster Schreiber et al 2001, ApJ, 552, 544
- Franceschini et al (2009) Franceschini, A. et al 2009, submitted to A&A and astro-ph/0906.4264
- Goulding & Alexander (2009) Goulding, A.D., Alexander, D.M. 2009, MNRAS, 398, 1165
- Granato et al (2004) Granato, G.L. et al 2004, ApJ, 600, 580
- Gruppioni & Pozzi (2009) Gruppioni, C., Pozzi, F. 2009, in preparation
- Gruppioni et al (2009) Gruppioni, C., et al 2009, this conference
- Hasinger et al (2005) Hasinger, G., Miyaji, T., & Schmidt, M. 2005, A&A, 441, 417
- Heckman et al (2004) Heckman, T.M. et al 2004, ApJ, 613, 109
- Hernán-Caballero et al (2009) Hernán-Caballero, A. et al. 2009, MNRAS, 395, 1695
- Lapi et al (2006) Lapi, A. et al 2006, ApJ, 650, 42
- Lutz et al (2003) Lutz, D. et al 2003, A&A, 409, 867
- Magorrian et al (1998) Magorrian, J. et al 1998, AJ, 115, 2285
- Marconi et al (2004) Marconi, A. et al 2004, MNRAS, 351, 169
- Merloni et al (2004) Merloni, A., Rudnick, G., Di Matteo, T. 2004, MNRAS, 354, L37
- Perez-Gonzalez et al (2005) Perez-Gonzalez, P.G. et al 2005, ApJ, 630, 82
- Richstone et al (1998) Richstone, D. et al. 1998, Nature, 395, A14
- Rush, Malkan & Spinoglio (1993) Rush. B., Malkan, M.A. & Spinoglio, L. 1993, ApJS, 89, 1
- Shankar et al (2009) Shankar, F., Bernardi, M., Haiman, Z. 2009, ApJ, 694, 867
- Shim et al (2009) Shim, H. et al. 2009, ApJ, 696, 785
- Spinoglio & Malkan (1992) Spinoglio, L. & Malkan, M.A. 1992, ApJ, 399, 504
- Spinoglio et al (2005) Spinoglio, L., Malkan, M.A., Smith, H.A., et al 2005, ApJ, 623, 123
- Tommasin et al (2008) Tommasin, S., Spinoglio, L., Malkan, M.A. et al 2008, ApJ, 676, 836.
- Tommasin et al (2009) Tommasin, S., Spinoglio, L., Malkan, M.A., Fazio, G. 2009, submitted to ApJ.
- Veilleux et al (2009) Veilleux, S., Rupke, D. S. N., Kim, D.-C., et al. 2009, ApJS, 182, 628