Two Massive, Low-Luminosity Cores Toward Infrared Dark Clouds
Abstract
This article presents high-resolution interferometric mosaics in the 850 µm waveband of two massive, quiescent infrared dark clouds. The two clouds were chosen based on their likelihood to represent environments preceding the formation of massive stars. The brightest compact sources detected in each cloud have masses and with radii pc, implying mean densities of cm-3 and g cm-2. Supplementary data show these cores to be cold and inactive. Low upper limits to their bolometric luminosities and temperatures place them at a very early stage of evolution while current models of massive star formation suggest they have the potential to form massive stars.
Subject headings:
stars: formation — ISM: clouds — ISM: structure1. Introduction
It is fairly well established that low-mass stars form from the gravitational collapse of dense condensations, or “cores”111Following the convention presented in Williams et al. (2000), “cores” describe dense condensations of molecular gas with that will form individual stars or small stellar systems, while “clumps” describe dense cloud structures with mass that are more likely to form clusters of stars, within molecular clouds (Myers & Benson 1983; Beichman et al. 1986; Motte et al. 1998), and there are many examples of cores in nearby star-forming regions ( pc) that appear to represent the direct progenitors of low-mass stars, at least in a statistical sense (e.g., Alves et al. 2007). However, surveys of distant regions where massive stars form suffer from poor physical resolution, blending together regions with sizes comparable to clusters of stars (e.g., Shirley et al. 2003; Evans 2008). High-resolution interferometric observations can resolve these massive clumps into substructure more closely related to individual stars or stellar systems (e.g., Beuther et al. 2007; Pillai et al. 2006; Molinari et al. 2002). But in virtually all cases, these high-resolution studies have targeted regions with indications for young massive stars such as bright mid-infrared emission, masers, outflow, or compact H ii.
This article presents two interferometric mosaics of infrared dark clouds (IRDCs; Simon et al. 2006a; Perault et al. 1996; Egan et al. 1998) selected to lack massive protostars yet likely to be pre-cluster clouds. Several dense cores are detected within each IRDC, but it is the most massive cores in each cloud are the focus of this article. Following a description of our observations in § 2, the general properties of the IRDCs are described in § 3 using new single dish data together with published data. The interferometric mosaics are then considered in § 4 where the physical properties of the massive cores are presented and discussed.
2. Observations and Data Reduction
The infrared dark clouds MSX G030.88+00.13 and MSX G028.5300.25 were chosen from the catalog of Simon et al. (2006b) using Spitzer Galactic plane survey data (Benjamin et al. 2003; Carey et al. 2009), and SCUBA archival data (Di Francesco et al. 2008) to be massive, dense, and lack significant 24 µm emission. These attributes were desired to maximize the probability that the clouds are in a state preceding the formation of massive stars. The observations are summarized in Table 1.
| Date | Waveband | Conditions | TargetaaTarget A corresponds to MSX G030.88+00.13, and target B corresponds to MSX G028.5300.25. | Calibrators | Obs. Type |
|---|---|---|---|---|---|
| The Submillimeter Array | |||||
| 2007Jun24 | 350.9 GHzbb Local oscillator frequency. | ccAtmospheric opacity at 225 GHz. | B | 1751+096/1743-038 | 1 |
| 2007Jul01 | 351.0 GHzbb Local oscillator frequency. | ccAtmospheric opacity at 225 GHz. | B | 1751+096/1743-038 | 1 |
| 2007Jul07 | 350.9 GHzbb Local oscillator frequency. | ccAtmospheric opacity at 225 GHz. | A | 1751+096/1743-038 | 1 |
| 2007Oct19 | 350.9 GHzbb Local oscillator frequency. | ccAtmospheric opacity at 225 GHz. | A | 1751+096/1743-038 | 1 |
| 2008Jun02 | 340.5 GHzbb Local oscillator frequency. | ccAtmospheric opacity at 225 GHz. | A,B | 1751+096/1911-201 | 1,2 |
| 2008Jun15 | 340.5 GHzbb Local oscillator frequency. | ccAtmospheric opacity at 225 GHz. | A,B | 1751+096/1911-201 | 1,2 |
| James Clerk Maxwell Telescope | |||||
| 2007Jul17 | 334.8 GHz/350.7 GHzbb Local oscillator frequency. | ccAtmospheric opacity at 225 GHz. | A,B | V437Sct/16293-2422/G45.1 | 3 |
| 2007Jul18 | 350.7 GHz/367.3 GHzbb Local oscillator frequency. | ccAtmospheric opacity at 225 GHz. | B | V437Sct/16293-2422/HD235858 | 3,4 |
| 2007Jul19 | 334.8 GHz/350.7 GHz/367.3 GHzbb Local oscillator frequency. | ccAtmospheric opacity at 225 GHz. | A,B | V437Sct/16293-2422/G34.2 | 3,4 |
| 2007Jul20 | 334.8 GHz/350.7 GHz/367.3 GHzbb Local oscillator frequency. | ccAtmospheric opacity at 225 GHz. | A,B | V437Sct/16293-2422/G34.2 | 3,4 |
| 2008Aug06 | 367.3 GHzbb Local oscillator frequency. | ccAtmospheric opacity at 225 GHz. | A | WAql | 4 |
| 2008Nov12 | 367.3 GHzbb Local oscillator frequency. | ccAtmospheric opacity at 225 GHz. | A | HD179821/NMLCyg | 4 |
| Canda France Hawaii Telescope | |||||
| 2008Aug10 | , , | ddFull width at half maximum of the point spread function. | A,B | 2MASS | 5 |
| 2008Aug16 | , , | ddFull width at half maximum of the point spread function. | A,B | 2MASS | 5 |
Note. — (1) Mosaic observations, (2) Targeted (single pointing) observations, (3) raster scan mapping, (4) jiggle chop observations (5) direct imaging.
The target IRDCs were observed with the Submillimeter Array222The Submillimeter Array is a joint project between the Smithsonian Astrophysical Observatory and the Academia Sinica Institute of Astronomy and Astrophysics and is funded by the Smithsonian Institution and the Academia Sinica. (SMA) in its compact configuration using the 345 GHz receivers. Mosaic observations were designed to cover the brightest SCUBA emission in each IRDC. These observations preserved the full 4 GHz bandwidth and specified both high and low resolution correlator chunks with and km s-1 channel widths respectively. The data were calibrated using the MIR reduction package 333http://www.cfa.harvard.edu/cqi/mircook.html. Visibility phases were corrected using quasar observations conducted in 25 minute intervals. The bandpass was calibrated with observations of the quasar 3C279, and Uranus was used to tie down the flux scale to an accuracy of %. The visibility data were then output into MIRIAD444http://bima.astro.umd.edu/miriad format and inverted into the image domain. The mean rms level across the mosaic maps for MSX G030.88+00.13 and MSX G028.5300.25 are 5.4 mJy and 4.6 mJy for synthesized beam sizes of and oriented at position angles of and , respectively.
The James Clerk Maxwell Telescope555The James Clerk Maxwell Telescope is operated by The Joint Astronomy Centre on behalf of the Science and Technology Facilities Council of the United Kingdom, the Netherlands Organisation for Scientific Research, and the National Research Council of Canada.(JCMT) equipped with the HARP-B receiver array and ACSIS backend (Dent et al. 2000) was used to observe our target IRDCs over several nights. Spectral lines of CO, 13CO, C18O, N2H+, and H2D+ were placed in spectral windows of 250 MHz width and 61 kHz resolution. Flux levels are expected to be accurate to 15% and the pointing accuracy of the final maps are estimated to be better than . The Starlink software suite was used to grid and output the data into FITS format and IDL was used to perform final calibrations and coadding. A main beam efficiency is used to convert corrected antenna temperatures to main beam temperatures.
The Canada-France Hawaii Telescope666The Canada-France-Hawaii Telescope (CFHT) is operated by the National Research Council of Canada, the Institut National des Sciences de l’Univers of the Centre National de la Recherche Scientifique of France, and the University of Hawaii. (CFHT) was used to observe our target clouds using the WIRCam infrared detector (Puget et al. 2004). The observations were carried out in queue mode over the course of two photometric nights. The pre-processed data (de-biased, flat-fielded and sky-subtracted by the CFHT pipeline) were downloaded and further reduced using the TERAPIX777http://terapix.iap.fr software suite. The images were registered, combined by weighted mean, and tied to the 2MASS888The Two Micron All Sky Survey is a joint project of the University of Massachusetts and the Infrared Processing and Analysis Center/California Institute of Technology, funded by the National Aeronautics and Space Administration and the National Science Foundation. point source catalog flux scale to an accuracy of better than 0.02 magnitudes.
3. The IRDC environments
Figures 1a and 1b show images from the Spitzer GLIMPSE survey in which the mid-infrared extinction features that define the clouds can be clearly seen. Contours of velocity integrated 13CO overlay the images in yellow. MSX G030.88+00.13 has 2 velocity components along the line-of-sight with centroids at 95 and 107 km s-1 with respect to the local standard of rest. The higher velocity component shown in Figure 1a at 13CO emission levels of K km s-1 is widespread across the region suggesting that the IRDC is part of a larger complex including the bright infrared cluster to the northwest. MSX G028.5300.25 has a single velocity component in 13CO at 87 km s-1 shown at contour levels of K km s-1 seen to be spatially confined to the region of mid-infrared extinction. The presence of high volume density gas in these clouds is confirmed with detections of N2H+ shown as magenta contours at levels of K km s-1 and K km s-1 for Figures 1a and 1b, respectively.
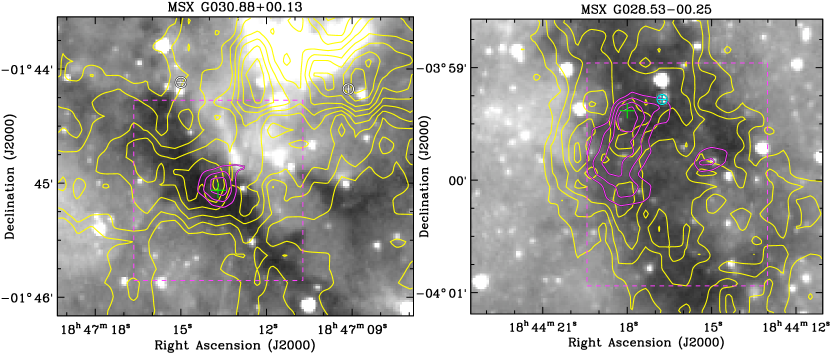
The velocity centroid of MSX G030.88+00.13 places it at the tangent point of Galactic rotation in this direction. Therefore a distance of kpc can be derived using the simple geometric relationship , where is taken to be kpc (Ghez et al. 2008; Reid et al. 2009). The distance to MSX G028.5300.25 is taken to be 5.4 kpc (Rathborne et al. 2006). The errors on these kinematic distances may be 15% or more due to non-circular motions in the Galaxy (e.g., Roman-Duval et al. 2009). The masses of the IRDCs are estimated to be several thousand solar masses based on CO isotopologue emission assuming 15 K gas in local thermodynamic equilibrium, SCUBA 850 µm continuum emission, and virial equilibrium.
There is no cm or cm emission detected toward either IRDC (Helfand et al. 2006; White et al. 2005). A total cm flux of 250 mJy seen toward the IR bright cluster in Figure 1a suggests the presence of a B0 star (Giveon et al. 2005). Two class II methanol masers are seen in the field of MSX G030.88+00.13 with velocities in rough agreement with the cloud (Pestalozzi et al. 2005). No class II masers are seen in the MSX G028.5300.25 field. However, one water maser has been detected toward an embedded source in this cloud (Wang et al. 2006). Fits to the spectral energy distributions of MIPS 24 µm sources within the IRDCs suggest they are not massive stars (Robitaille et al. 2006, 2007). Although given the large column depths observed toward the IRDCs and their distances, it is possible that more protostars are embedded in the cloud than are detected in the Spitzer data. We estimate that less than stars are embedded within the IRDC based on extrapolations from mid-infrared emission from nearby, intermediate-mass star forming regions (Padgett et al. 2008; Rebull et al. 2007) and a Salpeter stellar mass function with a lognormal turnover (Salpeter 1955; Chabrier 2003).
4. High-Resolution Sub-millimeter Wave Imaging
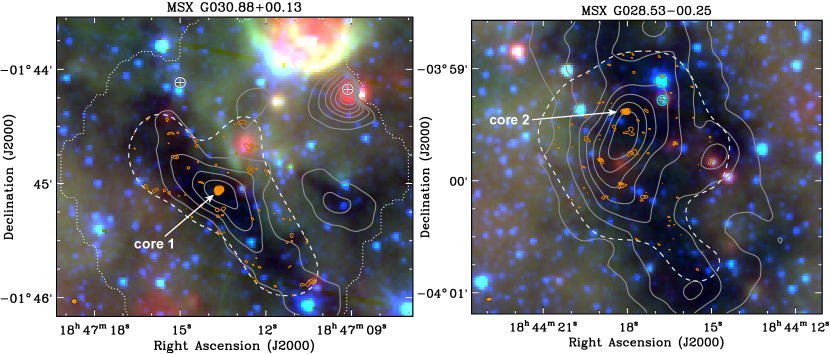
Figures 2a and 2b show the contours of the SMA mosaics overlaid on Spitzer mid-infrared composite images. The brightest sources in each mosaic dominate the compact sub-millimeter wave emission toward the IRDCs. These massive cores lie near the near the peak of the SCUBA emission and are isolated with respect to other compact sources. They are also isolated in mass with the next most massive cores in each cloud being more than a factor of 3 less massive. Table 2 displays the physical characteristics of the two compact submillimeter sources.
| R.A. | Decl. | MassaaMasses estimated using a dust temperature of 15 K and an opacity cm2 g-1 derived from (Ossenkopf & Henning 1994, Table 1). | bbRadii are derived by deconvolving the synthesized beam from the effective radius, , where and is the area contained within a 3 contour. | ||||||||
|---|---|---|---|---|---|---|---|---|---|---|---|
| Name | (mJy/bm) | (mJy) | () | (pc) | ( cm-3) | (g cm-2) | (K) | (K) | () | ||
| Core 1 | 18:47:13.7 | -01:45:03.7 | 119 | 255 | 110 | 0.082 | 0.82 | 1.1 | |||
| Core 2 | 18:44:18.0 | -03:59:23.0 | 118 | 224 | 60 | 0.056 | 1.5 | 1.3 |
4.1. Two Massive, Low-Luminosity Cores
The derived masses of the two cores are and with densities of cm-3 and g cm-2. Their free fall, or dynamical timescales are thus a few yrs implying that they are most likely short lived structures. Both cores appear marginally resolved, but are detected in the longest baseline data suggesting that perhaps there are resolved and unresolved components.
Figure 3 shows the spectral energy distributions of the cores consisting of upper limits from 1.25 µm to 70 µm and 853 µm fluxes from Table 2. A best fit gray body curve with , and THz (Ward-Thompson et al. 2002) limits the envelope temperatures while summation under the solid curves of Figure 3 provide upper limits to the bolometric luminosities and temperatures (Myers & Ladd 1993).
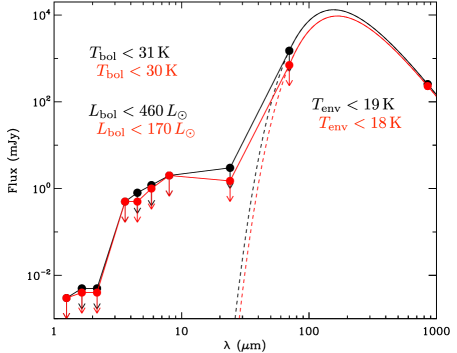
High values of in solar units and low values for K for these cores are signs of extreme youth. Class 0 protostars, the earliest SED class, are marked by (Bontemps et al. 1996; Andre et al. 2000) and K (Chen et al. 1995). Given the large distances to these cores and the photometric sensitivity, the existence of a low luminosity sources deeply embedded within the cores cannot be ruled out. However, it is clear that no massive protostars exist in these cores.
Across the SMA bandpass, the cores are only detected in CO and HCO+. The CO is strongly filtered by the interferometer making a useful interpretation of the emission from this low density gas tracer difficult. However, no clear indication of outflow is seen toward either core in the single dish or interferometric data further indicating their extreme youth. Upper limits to SO and CH3OH emission highlight the difference between these cores and the spectral signatures of hot cores such as Orion KL (Schilke et al. 1997).
Figure 4 shows the composite spectra of molecular transitions tracing dense gas toward the two cores with the velocity scale shifted relative to the centroid velocity of N2H+ emission measured to be 107.2 km s-1 and 86.8 km s-1 for core 1 and 2, respectively. Core 1 shows an HCO+ emission feature that lies blueward of the systemic velocity. This may be an indication of HCO+ self-absorption, but there is also the possibility that the emission in the central channels is widespread and filtered out by the interferometer. Core 2 shows a weak feature in the HCO+ spectral window blueward of its systemic velocity that may be a sign of a similar spectral feature to core 1.

Also shown in Figure 4 are spectra of ortho-H2D+ toward the cores. Core 1 shows an emission feature with 4.3 significance centered at 106.6 km s-1 with a full width of km s-1. Core 2 shows a broader feature with km s-1 width at a 3.1 significance level. This molecular species is thought to trace cold, dense, and chemically evolved gas in the deep interior of pre- or proto-stellar cores (Walmsley et al. 2004; Vastel et al. 2006; Caselli et al. 2008). Following Caselli et al. (2008), the integrated line fluxes of 0.13 K km s-1 and 0.17 K km s-1 for core 1 and 2 respectively translate to column densities of H2D+ cm-2 using a kinetic temperature K and a critical density cm-3. The fractional abundances of ortho-H2D+ are H2D+H–. Varying from 10 to 15 K and from to cm-3 changes these values by a factor of about 2. These numbers are significantly smaller than the values found for low-mass pre- and proto-stellar cores (Vastel et al. 2006; Caselli et al. 2008) as well as in Orion B (Harju et al. 2006). This could be due to an intrinsic dearth of H2D+. However, given the poor physical resolution of our single dish observations and the propensity for H2D+ to trace the innermost regions of cores, it may be that this discrepancy is due in large part to beam dilution.
4.2. Discussion
The signposts of massive star formation toward MSX G030.88+00.13 lend credence to the idea that there might exist regions within the cloud where massive stars will, but have not yet, formed. The characteristics of core 1 make it a good candidate for one such region. While MSX G028.5300.25 currently shows no signs of high-mass star formation, core 2 shares similar traits to core 1 as being a potential massive star precursor.
The bolometric luminosity of cores versus the envelope mass, or the – diagram is a useful parameter space to visualize the evolution of cores into stars (e.g., Bontemps et al. 1996). Figure 5 shows data from several previous studies of massive star formation plotted on the – diagram (see figure caption). The linear trend in log-log space is typical for such studies. Evolutionary tracks based on the turbulent core model of McKee & Tan (2003) calibrated by the data of Molinari et al. (2008) are also overlaid on the plot. The positions of core 1 and 2 from this study are seen to lie well below the trend set by previous data, another indication that they are at an early evolutionary stage. According to the Molinari et al. (2008) evolutionary tracks, core 1 is on track to evolve into a star with , or of an early B spectral type while core 2 is set to evolve into a star with , or a mid-B spectral class.
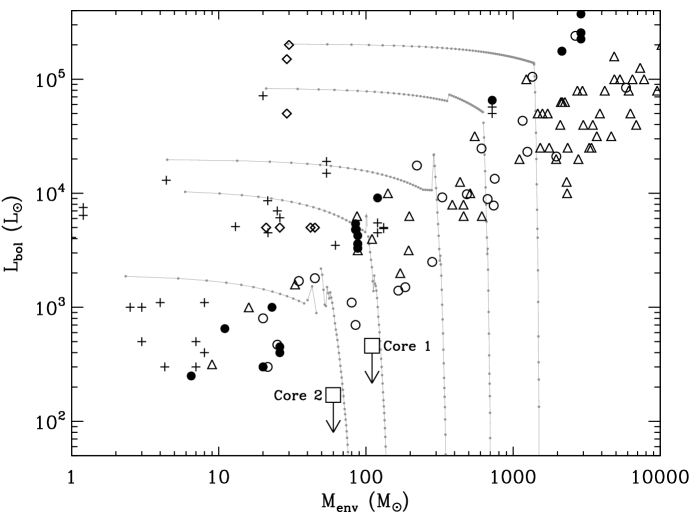
The final stellar masses implied from the evolutionary tracks in Figure 5 may be underestimates. The star formation efficiency of dense cores is expected to be between 25–50% (Matzner & McKee 2000; Alves et al. 2007). Therefore if these cores collapse monolithically they have sufficient mass to form stars with mass between 15 and 60 . Indeed, the evolutionary models of André et al. (2008) put core 1 on track to evolve into a star of and core 2 into a star with . However, it is not possible to tell from our data whether these cores will undergo monolithic collapse or will further fragment into smaller cores. Observations resolving the expected fragmentation length scales ( pc) are needed.
The large millimeter continuum survey of the Cygnus X region has also revealed dense and massive cores at an early stage of evolution (Motte et al. 2007). However, of the most massive cores in their sample ( ), 61% have 21 µm MSX sources associated with them, and the remaining either contain compact H ii, show 70 µm emission above our scaled detection limits (S. Bontemps, F. Motte, private communication), or have SiO line strengths and widths that indicate protostellar activity.
Therefore it seems that the cores of this study are unique, and their existence may have implications for our understanding of massive star formation. The selection criteria and use of high-resolution in the sub-millimeter wave band are key components to these discoveries. As the characterizations of IRDCs progress (e.g., Chambers et al. 2009) further high-resolution studies of pre-cluster environments will provide statistics on the frequency and nature of these kinds of objects.
5. Summary
This article presents interferometric mosaic observations in the 850 µm waveband toward two infrared dark clouds chosen to be likely representations of pre-cluster environments in the Galaxy. Both clouds are massive and dense but show no sign of massive star formation. The most massive cores in each mosaic dominate the compact 850 µm emission and are spatially isolated near the peak of the low-resolution continuum emission. With masses of 110 and 60 average densities of cm-3 and g cm-2 they have the potential to form massive stars. However, upper limits to their bolometric temperatures and luminosities, no clear indication of CO outflow, and their relatively featureless spectra all indicate a very early stage of evolution. Detections of ortho-H2D+ and N2H+ support the interpretation that these cores are in a cold and dense state preceding significant star formation activity. The comparison of these data with theoretical and observational studies of massive star forming regions suggest that these cores occupy a unique region of – parameter space placing them on track to evolve into stars anywhere from mid to early B stars up to O stars.
References
- Alves et al. (2007) Alves, J., Lombardi, M., & Lada, C. J. 2007, A&A, 462, L17
- André et al. (2008) André, P., et al. 2008, A&A, 490, L27
- Andre et al. (2000) Andre, P., Ward-Thompson, D., & Barsony, M. 2000, Protostars and Planets IV, 59
- Beichman et al. (1986) Beichman, C. A., Myers, P. C., Emerson, J. P., Harris, S., Mathieu, R., Benson, P. J., & Jennings, R. E. 1986, ApJ, 307, 337
- Benjamin et al. (2003) Benjamin, R. A., et al. 2003, PASP, 115, 953
- Beuther et al. (2007) Beuther, H., Leurini, S., Schilke, P., Wyrowski, F., Menten, K. M., & Zhang, Q. 2007, A&A, 466, 1065
- Beuther et al. (2002) Beuther, H., Schilke, P., Menten, K. M., Motte, F., Sridharan, T. K., & Wyrowski, F. 2002, ApJ, 566, 945
- Bontemps et al. (1996) Bontemps, S., Andre, P., Terebey, S., & Cabrit, S. 1996, A&A, 311, 858
- Carey et al. (2009) Carey, S. J., et al. 2009, PASP, 121, 76
- Caselli et al. (2008) Caselli, P., Vastel, C., Ceccarelli, C., van der Tak, F. F. S., Crapsi, A., & Bacmann, A. 2008, A&A, 492, 703
- Chabrier (2003) Chabrier, G. 2003, PASP, 115, 763
- Chambers et al. (2009) Chambers, E. T., Jackson, J. M., Rathborne, J. M., & Simon, R. 2009, ApJS, 181, 360
- Chen et al. (1995) Chen, H., Myers, P. C., Ladd, E. F., & Wood, D. O. S. 1995, ApJ, 445, 377
- Dent et al. (2000) Dent, W., et al. 2000, in Astronomical Society of the Pacific Conference Series, Vol. 217, Imaging at Radio through Submillimeter Wavelengths, ed. J. G. Mangum & S. J. E. Radford, 33–+
- Di Francesco et al. (2008) Di Francesco, J., Johnstone, D., Kirk, H., MacKenzie, T., & Ledwosinska, E. 2008, ApJS, 175, 277
- Egan et al. (1998) Egan, M. P., Shipman, R. F., Price, S. D., Carey, S. J., Clark, F. O., & Cohen, M. 1998, ApJ, 494, L199+
- Evans (2008) Evans, II, N. J. 2008, in Astronomical Society of the Pacific Conference Series, Vol. 390, Pathways Through an Eclectic Universe, ed. J. H. Knapen, T. J. Mahoney, & A. Vazdekis, 52–+
- Ghez et al. (2008) Ghez, A. M., et al. 2008, ApJ, 689, 1044
- Giveon et al. (2005) Giveon, U., Becker, R. H., Helfand, D. J., & White, R. L. 2005, AJ, 130, 156
- Harju et al. (2006) Harju, J., et al. 2006, A&A, 454, L55
- Helfand et al. (2006) Helfand, D. J., Becker, R. H., White, R. L., Fallon, A., & Tuttle, S. 2006, AJ, 131, 2525
- Matzner & McKee (2000) Matzner, C. D., & McKee, C. F. 2000, ApJ, 545, 364
- McKee & Tan (2003) McKee, C. F., & Tan, J. C. 2003, ApJ, 585, 850
- Molinari et al. (2008) Molinari, S., Pezzuto, S., Cesaroni, R., Brand, J., Faustini, F., & Testi, L. 2008, A&A, 481, 345
- Molinari et al. (2002) Molinari, S., Testi, L., Rodríguez, L. F., & Zhang, Q. 2002, ApJ, 570, 758
- Motte et al. (1998) Motte, F., Andre, P., & Neri, R. 1998, A&A, 336, 150
- Motte et al. (2007) Motte, F., Bontemps, S., Schilke, P., Schneider, N., Menten, K. M., & Broguière, D. 2007, A&A, 476, 1243
- Myers & Benson (1983) Myers, P. C., & Benson, P. J. 1983, ApJ, 266, 309
- Myers & Ladd (1993) Myers, P. C., & Ladd, E. F. 1993, ApJ, 413, L47
- Ossenkopf & Henning (1994) Ossenkopf, V., & Henning, T. 1994, A&A, 291, 943
- Padgett et al. (2008) Padgett, D. L., et al. 2008, ApJ, 672, 1013
- Perault et al. (1996) Perault, M., et al. 1996, A&A, 315, L165
- Pestalozzi et al. (2005) Pestalozzi, M. R., Minier, V., & Booth, R. S. 2005, A&A, 432, 737
- Pillai et al. (2006) Pillai, T., Wyrowski, F., Menten, K. M., & Krügel, E. 2006, A&A, 447, 929
- Puget et al. (2004) Puget, P., et al. 2004, in Society of Photo-Optical Instrumentation Engineers (SPIE) Conference Series, Vol. 5492, Society of Photo-Optical Instrumentation Engineers (SPIE) Conference Series, ed. A. F. M. Moorwood & M. Iye, 978–987
- Rathborne et al. (2006) Rathborne, J. M., Jackson, J. M., & Simon, R. 2006, ApJ, 641, 389
- Rebull et al. (2007) Rebull, L. M., et al. 2007, ApJS, 171, 447
- Reid et al. (2009) Reid, M. J., et al. 2009, ArXiv e-prints
- Robitaille et al. (2007) Robitaille, T. P., Whitney, B. A., Indebetouw, R., & Wood, K. 2007, ApJS, 169, 328
- Robitaille et al. (2006) Robitaille, T. P., Whitney, B. A., Indebetouw, R., Wood, K., & Denzmore, P. 2006, ApJS, 167, 256
- Roman-Duval et al. (2009) Roman-Duval, J., Jackson, J. M., Heyer, M., Johnson, A., Rathborne, J., Shah, R., & Simon, R. 2009, ApJ, 699, 1153
- Salpeter (1955) Salpeter, E. E. 1955, ApJ, 121, 161
- Schilke et al. (1997) Schilke, P., Groesbeck, T. D., Blake, G. A., & Phillips, T. G. 1997, ApJS, 108, 301
- Shirley et al. (2003) Shirley, Y. L., Evans, II, N. J., Young, K. E., Knez, C., & Jaffe, D. T. 2003, ApJS, 149, 375
- Simon et al. (2006a) Simon, R., Jackson, J. M., Rathborne, J. M., & Chambers, E. T. 2006a, ApJ, 639, 227
- Simon et al. (2006b) Simon, R., Rathborne, J. M., Shah, R. Y., Jackson, J. M., & Chambers, E. T. 2006b, ApJ, 653, 1325
- Sridharan et al. (2002) Sridharan, T. K., Beuther, H., Schilke, P., Menten, K. M., & Wyrowski, F. 2002, ApJ, 566, 931
- Vastel et al. (2006) Vastel, C., Caselli, P., Ceccarelli, C., Phillips, T., Wiedner, M. C., Peng, R., Houde, M., & Dominik, C. 2006, ApJ, 645, 1198
- Walmsley et al. (2004) Walmsley, C. M., Flower, D. R., & Pineau des Forêts, G. 2004, A&A, 418, 1035
- Wang et al. (2006) Wang, Y., Zhang, Q., Rathborne, J. M., Jackson, J., & Wu, Y. 2006, ApJ, 651, L125
- Ward-Thompson et al. (2002) Ward-Thompson, D., André, P., & Kirk, J. M. 2002, MNRAS, 329, 257
- White et al. (2005) White, R. L., Becker, R. H., & Helfand, D. J. 2005, AJ, 130, 586
- Williams et al. (2000) Williams, J. P., Blitz, L., & McKee, C. F. 2000, Protostars and Planets IV, 97