On the B state of NaCs
Abstract
The B X system of NaCs molecule is investigated experimentally by polarization labelling spectroscopy technique. The inverted perturbation approach method is used to construct the potential energy curve of the B state, providing accurate eigenenergies for vibrational levels .
pacs:
31.50.Df, 33.20.Kf, 33.20.Vq, 42.62.FiThe NaCs molecule belongs to the least known heteronuclear alkali dimers. Only the two lowest electronic states, X and a, have been studied thoroughly and with high accuracy 1 ; 2 . In addition, three excited states available by optical excitation from the ground state, B(1), D(2) and 3, have been observed and partially characterized 1 ; 3 ; 4 ; 5 . Our present study is focused on the B state which is of considerable interest because of its involvement in photoassociation processes 6 ; 7 . When observing excitation spectra of the B X band system of NaCs we found that the previously published potential energy curve of the B state 5 provides eigenenergies of rovibrational levels which are off by up to 5 cm-1 comparing the experimental ones. In this communication we present an improved characterization of the lower part of the B state. A work on full description of this state is currently in progress in our laboratory.
The experimental arrangement and the employed V-type optical-optical double resonance polarization labelling spectroscopy technique were very similar to that described in our previous papers 8 ; 9 . NaCs molecules were produced in a heat-pipe oven, heated to about 940 K and filled with 4 mbar of helium buffer gas. Our method requires two independent pump and probe lasers. The copropagating laser beams were crossed in the centre of the heat-pipe. The linearly or circularly polarized pump beam induced transitions from the ground state of NaCs to the investigated B state, while the probe beam was set at fixed wavelengths resonant with known transitions in the D X system 1 , thus labelling known rovibrational levels in the X. As a pump laser served the optical parametric oscillator with an amplifier (Sunlite Ex, Continuum) pumped with an injection seeded Nd:YAG laser (Powerlite 8000). This system provided laser pulses with energy of a few mJ and spectral width approximately 0.1 cm-1, tuneable in the present experiment in the nm range. The wavelength of the pump laser was controlled and calibrated to better than 0.1 cm-1 by measuring two additional signals: optogalvanic spectrum of argon and transmission fringes of a Fabry-Pérot interferometer 0.5 cm long. As the probe laser we used a home built dye laser pumped synchronously with the same Nd:YAG laser and operated on Coumarin 153 dye. The laser frequency was measured with HighFinesse WS-7 wavemeter. Crossed polarizers were placed at both sides of the oven in the path of the probe beam. At these frequencies, at which transitions induced by the pump beam shared the same lower level with the probe transition, some of the probe light passed through the analyzer. This residual beam was monitored with a photomultiplier tube connected to the boxcar averager (Stanford Research Systems, SR250). Thus obtained excitation spectra of the B X system of NaCs were stored in a computer together with the reference spectra of argon and frequency markers of the interferometer.
An example of the recorded spectrum of NaCs is shown in Figure 1. The highly accurate molecular constants of the ground X state 1 and energy levels computed from the existing B state potential curve 5 provided unambiguous assignment of the observed lines. However, we found that whereas the experimental positions of the lowest () vibrational levels in the B state followed precisely the predicted ones, the deviation grew systematically for higher vibrational numbers, in some cases exceeding 5 cm-1. This observation justified new determination of the excited state potential. In view of a complex pattern of doubling in the B state pointed out in the previous work 5 and confirmed by observation of irregular spacing between the relevant , and lines in the spectra, we confined the further analysis to lines only, corresponding to transitions to -parity levels in the upper state.
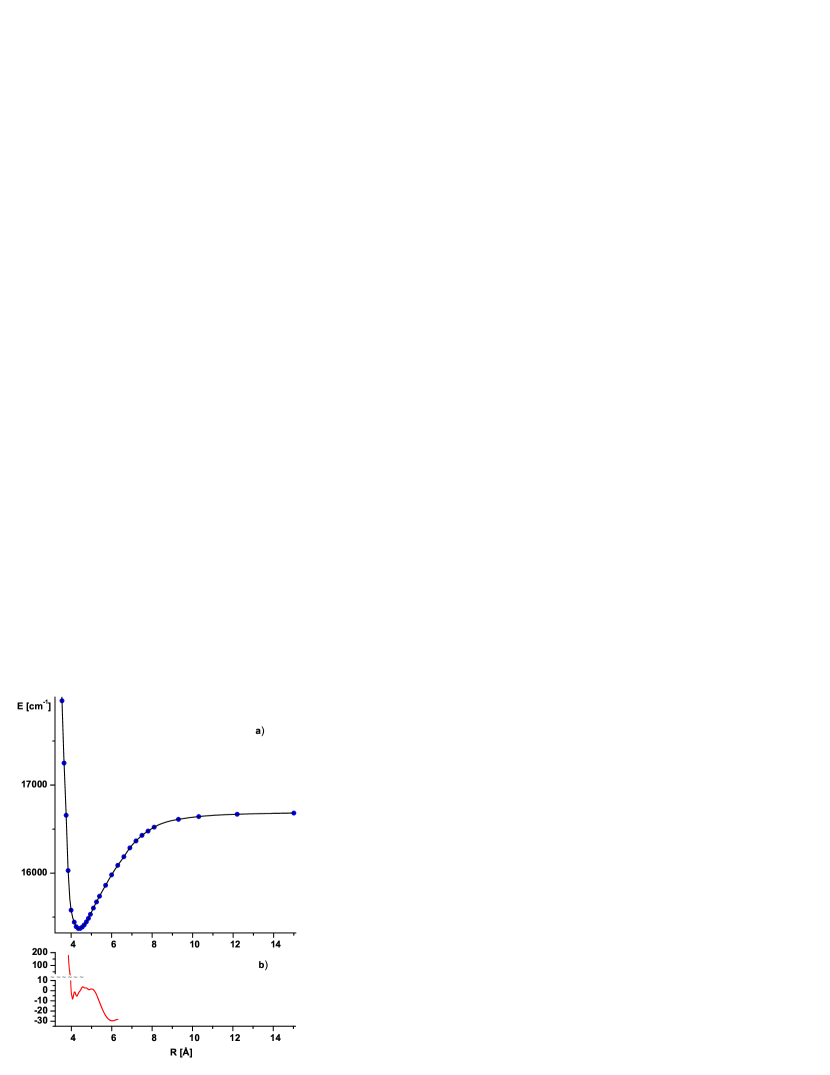
The recorded spectra provided information about rovibrational -parity levels in the B state. We identified levels with vibrational quantum numbers between 0 and 15 and rotation quantum numbers in the range . The measured wavenumbers of spectral lines were converted to energies of the B state levels referred to the bottom of the X state potential well using the ground state Dunham coefficients of Diemer et al. 1 . The potential curve of the B state was constructed with the pointwise inverted perturbation approach (IPA) method 10 by ensuring that the rovibronic energies calculated from the potential curve matched the experimental energies. The final curve is defined by 33 points (Table 1 and Figure 2) which are interpolated using a natural spline algorithm 11 to generate a numerical mesh of 9000 points between 3 and 15 Å. It reproduces the measured term energies of vibrational levels in the B state with an r.m.s. error of 0.17 cm-1. This curve differs significantly from the one published previously by Zaharova et al. 5 , as displayed in Figure 2. The error analysis shows that the observed levels determine the potential curve reliably only between 3.85 and 6.3 Å. Points outside this range are supplied here only to ensure proper boundary conditions for solving the Schrödinger equation.

| [Å] | [cm-1] | [Å] | [cm-1] |
|---|---|---|---|
| 3.00 | 29008.4143 | 5.10 | 15602.4424 |
| 3.30 | 21485.8095 | 5.25 | 15671.5661 |
| 3.45 | 19029.1720 | 5.40 | 15737.4482 |
| 3.55 | 17957.5184 | 5.70 | 15862.3295 |
| 3.65 | 17250.4519 | 6.00 | 15980.2352 |
| 3.75 | 16656.9477 | 6.30 | 16088.2737 |
| 3.85 | 16028.9352 | 6.60 | 16185.4479 |
| 4.00 | 15579.1650 | 6.90 | 16286.3384 |
| 4.15 | 15443.4526 | 7.20 | 16365.2600 |
| 4.25 | 15390.9772 | 7.50 | 16428.0184 |
| 4.35 | 15370.8956 | 7.80 | 16478.1001 |
| 4.45 | 15371.1314 | 8.10 | 16521.9956 |
| 4.55 | 15387.6360 | 9.30 | 16609.9880 |
| 4.65 | 15412.1144 | 10.30 | 16641.3947 |
| 4.75 | 15446.3142 | 12.20 | 16669.0511 |
| 4.85 | 15485.5787 | 15.00 | 16682.1325 |
| 4.95 | 15530.9193 |
Acknowledgements.
This work has been funded in part by Grant No. N202 103 31/0753 from the Polish Ministry of Science and Higher Education.References
- (1) U. Diemer, H. Weickenmeier, M. Wahl and W. Demtröder, Chem. Phys. Lett. 104 (1984) 489.
- (2) O. Docenko, M. Tamanis, J. Zaharova, R. Ferber, A. Pashov, H. Knöckel and E. Tiemann, J. Phys. B39 (2006) S929.
- (3) O. Docenko, M. Tamanis, J. Zaharova, R. Ferber, A. Pashov, H. Knöckel and E. Tiemann, J. Chem. Phys. 124 (2006) art. no. 174310.
- (4) J. Zaharova, O. Nikolayeva, M. Tamanis, M. Auzinsh, R. Ferber, A. Zaitsevskii, E.A. Pazyuk nad A.V. Stolyarov, J. Chem. Phys. 124 (2006) art. no. 184318.
- (5) . J. Zaharova, O. Docenko, M. Tamanis, R. Ferber, A. Pashov, H. Knöckel and E. Tiemann, J. Chem. Phys. 127 (2007) art. no. 224302.
- (6) C. Haimberger, J. Kleinert, M. Bhattacharya and N.P. Bigelov, Phys. Rev. A70 (2004) 021402(R).
- (7) C. Haimberger, J. Kleinert, O. Dulieu and N.P. Bigelov, J. Phys. B39 (2006) S957.
- (8) A. Grochola, W. Jastrzebski, P. Kortyka and P. Kowalczyk, J. Mol. Spectrosc. 221 (2003) 279.
- (9) N.H. Bang, A. Grochola, W. Jastrzebski and P. Kowalczyk, J. Chem. Phys. 130 (2009) art. no. 124307.
- (10) A. Pashov, W. Jastrzȩbski and P. Kowalczyk, Comput. Phys. Commun. 128 (2000) 622.
- (11) C. DeBoor, A Practical Guide to Splines, Springer, Berlin, 1978.