Near Kohn anomalies in the phonon dispersion relations of lead chalcogenides
Abstract
We present ab-initio phonon dispersion relations for the three lead chalcogenides PbS, PbSe, and PbTe. The acoustic branches are in very good agreement with inelastic neutron-scattering data and calculations of the specific heat give good agreement with experimental data. The pronounced minimum of the transverse optical branch at due to the near-ferroelectricity of the lead chalcogenides is qualitatively reproduced. In addition, we find a pronounced dip in the longitudinal optical branch at . This dip was previously explained as the effect of “free carriers” (due to the presence of impurities). The calculations demonstrate that it persists also in the case of pure lead chalcogenides. We explain the dip as a ”near Kohn anomaly” which is associated with the small electronic band-gap at the high-symmetry point L.
pacs:
63.20.dk,65.40.BaI Introduction
Lead chalcogenides (PbS, PbSe, PbTe) are IV-VI narrow gap semiconductor compounds with rock salt crystal structure. In nanocrystalline form these materials manifest superior optical and electrical properties which opens a wide field of applications. Their small gap (280 - 410 meV at room temperaturelandolt ), a large exciton diameter (e.g., in PbS and in PbSe wise ) and small effective electron and hole masses make them a good medium for optoelectronics, photovoltaic devices and quantum confinement studies wise ; wehrenberger . An infrared diode laser was constructed PbSe diod laser based on PbSe/PbEuTe quantum dots. Recent studies klimov indicate that PbSe nanocrystals might be good candidates for high-efficient solar cells. Because of impact ionization (an electron-hole pair with large energy decays into several electron-hole pairs with lower energy), efficient carrier multiplication occurs.
In order to fully understand the de-excitation of hot carriers - in particular, the ratio of radiative versus non-radiative decay channels and the mechanisms of line broadening - it is necessary to learn more about the electron-phonon coupling in lead chalcogenides. While high-quality calculations of the electronic bands are available (Ref. hummer, and references therein), the understanding of the phonon dispersion of the lead chalcogenides is much less complete. Experimentally, phonon dispersion relations of PbS, PbSe, and PbTe were obtained by inelastic neutron scattering measurements experiment-PbTe ; experiment-PbS ; experiment-PbSe . Simulations of the phonon dispersions have been done so far mainly on the level of the semi-empirical shell model experiment-PbTe ; experiment-PbS ; experiment-PbSe ; upad ; maksimenko . All three materials exhibit the same anomalies in the dispersion relation: A strong softening of the TO (transverse optical) phonon branch around and an unexpected dip of the LO (longitudinal optical) branch at . The TO softening is due to the near-ferroelectric character of the lead chalcogenides jantsch (in a truly ferroelectric material, this mode would acquire a complex frequency, i.e., the fcc structure would no longer be the most stable one). Different explanations were proposed for the LO dip. Cowley and Dolling Cowley&Dolling attributed the dip to screening by free carriers in the crystal. A term for free carrier doping was consequently introduced in the recent semi-empirical phonon calculations by Upadhyaya et al. upad . Maksimenko and Mishchenko maksimenko explain the LO dip by the dipolar pseudo-Jahn-Teller effect pJT . Recent ab-initio calculations of the phonon dispersions of PbS, PbSe, and PbTe romero08 displayed a minimum of the LO mode at which (for PbSe and PbTe) turned into a strongly pronounced dip when spin-orbit coupling was taken into account. The reason for the strong dip enhancement remained open.
We present in this paper a systematic ab-initio study of the three phonon dispersion relations of the lead chalcogenides. The small gap and the near-ferroelectric behavior demand a careful choice of calculation parameters such as sampling grid and pseudopotentials. Our calculations reproduce quantitatively the acoustic modes. The anomalies of LO and TO modes are qualitatively reproduced in the calculations (since they are strongly temperature dependent maksimenko , anharmonic effects would have to be taken into account in order to quantitatively reproduce the measurements which were performed at room temperature). Our calculations show that a pronounced LO dip is present in the pure materials even without free carrier doping. We explain this dip in analogy to the Kohn anomalies kohn that occur in the semi-metal graphene piscanec04 . Furthermore, we demonstrate that ab-initio calculations can reproduce very well the specific heat of PbS and compare with recent calculations cardona07 ; romero08 that include the effect of spin-orbit effects.
In section II we summarize the computation method and give the details of the calculations. In section III we discuss the dispersion relations of the three lead chalcogenides. Section IV presents data on the specific heat in comparison with experimental data. In the appendix, we show that the electronic k-point sampling must be dense enough around the high-symmetry point L in order to reproduce the LO dip at .
II Computational Details
In the harmonic approximation, the phonon frequencies (as a function of the wave-vector ) are obtained from the equation
| (1) |
The dynamical matrix corresponds to the force on atom in direction linearly induced by a displacement of atom in direction . We calculate it with density functional perturbation theory (DFPT) DFPT ; baroni as implemented in the code ABINIT abinit . We use the local density approximation (LDA) for the exchange-correlation functional LDA . The wave-functions are expanded in plane waves. Core electrons are replaced by pseudopotentials.
We found that the phonon frequencies are very sensitive to the choice of the lead pseudopotential. In particular, it is important to include the lead 5d semi-core electrons as valence electrons in the calculation. (This is different from the case of pure lead, where the 5d electrons do not alter the phonon frequencies significantly verstraete ). The reason lies in the strongly ionic character of the lead chalcogenides: the lead atoms tend to transfer the 6p valence electrons to the anions. It is then the overlap of the remaining 6s and 5d electrons of lead with the 3p orbitals of the anion that determines the covalent part of the PbX bond (where X stands for the anion S, Se, or Te, respectively). Since the 5d orbitals contribute to this bonding, their density should be calculated explicitly and not be substituted by a pseudopotential. We tested different Troullier-Martins pseudopotentials created with the FHI pseudopotential generation code fhi . We verified that the corresponding FHI potential for lead and the chalcogens from the ABINIT web-page yielded converged results for the phonon frequencies. The plane-wave energy cutoff is 40 Ha.
It has been observed for ferroelectric materials that ab-initio phonon calculations give better agreement with experimental data if they are performed at the experimental lattice constant, rather than the lattice constant obtained by total energy minimization (see Ref. resta, and references therein). The reason is that the LDA tends to underestimate the lattice constant and in (near) ferroelectric materials even a small underestimation of 1% strongly influences the ferroelectric instability. Our phonon calculations are performed using the experimental lattice constants at 300K. The experimental lattice constant are given in Table 1 together with the values of the optimized lattice constants. Since anharmonic effects are neglected (and very difficult to include on an ab-initio level bonini ), we do not expect to fully reproduce the temperature dependence of the phonon dispersions.
| DFT-LDA | Exp. (30 K) | Exp. (300 K) | |
|---|---|---|---|
| PbS | 5.810 Å | 5.909 Å | 5.936 Å |
| PbSe | 6.012 Å | 6.098 Å | 6.124 Å |
| PbTe | 6.318 Å | 6.428 Å | 6.462 Å |
The influence of the electronic k-point sampling on the phonon dispersion is discussed in the appendix. For converged results, we used a (7,3) nested grid, i.e., a 777 (shifted) Monkhorst-Pack shifted k-point sampling with an additional 333 sampling of the volume element around the high symmetry point L. In order to obtain the phonons at arbitrary phonon wave vector , the dynamical matrix is calculated on a 888 mesh and then Fourier-interpolated for arbitrary . In order to properly reproduce the LO dip around , we calculated the dynamical matrix explicitly for a set of -points along the high-symmetry lines , , close to the point.
III Phonon dispersion relations
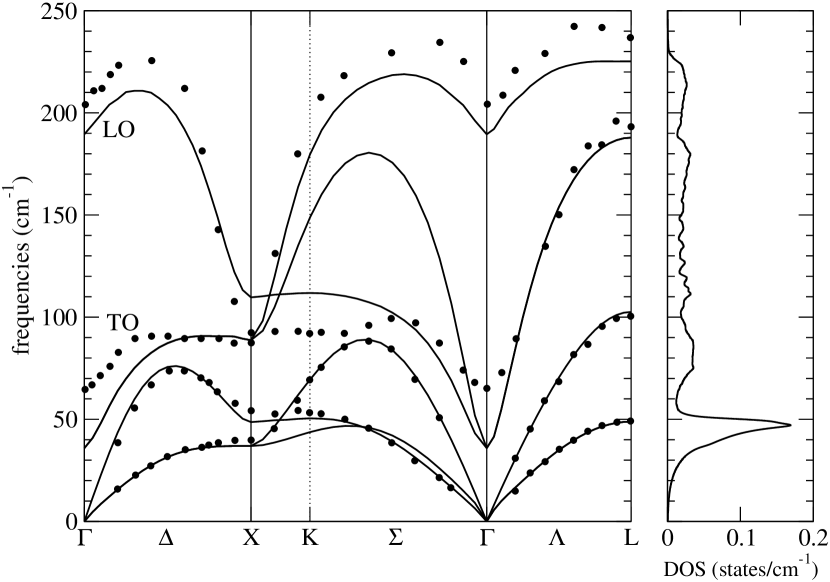
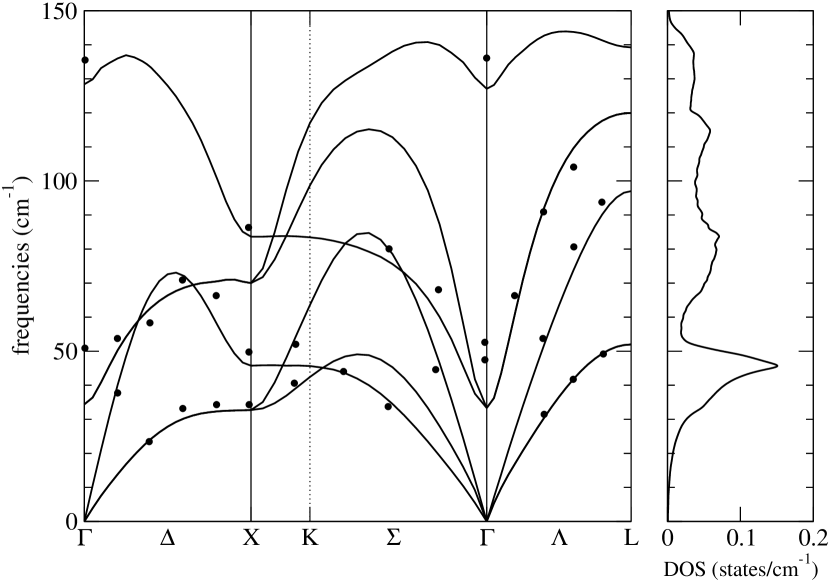
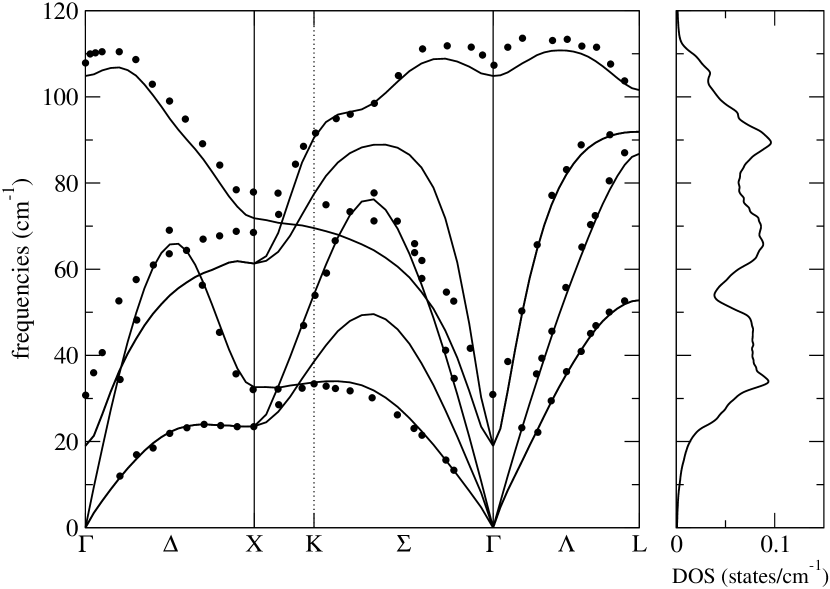
In Figs. 1,2, and 3, we present our calculated dispersion relations for PbS, PbSe, and PbTe, respectively, and compare with experimental data from inelastic neutron scattering. We also show the calculated phonon densities of states which will be needed for the calculation of the specific heat. In all three cases, we obtain excellent agreement between theory and experiment for the three acoustic modes. Since the mass of Pb atoms is much larger than the masses of S, Se, and Te, the acoustic branches correspond almost exclusively to vibrations of lead ions. Consequently, the acoustic mode dispersion is quantitatively very similar in the three lead chalcogenides. The main difference is a small frequency lowering that corresponds to increasing lattice constant in the series PbS, PbSe, PbTe. The three optical branches correspond to vibrations of the anions. Their maximum frequency scales as , where X denotes the anion species. For PbS, the optical modes are so high in energy that they do not intersect with the acoustic modes. For PbSe and PbTe some crossings occur.
In all three cases, we observe a remarkably large LO/TO splitting at . For cubic systems, the splitting is described by the relation baroni
| (2) |
where is the effective charge and is the dielectric constant. Since the effective charges are very large (, , and for PbS, PbSe, and PbTe, respectively), the LO/TO splitting is strongly pronounced and the TO mode at has a very low frequency. This frequency depends sensitively on the lattice constant. E.g., for PbSe, an artificial increase of the lattice constant by 0.1 Å leads to a softening of the TO mode frequency below 0, i.e., towards imaginary values which means that the fcc phase would no longer be the stable one. This is a clear manifestation of the near-ferroelectric character of the lead chalcogenides.
All three phonon dispersions exhibit a significant frequency drop of the LO mode at . Cowley and Dolling Cowley&Dolling proposed that this phenomenon is caused by the screening of the macroscopic electric field accompanying the LO mode by free carriers (which may have their origin by doping from impurities). We have done our calculations without the presence of additional free carriers, yet we have reproduced the LO anomaly. Free carrier doping can contribute to the LO dip but seems not to be its primary cause. Our calculations are in accordance with the theory of Maksimenko and Mischenko maksimenko who explained the LO anomaly as due to a strong electron-phonon interaction of pseudo-Jahn-Teller type (in absence of free carrier doping).
We explain this dip as a ”near Kohn anomaly”. The notion of a Kohn anomaly kohn is known from metallic systems: the vibrations of the ionic cores are partially screened by the surrounding electron gas. The screening can be strongly enhanced for vibrations with a wave-vector that connects two points on the Fermi surface. The enhanced screening then leads to a dip in the phonon dispersion at those values of . Recently, two Kohn anomalies were found in the semi-metal (or ”zero gap semiconductor”) graphene piscanec04 . The band structure in the first Brillouin zone of graphene displays two conical intersections (linear crossings) of the and bands at the Fermi level. The Fermi surface is thus reduced to two points and Kohn anomalies can be found at () and at K.
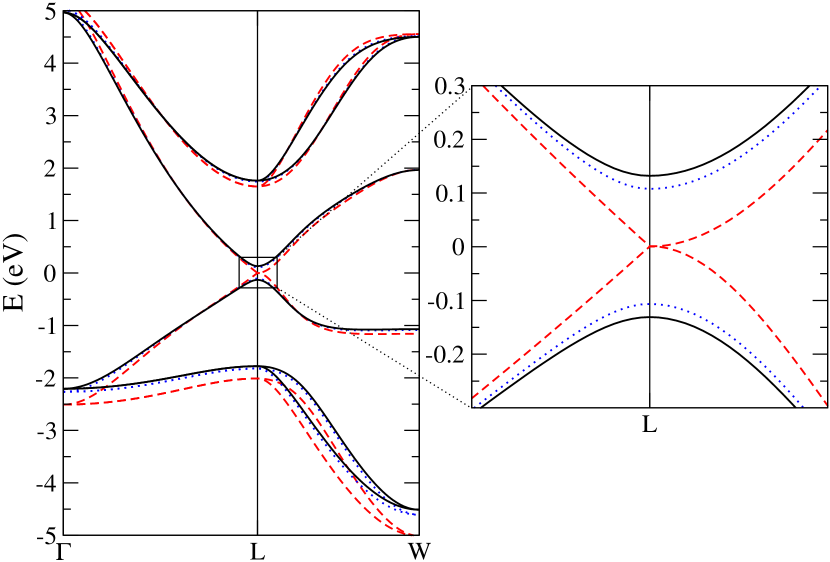
The lead chalcogenides are semiconductors. Thus there are - a priori - no Kohn anomalies in their phonon dispersions. However, the direct band-gap at the high-symmetry point L is small and, by compressing the lattice, it can be brought down to zero. The situation is demonstrated for the case of PbS in Fig. 4. We show the band-structure along the high-symmetry lines L W for three different values of the lattice constant. The highest valence band around L is composed of S 3 orbitals. The lowest conduction band has a Pb 6 character with an admixture of S 4 orbitals. When calculated with the experimental lattice constant at 300 K, the LDA-DFT band gap is 267 meV. It decreases to the value of 216 meV for the 30 K experimental lattice constant. Artificially decreasing the lattice constant further reduces the band-gap at L. Eventually, for a value of the lattice constant Å, the band gap becomes zero with a linear crossing of the bands in the direction L and a parabolic dispersion in the direction L W (see right panel of Fig. 4). This situation is now quite analog to the situation in graphene: the system is semimetallic and the Fermi surface is pointlike, located at the high symmetry points L. For the corresponding phonon dispersion relation one can expect a Kohn anomaly at and at X (the wave-vector difference between to different points L corresponds to either or X). We note in passing that a further reduction of the lattice constants re-opens the gap at L. However, the character of valence and conduction band is inverted and a real crossing of valence and conduction bands along the line L W shows up.
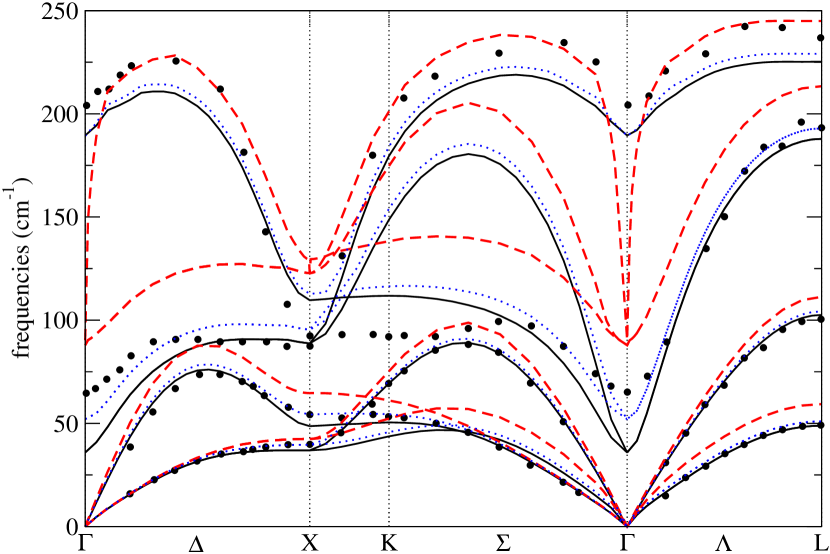
Fig. 5 presents the phonon dispersion relations of PbS for the three different values of the lattice constant. As expected, shrinking the lattice constant leads to a stiffening of the bonds and thus to an increase of the phonon frequencies. In particular, the TO mode is strongly affected because shrinking the lattice constant makes the system “less ferroelectric”. The only mode which softens is the highest optical branch at and at X where we observe to very sharp dips which correspond to the Kohn anomalies predicted above. Furthermore, LO and TO mode at are degenerate for the squeezed lattice: tends to infinity in the limit of the semi-metallic squeezed lattice and the LO/TO splitting tends to zero according to Eq. (2). Opening the electronic gap by enlarging the lattice constant to its original value reinstalls the LO/TO splitting. However, a remnant of the Kohn anomaly remains visible in the form of a strong dip of the LO mode at . For this reason, we interpret the LO dip as a ”near Kohn anomaly”.
| (calc.) | (exp.) | |
|---|---|---|
| PbS | 267 meV | 410 meV |
| PbSe | 244 meV | 280 meV |
| PbTe | 644 meV | 310 meV |
We note that the LO dip is considerably less pronounced in our calculated phonon dispersion of PbTe. This is due to the strong overestimation of the gap of this material gapnote (see table 2 for our values obtained on the DFT-LDA level and a comparison with the experimental values). At this point, we have to discuss if the inclusion of spin-orbit coupling (SOC) leads to an improvement of the phonon-calculations. It has been shown by Hummer et al. hummer that SOC strongly reduces the electronic gap for the three lead chalcogenides. E.g., for PbTe, the gap is reduced to 60 meV. The inclusion of electron-correlation effects, e.g., on the level of the GW-approximation, is needed in order to “re-open” the gap and to obtain values in good agreement with the experimental gaps hummer . For the calculation of the LO-dip this means that inclusion of SOC does not necessarily yield better results (unless electron-correlation effects are properly taken care of at the same time): the underestimation of the gap leads to an overestimation of the LO dip. Such an effect can be seen, e.g., in the PbTe phonon dispersion of Romero et al. (Fig. 3 of Ref. romero08, ).
We note that a recent ab-initio calculation of Cardona et al. cardona07 ; romero08 yielded considerably higher phonon frequencies for PbS than the experimental data. This is due to two reasons: they use the optimized lattice constant which underestimates the experimental lattice constant at 30K by 1.7% and the room temperature lattice constant by 2.2%. Furthermore, their use of a pseudo-potential with the lead 5d electrons in the core may lead to different phonon frequencies. Including SOC, leads to a general softening of the phonons and improves the agreement with experimental data romero08 (except for the LO dip at ). Our calculations with the experimental lattice constant at 300 K are in very good agreement with the acoustic branches of the experimental dispersions. Inclusion of SOC would probably lead to less agreement.
The optical phonons are in worse quantitative agreement with the experimental data points than the acoustic modes. In particular, for the TO mode around , strong deviations occur. This is not surprising, since our calculations take into account temperature effects only through the choice of the room temperature lattice constant while phonon renormalization through phonon-phonon interaction bonini is neglected within the harmonic approximation. Due to the near-ferroelectricity, the renormalization of the TO mode as a function of temperature will be particularly strong. E.g., the model calculation by Maksimenko and Mischenko maksimenko predicts for PbTe that the TO mode at room temperature stiffens by about 15 cm-1 with respect to its value at 4K.
IV Specific heat
Another test of the quality of our ab-initio phonon calculations is the comparison with available experimental data for the specific heat, , of PbS, PbSe, and PbTe parkinson ; bevolo ; cardona07 ; romero08 . The specific heat depends on the phonon densities of states, , (right panels of Figs. 1,2,3). We calculate it numerically through the formula
| (3) |
where is the Boltzmann constant and is the Avogadro constant. Note that is normalized to 6, i.e., the number of phonon branches.
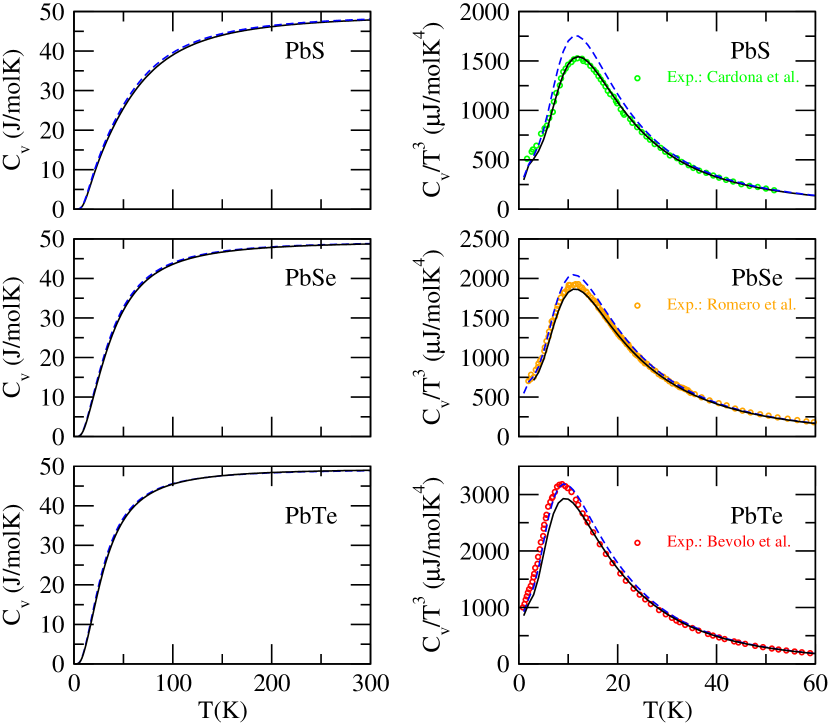
The resulting specific heat as a function of temperature is plotted in the left panels of Fig. 6. All three curves display the typical convergence towards the Petit and Dulong value for a material with two atoms in the primitive cell. Following the discussion of Cardona et al. in Refs. cardona07, ; romero08, , we also display in the low temperature regime (right panels of Fig. 6). All three curves display a maximum between 8 and 12 K.
The agreement between the experimental and theoretical height of the maximum of was used in Ref. cardona07, as a critical test for the quality of the ab-initio phonon calculations. They obtained a maximum height of the ab-initio curve at 1160 J/molK4 while the experimental height is at 1520 J/molK4. The deviation was tentatively assigned to the absence of SOC in the calculations. Recently, it was shown for elemental bismuth diaz and antimony serrano that inclusion of SOC in the phonon calculations leads to a lowering of the acoustic modes and thus to an increase of the maximum . Also for elemental lead, a lowering of the acoustic modes through the inclusion of s-o coupling has been observed verstraete .
Since our dispersion relations have been calculated with the room temperature lattice constants, we expect that we underestimate the frequencies of the acoustic phonons at very low temperature (where the lattice constant shrinks and the inter-atomic force constants stiffen). Consequently, our computed for PbS should overestimate the measured one. Fig. 6 (blue dashed line) shows that this is indeed the case: we obtain the maximum at 1750 J/molK4. For a better assessment of the specific heat at low temperature, we have repeated the calculation of the phonon dispersion and the DOS using the PbS lattice constant at 30K (see Table 1). The resulting (solid black line in Fig. 6) is in excellent agreement with the measured data. For PbSe, the agreement with experiment is also fairly good. However, in the case of PbTe, the specific heat calculated with the phonons at the low temperature lattice constant is somewhat lower than the experimental data. Consequently, spin-orbit coupling (which has a stronger effect in PbTe than in PbSe and PbS romero08 ) might be needed to yield good agreement with the experimental data. Further calculations of the phonon DOS including SOC effects (and the 5 electrons of Pb in the valence) are needed to resolve this issue.
V Conclusion
We have calculated the phonon dispersion relations for lead chalcogenides. Strict convergence parameters (concerning the lead pseudopotential and the k-point sampling) enabled us to obtain good agreement with experimental dispersion relations and measurements of the specific heat. The acoustic phonon modes are reproduced almost exactly. The pronounced dip of the LO mode at is related to the narrow band gap and can be understood as a near Kohn anomaly. This work provides the starting point for the investigation of electron-phonon coupling in nanocrystals of lead-chalcogenides.
Acknowledgments
We would like to thank C. Delerue, J. Serrano, M. Cardona, A. Romero, X. Gonze, and M. Verstraete for stimulating discussions. Funding was provided by the French National Research Agency through project ANR PJC05_6741. Calculations were done at the IDRIS supercomputing center, Orsay (Proj. No. 081827).
Appendix A Influence of the k-point sampling on the LO-mode frequency at
For most semiconductors, a 444 or 666 (shifted) Monkhorst-Pack k-point sampling Monkhorst&Pack of the electronic structure is sufficient to reproduce the phonon dispersion, including the LO/TO splitting at for polar materials. In this appendix, we show that for lead chalcogenides a much higher sampling is needed to properly reproduce the LO mode dispersion around .
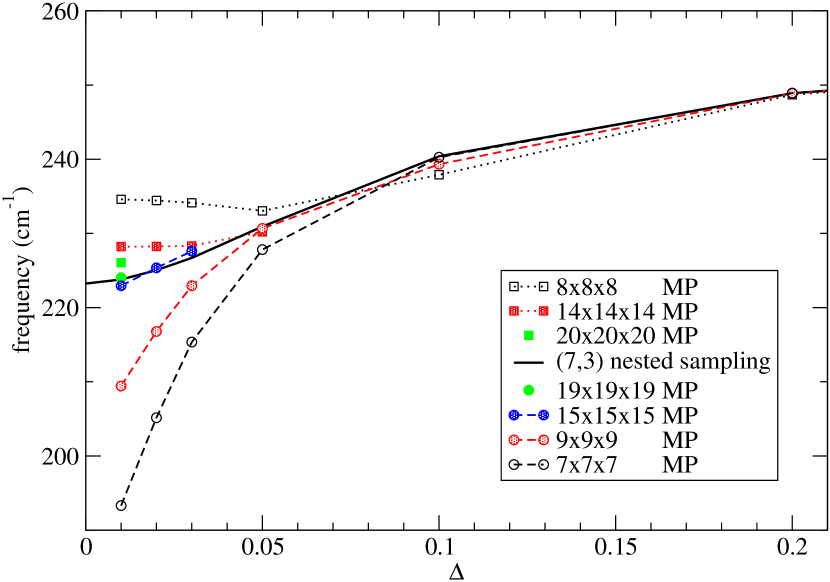
Fig. 7 shows the LO mode dispersion close to for different nnn Monkhorst-Pack samplings. We used here a Troullier-Martins pseudopotential with the 5d electrons in the core (from the ABINIT web-page). This allowed us to go to very high k-point samplings. The phonon frequencies marked by the symbols have been obtained by directly calculating the dynamical matrix for the corresponding phonon wave-vector (avoiding interpolation of the dynamical matrix). Obviously, it makes a big difference if is even or odd. For even, we obtain higher frequencies and for odd, we obtain lower frequencies than in the limit . The difference between the 777 and the 888 sampling amounts to more than 40 cm-1 for the LO mode at ! (For the TO mode - not shown here - the corresponding difference is less than 3 cm-1.) Even between the 191919 sampling and the 202020 sampling, there remains a difference of 2 cm-1 for the LO mode (while the TO mode is converged to within 0.03 cm-1).
The origin of the even-odd discrepancy for the different k-point samplings lies in the electronic structure of the lead chalcogenides which all have a very small direct gap at the high-symmetry point L. The small gap is (among other factors) responsible for the very high dielectric constants () of the lead chalcogenides. The point L is included in the samplings when n is odd, but not when n is even. We noticed that response-function calculations with odd samplings tend to strongly overestimate while the even samplings underestimate it. The link between the dielectric screening and the LO/TO splitting is given by Eq. 2. A variation of due to insufficient k-point sampling will strongly influence the LO mode frequency while the TO mode frequency may already be converged. Since occurs in the denominator, overestimation of in an odd sampling leads to underestimation of the LO mode frequency.
Since a calculation of the full dispersion relation with a very dense Monkhorst-Pack grid (and with the 5d electrons in the valence) was not feasible, we used a nested (7,3) grid. This is a 777 MP grid where, in addition, the cubic volume element around the point L is sampled by a simple 333 grid. The high k-point density around L corresponds thus to the density in a uniform 212121 grid and the solid line in Fig. 7 demonstrates that we obtain the LO frequency in very good agreement with the 202020 and 191919 samplings.
Due to the pronounced dip, the calculation of the dispersion relation from a Fourier-interpolated dynamical matrix is therefore not feasible for the LO mode around . This is the reason, why in our dispersion relations (Figs. 1,2,3), we used interpolation for most of the Brillouin zone but added point-by-point calculations for the LO mode close to .
References
- (1) Semiconductors: Group IV Elements, IV-IV and III-IV Compounds, Landolt-Börnstein, New Series, Group III, Vol. 41, Pt. A, edited by O. Madelung, U. Rössler, and M. Schulz (Springer-Verlag, Berlin, 2005).
- (2) F.W. Wise, Acc. Chem. Res. 33, 773 (2000).
- (3) Wehrenberg B.L., Wang C., Guyot-Sionnest P., J. Phys. Chem. B, 106 (2002).
- (4) G. Springholz, T. Schwarzl, W. Heiss, G. Bauer, M. Aigle, and H. Pascher, Appl. Phys. Lett. 79, 1225 (2001).
- (5) R.D. Schaller and V.I. Klimov, Phys. Rev. Lett. 92, 186601 (2004).
- (6) K. Hummer, A. Grüneis, and G. Kresse, Phys. Rev. B 75, 195211 (2007).
- (7) W. Cochran W., R.A. Cowley, G. Dolling, and M.M. Elcombe, Proc. Roy Soc. A 293, 433 (1966).
- (8) M.M. Elcombe, Proc. Roy Soc. A 300, 210 (1967).
- (9) P.R. Vijayraghavan, S.K. Sinha, and P.K. Iyengar, Proc. Nucl. Phys. Solid State Phys. (India) 16C, 208 (1973).
- (10) W. Jantsch, A. Bussmann-Holder, H. Bilz, and P. Vogl, Dynamical Properties of IV-VI Compounds, Springer Tracts in Modern Physics Vol. 99 (Springer, Berlin Heidelberg, 1983).
- (11) Cowley R.A., Dolling G., Phys. Rev. Lett. 14, 549 (1965).
- (12) K.S. Upadhyaya, M. Yadav, and G.K. Uphadhyaya, Phys. Stat. Sol. (b) 229, 1129 (2002).
- (13) O.B. Maksimenko and A.S. Mishchenko, J.Phys.: Condens. Matter 9, 5561 (1997).
- (14) G.A. Gehring and K.A. Gehring, Rep. Prog. Phys. 38, 1 (1975).
- (15) A.H. Romero, M. Cardona, R.K. Kremer, R. Lauck, G. Siegle, J. Serrano, and X.C. Gonze, Phys. Rev. B 78, 224302 (2008).
- (16) W. Kohn, Phys. Rev. Lett. 2, 393 (1959).
- (17) S. Piscanec, M. Lazzeri, F. Mauri, A.C. Ferrari, and J. Robertson, Phys. Rev. Lett. 93, 185503 (2004).
- (18) M. Cardona, R.K. Kremer, R. Lauck, G. Siegle, J. Serrano, and A.H. Romero, Phys. Rev. B 76, 075211 (2007).
- (19) S. Baroni, P. Giannozzi, and A. Testa, Phys. Rev. Lett. 58, 1861 (1987); X. Gonze, Phys. Rev. A 52, 1096 (1995).
- (20) S. Baroni, S. de Gironcoli, A. Dal Corso, and P. Giannozzi, Rev. Mod. Phys. 73, 515 (2001).
- (21) X. Gonze, J.-M. Beuken, R. Caracas, F. Detraux, M. Fuchs, G.-M. Rignanese, L. Sindic, M. Verstraete, G. Zérah, F. Jollet, M. Torrent, A. Roy, M. Mikami, Ph. Ghosez, J.-Y. Raty, D.C. Allan, Comp. Mat. Sci. 25, 478 (2002). The ABINIT code results from a common project of the Université Catholique de Louvain, Corning Incorporated, and other collaborators (http://www.abinit.org).
- (22) W. Kohn and L.J. Sham, Phys. Rev. 140, A1133 (1965).
- (23) M.J. Verstraete, M. Torrent, F. Jollet, G. Zérah, and X. Gonze, Phys. Rev. B 78, 045119 (2008).
- (24) M. Fuchs and M. Scheffler, Comput. Phys. Commun. 119, 67 (1999).
- (25) R. Resta, Modelling Simul. Mater. Sci. Eng. 11, R69 (2003).
- (26) N. Bonini, M. Lazzeri, N. Marzari, and F. Mauri, Phys. Rev. Lett. 99, 176802 (2007).
- (27) In Ref. hummer, , Table IV, a similar overestimation of the PbTe gap is observed, using the FP-APW+LO approach with the PBE functional.
- (28) D.H. Parkinson and J.E. Quarrington, Proc. Phys. Soc., London, Sect. A 67, 573 (1954).
- (29) A.J. Bevolo, H.R. Shanks, and D.E. Eckels, Phys. Rev. B 13, 3523 (1976).
- (30) L.E. Díaz-Sánchez, A.H. Romero, M. Cardona, R.K. Kremer, and X. Gonze, Phys. Rev. Lett. 99, 165504 (2007).
- (31) J. Serrano, R.K. Kremer, M. Cardona, G. Siegle, L.E. Díaz-Sánchez, and A.H. Romero, Phys. Rev. B 77, 054303 (2008).
- (32) H.J. Monkhorst and J.D. Pack, Phys. Rev. B 13, 5188 (1976).