The nature of compact groups of galaxies from cosmological simulations
Abstract
The nature of compact groups (CGs) of galaxies, apparently so dense that the galaxies often overlap, is still a subject of debate: Are CGs roughly as dense in 3D as they appear in projection? Or are they caused by chance alignments of galaxies along the line-of-sight, within larger virialized groups or even longer filamentary structures? The nature of CGs is re-appraised using the outputs of three galaxy formation models, applied to the dissipationless Millennium Simulation. The same selection criteria are applied to mock galaxy catalogs from these models as have been applied by Hickson and co-workers in redshift space. We find 20 times as many mock CGs as the ‘HCGs’ found by Hickson within a distance corresponding to . This very low (5%) HCG completeness is caused by Hickson missing groups that were either faint, near the surface brightness threshold, of small angular size, or with a dominant brightest galaxy. We find that most velocity-filtered CGs are physically dense, regardless of the precise threshold used in 3D group size and line-of-sight elongation, and of the galaxy formation model used. This result also holds for mock CGs with the same selection biases as was found for the HCGs.
IAP (CNRS & UPMC), Paris, FRANCE
IATE, Cordoba, ARGENTINA
1. Introduction: the compact group debate
Among the different galaxy environments, compact groups of galaxies (hereafter CGs) potentially represent the densest one involving 4 or more galaxies on small scales, denser than the cores of rich clusters of galaxies. In particular, the catalog of 100 CGs (hereafter, HCGs) compiled by Hickson (1982) has generated a strong interest because of its well defined selection criteria: 1) membership: at least 4 galaxies within 3 magnitudes from the brightest one, 2) compactness: mean surface brightness (averaged over the smallest circumscribed circle containing the galaxy centers, hereafter scc) above a threshold; and 3) isolation: no galaxies within 3 magnitudes from the brightest within the annulus centered on the scc, spanning one to three scc radii. The isolation criterion effectively rejects clusters of galaxies and makes the HCGs an environment of its own.
The fundamental question is: are HCGs as dense in 3D as they appear in projection (e.g. Hickson & Rood 1988) or are they caused by chance alignments of galaxies along the line-of-sight, within larger groups (Mamon 1986; Walke & Mamon 1989) or within longer filamentary structures (Hernquist et al. 1995)? With mean densities over times the critical density of the Universe (virialized structures are typically 100 times the critical density), the crossing times are less than 1 Gyr, and the HCGs ought to be the ideal environment for galaxy mergers (Mamon 1992). In the updated HCG catalog with galaxy redshifts to remove obvious interlopers (Hickson et al. 1992), there remained 69 HCGs with at least four galaxies within from the group median.
Still, the identification of CGs in redshift space does not imply that these structures are dense in real space. We attempt to respond to this question using state-of-the-art galaxy formation codes (see details in Díaz-Giménez et al. 2008).
2. Method
We build mock CGs in redshift space by 1) starting with the Millennium dark matter simulation (Springel et al. 2005), 2) building galaxy catalogs using three different semi-analytical galaxy formation models (SAMs), by Bower et al. (2006), Croton et al. (2006), and De Lucia & Blaizot (2007), 3) extracting the mock CGs using the HCG criteria (Hickson 1982, see § 1) and 4) applying the velocity filter (see § 1) of Hickson et al. (1992). This yields between 3000 and 7000 mock CGs, depending on the SAM. We use a bright galaxy magnitude limit of , which corresponds to , so our faint galaxy magnitude limit is , equal to that of the primary SDSS spectroscopic sample. 51 HCGs then fully satisfy the HCG selection criteria with at least 4 velocity concordant galaxies (we rejected 5 non-isolated HCGs noticed by Sulentic 1997).
3. Completeness
In Figure 1, we show the distribution of observed quantities for both the observed HCGs and the mock CGs.
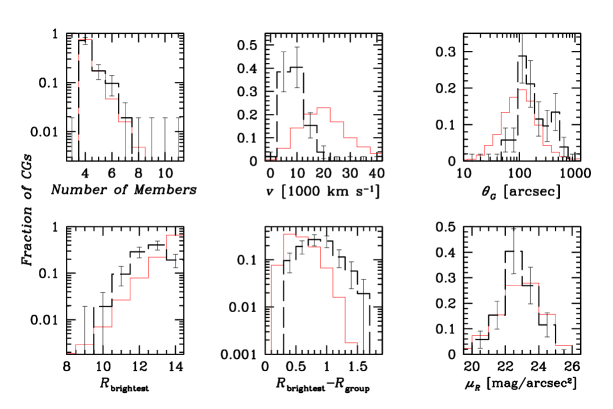
One can see that the observed HCGs are progressively more incomplete at fainter surface magnitudes (Walke & Mamon 1989), at larger distances, and for groups with dominant galaxies (see Prandoni et al. 1994), but also for groups of small angular size. At a distance of , the mean space density of mock CGs is 20 times that of observed HCGs, hence the HCG sample at that distance is only 5% complete (and less so at greater distances).
4. Nature
Even with 3-dimensional information, it is not straightforward to decide which mock CGs are physically dense and which might be caused by chance projections. For example, one cannot simply separate the mock CGs according to their binding energy, because the mock CGs are defined with galaxies, while the intergalactic matter makes up much of the binding energy. Even if one corrects for this, we have too few galaxies per group for good measures of binding energy at CG masses below .
We use two other statistics to separate dense groups from chance alignments: the length of the group in 3D (maximum galaxy separation, ) and the line-of-sight (l.o.s.) elongation of the group, defined as , where is the length of the group along the l.o.s., while is the maximum projected separation. Both statistics are computed on the smallest quartet within the group of 5 or more galaxies (or the group itself if there are only four members).

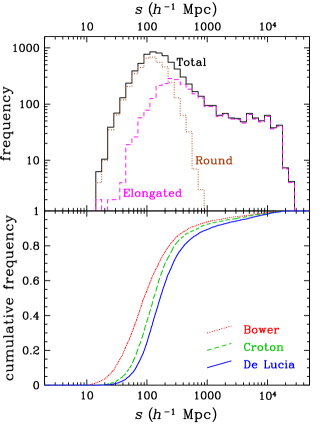
Figure 2 shows these measures of group size and l.o.s. elongation. Still, it is not clear where to make cuts in, say, vs . We consider conservative criteria for physically dense groups: short (), round (), or combinations of both.
| galaxy formation model | |||
|---|---|---|---|
| Criterion | Bower+06 | Croton+06 | De Lucia+07 |
| 0.77 | 0.70 | 0.59 | |
| 0.70 | 0.67 | 0.59 | |
| 0.71 | 0.63 | 0.52 | |
Table 1 indicates that regardless the criterion and the SAM used, most of the mock CGs are physically dense. Similar fractions are returned using samples of mock CGs built with the same selection biases as the HCGs.
5. Discussion
A similar work has been performed by McConnachie et al. (2008), who defined physically dense groups as those that are found with a Friends-of-Friends linking length of . McConnachie et al. find that 35% of their mock compact groups (before velocity filtering) are physically dense, while we typically find 20% with the De Lucia & Blaizot model used by them.
Acknowledgments.
We acknowledge the Millennium Simulation, and public galaxy formation outputs by Bower et al., Croton et al. and De Lucia & Blaizot, on top of it. G.A.M. thanks the Dept. of Physics at the Univ. of Oxford for hospitality while part of this research was performed.
References
- (1)
- Bower et al. (2006) Bower R. G., Benson A. J., Malbon R., et al. 2006, MNRAS, 370, 645
- Croton et al. (2006) Croton D. J., Springel V., White S. D. M., et al. 2006, MNRAS, 365, 11
- De Lucia & Blaizot (2007) De Lucia G., Blaizot J., 2007, MNRAS, 375, 2
- Díaz-Giménez et al. (2008) Díaz-Giménez E., Ragone-Figueroa C., Muriel H., Mamon G. A., 2008, MNRAS, submitted, arXiv: 0809.3483
- Hernquist et al. (1995) Hernquist L., Katz N., Weinberg D. H., 1995, ApJ, 442, 57
- Hickson (1982) Hickson P., 1982, ApJ, 255, 382
- Hickson et al. (1992) Hickson P., Mendes de Oliveira C., Huchra J. P., Palumbo G. G., 1992, ApJ, 399, 353
- Hickson & Rood (1988) Hickson P., Rood H. J., 1988, ApJ, 331, L69
- Mamon (1986) Mamon G. A., 1986, ApJ, 307, 426
- Mamon (1992) —, 1992, ApJ, 401, L3
- McConnachie et al. (2008) McConnachie A. W., Ellison S. L., Patton D. R., 2008, MNRAS, 387, 1281
- Prandoni et al. (1994) Prandoni I., Iovino A., MacGillivray H. T., 1994, AJ, 107, 1235
- Springel et al. (2005) Springel V., White S. D. M., Jenkins A., et al. 2005, Nat, 435, 629
- Sulentic (1997) Sulentic J. W., 1997, ApJ, 482, 640
- Walke & Mamon (1989) Walke D. G., Mamon G. A., 1989, A&A, 225, 291