The nature of ionized gas in early-type galaxies
Abstract
We present a study of the ionized gas in a sample of 65 nearby early-type galaxies, for which we have acquired optical intermediate-resolution spectra. Emission lines are detected in 89% of the sample. The incidence of emission appears independent from the E or S0 morphological classes. According to classical diagnostic diagrams, the majority of the galaxies are LINERs. However, the galaxies tend to move toward the “Composites” region (at lower [NII]6584/H values) as the emission lines are measured at larger galacto-centric distances. This suggests that different ionization mechanisms may be at work in LINERs.
1. Introduction
Early-type galaxies (ETGs) have long been considered to be inert stellar systems, essentially devoid of gas and dust. However, this view has radically changed since a number of imaging and spectroscopy studies from both the ground and space have revealed the presence of a multiphase interstellar medium (ISM): a hot ( K), X-ray emitting halo (e.g., Fabbiano et al. 1992); a warm ( K) component (often referred to as “ionized gas”) (e.g., Phillips et al. 1986); and even cooler components detected in the MIR (Bressan et al. 2006) and in HI and CO (e.g., Sadler et al. 2002). Ionized gas is detected in 40-80 % of early-type galaxies via its optical emission lines (e.g., Sarzi et al. 2006; Yan et al. 2006; Serra et al. 2008).
Despite the number of studies, several issues remain still open. The first question is the origin of the ISM in ETGs. Evidence for external acquisition comes from narrow-band imaging studies, often showing gas/star misalignment (e.g., Buson et al. 1993), and from kinematical studies, often showing gas/star angular momentum decoupling (e.g., Caon et al. 2000).
The second still open issue concerns the ionizing source of the warm gas. Optical spectroscopic studies show that ETGs are typically classified as Low-Ionization Emission-line Regions (LINERs) according to their emission line ratios (e.g., Phillips et al. 1986). However, there is still strong debate about the ionization mechanism in LINERs. Actually, the most viable excitation mechanisms are: low accretion-rate AGN (e.g., Kewley et al. 2006), photoionization by old post-asymptotic giant branch (post-AGB) stars (e.g., Binette et al. 1994), fast shocks (e.g., Dopita & Sutherland 1995).
2. The Sample
With the aim of understanding the nature of ionized gas in ETGs, we acquired intermediate-resolution (FWHM 7.6 Å at 5550 Å) optical spectra (3700 - 7250 Å) for a sample of 65 nearby E/S0 galaxies. For a detailed description of the sample we refer to Rampazzo et al. (2005) (Paper I) and Annibali et al. (2006) (Paper II). For the derivation of ages, metallicities, and [/Fe] ratios, we refer to Annibali et al. (2007) (Paper III). Here we recall that the sample was selected from a compilation of galaxies showing ISM traces in at least one of the following bands: IRAS 100 m, X-ray, radio, HI and CO (Roberts et al. 1991). Because of the selection criteria, the sample is biased toward the presence of emission lines. The galaxies are mainly located in low density environments. In the present study, we will use the spectra extracted in 4 annuli of increasing galacto-centric distance (0 r re/16, re/16 r re/8, re/8 r re/4, and re/4 r re/2).
3. Emission lines
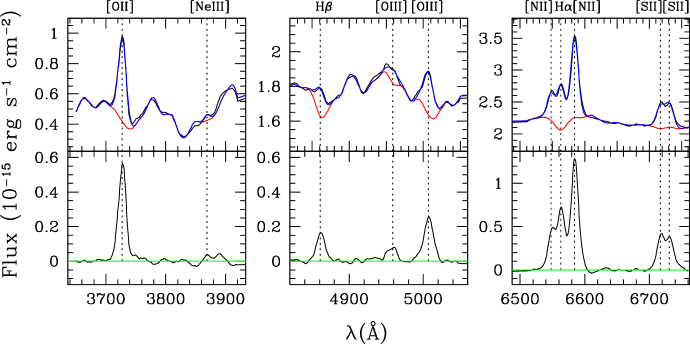
The emission line fluxes were measured on residual spectra obtained by subtracting the stellar population contribution to the observed galaxy spectra. To this purpose, we used new SSPs (Bressan, unpublished; Chavez et al. (2009)). The SSPs were computed from the isochrones of Bertelli et al. (1994), with the revision of Bressan et al. (1998) including a new AGB mass-loss treatment. In the optical domain, the SSPs are based on the MILES spectral library (Sánchez-Blázquez et al. 2006). The galaxy continua were fitted with the new SSPs, smoothed to match the instrumental resolution and the galaxy velocity dispersion, through a criterion. In the fit, we considered selected spectral regions chosen to include both features particularly sensitive to age (the relative strength of the Ca II H + K lines, the 4000 Å break, the H and H lines), and features more sensitive to metallicity (the Fe lines at 4383, 4531, 5270, 5335, and the Mg absorption features around 5175). The residual spectrum around each line was derived by normalizing the SSP in two continuum bands adjacent to the line of interest. The line fluxes were determined by fitting the residual spectrum with Gaussian curves of variable width and intensity. As an example, we show the stellar continuum subtraction and the line fit for IC 1459 in Fig. 1. The emission lines were corrected for extinction through the observed flux ratio, assuming an intrinsic value of 3.1 valid for AGN-like objects (Osterbrock 1989). Some galaxies in the sample present very large reddening, up to or even more. Since the observed continuum is incompatible with such large values, the dust must be patchy.
Emission lines are detected in 58 out of 65 galaxies ( 89 % of the sample). The incidence of emission appears independent from the E and S0 morphological classes. The nebular emission is stronger in the galaxy center, and decreases moving toward the more external annuli.
4. Diagnostic Diagrams
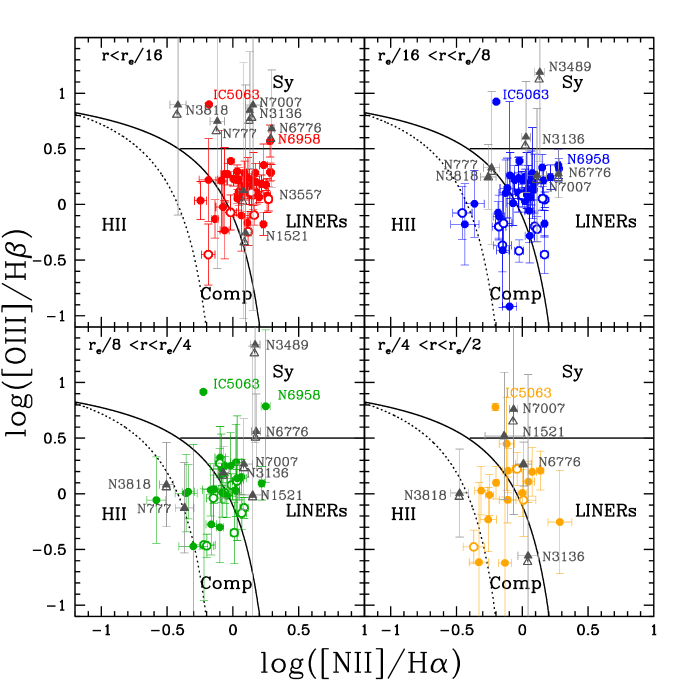
Galaxies were classified through the standard [OIII]5007/ H versus [NII]6583/ H diagnostic diagram, first proposed by Baldwin et al. (1981) (hereafter BPT). The BPT diagram for our galaxy sample, in the 4 annuli, is shown in Fig. 2. The majority of galaxies are classified as LINERs. Only IC 5063 is classified as a bona fide Seyfert galaxy. A few galaxies, namely NGC 3489, NGC 3818, NGC 3136, NGC 6776, NGC 7007, NGC 777, and NGC 6958, fall in the Seyfert region, but are consistent with a LINER classification within the errors. Some galaxies (NGC 3258, NGC 4552, NGC 5193, NGC 5328, NGC 6721, NGC 6876, IC 2006) fall in the “Composites” region (see Fig. 2), and possibly contain a combined contribution from both star formation and AGN. We notice that, from the center outwards, the bulk of the galaxies move left-down in the BPT diagram. An increasing number of galaxies pass from LINERs to “Composite” objects as the emission lines are measured at larger galacto-centric distances. This suggests that different ionization mechanisms may be at work in LINERs.
References
- Annibali et al. (2007) Annibali, F., et al. . 2007, A&A, 463, 455, (Paper III)
- Annibali et al. (2006) Annibali, F., Bressan, A., Rampazzo, R., & Zeilinger, W. W. 2006, A&A, 445, 79, (Paper II)
- Baldwin et al. (1981) Baldwin, J. A., Phillips, M. M., & Terlevich, R. 1981, PASP, 93, 5
- Bertelli et al. (1994) Bertelli, G., Bressan, A., Chiosi, C., Fagotto, F., & Nasi, E. 1994, A&AS, 106, 275
- e.g., Binette et al. (1994) Binette, L., Magris, C. G., Stasińska, G., & Bruzual, A. G. 1994, A&A, 292, 13
- Bressan et al. (1998) Bressan, A., Granato, G. L., & Silva, L. 1998, A&A, 332, 135
- Bressan et al. (2006) Bressan, A., et al. 2006, ApJ, 639, L55
- e.g., Buson et al. (1993) Buson, L. M., et al. 1993, A&A, 280, 409
- e.g., Caon et al. (2000) Caon, N., Macchetto, D., & Pastoriza, M. 2000, ApJS, 127, 39
- Chavez et al. (2009) Chavez, M., Bertone, E., Morales-Hernandez, J., & Bressan, A. 2009, ApJ, 700, 694
- e.g., Dopita & Sutherland (1995) Dopita, M. A., & Sutherland, R. S. 1995, ApJ, 455, 468
- e.g., Fabbiano et al. (1992) Fabbiano, G., Kim, D.-W., & Trinchieri, G. 1992, ApJS, 80, 531
- Kewley et al. (2001) Kewley, L. J., et al. 2001, ApJ, 556, 121
- e.g., Kewley et al. (2006) Kewley, L. J., Groves, B., Kauffmann, G., & Heckman, T. 2006, MNRAS, 372, 961
- Osterbrock (1989) Osterbrock, D. E. 1989, S&T, 78, 491
- e.g., Phillips et al. (1986) Phillips, M. M., et al. 1986, AJ, 91, 1062
- Rampazzo et al. (2005) Rampazzo, R., et al. 2005, A&A, 433, 497, (Paper I)
- Roberts et al. (1991) Roberts, M. S., et al. 1991, ApJS, 75, 751
- e.g., Sadler et al. (2002) Sadler, E. M., Oosterloo, T., & Morganti, R. 2002, ASPC, p.215
- Sánchez-Blázquez et al. (2006) Sánchez-Blázquez, P., et al. 2006, MNRAS, 371, 703
- e.g., Sarzi et al. (2006) Sarzi, M., et al. 2006, MNRAS, 366, 1151
- Serra et al. (2008) Serra, P., Trager, S. C., Oosterloo, T. A., & Morganti, R. 2008, A&A, 483, 57
- Yan et al. (2006) Yan, R., et al. . 2006, ApJ, 648, 281