TRIGONOMETRIC PARALLAXES OF MASSIVE STAR-FORMING REGIONS. VII. G9.62+0.20 AND THE EXPANDING 3 KPC-ARM
Abstract
We report a trigonometric parallax of 12 GHz methanol masers associated with the massive star forming region G9.62+0.20 (catalog ), corresponding to a distance of kpc. With a local standard of rest velocity of about 2 km s-1, the region’s kinematic distances of 0.5 and 16 kpc differ greatly from the distance derived here. Our measurement of the peculiar motion of the star forming region shows a very large deviation from a circular Galactic orbit: 41 km s-1 radially outward from the Galactic center and 60 km s-1 counter to Galactic rotation. The combination of its radial velocity and distance places G9.62+0.20 (catalog ) in the inner region of the Galaxy close to the Expanding Near 3 kpc-Arm, where the bulge/bar potential has strong gravitational influence. We also map the distribution of 12 GHz methanol masers, locate them with respect to a hypercompact H II region, and compare our data with the periodic flare phenomenon reported previously for this source.
1 Introduction
G9.62+0.20 (catalog ) is a massive star-forming complex harboring a number of H II regions in different evolutionary phases (e.g. Garay et al. 1993; Hofner et al. 1996; Testi et al. 2000; Hofner et al. 2001; De Buizer et al. 2003). Several masing species are associated with component G9.62+0.20 (catalog ) E, which has been classified as a candidate hypercompact (HC) H II region (Kurtz & Franco, 2002). Both 6.7 and 12.2 GHz methanol masers have been detected toward this object (Phillips et al. 1998; Caswell et al. 1995), as well as 22.2 GHz water (Hofner & Churchwell, 1996) and 1.665 and 1.667 GHz hydroxyl (Caswell, 1998) masers. Furthermore G9.62+0.20 (catalog ) has been claimed to be the most luminous 6.7 GHz methanol maser known in the Galaxy and both its 6.7 and 12.2 GHz methanol emissions show periodic flaring (Goedhart et al. 2003, 2005).
G9.62+0.20 (catalog ) is in the first Galactic quadrant, projected 9.6 degrees from the Galactic center. While its Local Standard of Rest (LSR) velocity is near zero, 21-cm wavelength H I spectra toward its H II region(s) show clouds of absorbing gas with LSR velocities out to 55 km s-1(Hofner et al., 1994). This effectively rules out the near kinematic distance of 0.5 kpc 111We adopt a “revised” kinematic distance using the prescription of Reid et al. (2009b), assuming G9.62+0.20 (catalog ) has an LSR velocity of +2.0 km s-1.. The apparent cutoff in H I absorption above 55 km s-1 suggests that the source is not at the far distance either (16 kpc), but rather lies deep in the inner Galaxy on the near side of the tangent point. However, this argument may partly be affected by the decrease of cold and dense H I inside the Galactic gas hole (Galactocentric radius kpc), since this gas component is the one responsible for well-defined H I absorption lines.
In order to determine the true distance and reliably locate G9.62+0.20 (catalog ) in the Galaxy, we conducted multi-epoch, phase referencing, VLBA observations of its 12 GHz methanol masers. In this paper, we report a measurement of trigonometric parallax based on our spectral line interferometric observations. In addition to the parallax, we accurately determine the proper motion of the masers with respect to background quasars. Combining the coordinates, distance, LSR velocity and proper motions yields the full 3-dimensional location and kinematics of the massive star-forming region. This complete information clearly associates G9.62+0.20 (catalog ) with the complex inner region of the Galaxy where the central bar has strong gravitational influence.
2 Observations and Data Analysis
Using the NRAO222The National Radio Astronomy Observatory is a facility of the National Science Foundation operated under cooperative agreement by Associated Universities, Inc. Very Long Baseline Array (VLBA), we observed the high-mass star forming region (HMSFR) G9.62+0.20 (catalog ) in the E CH3OH transition (rest frequency 12178.597 GHz). Background information about our VLBA program to measure parallaxes for HMSFRs is given in Reid et al. (2009a), hereafter called Paper I. We observed under program BR100A at 5 epochs: 2005 March 25 and October 8, 2006 March 16 and October 4, 2007 March 16. These dates were chosen to sample the peaks of the parallax signature in Right Ascension, since the amplitude of the Declination parallax signature is small and those position measurements are more susceptible to systematic errors at the low Declination of this source.
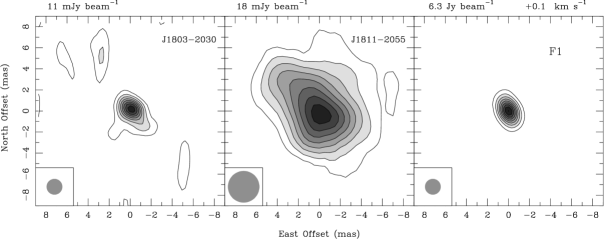
Paper I describes the general observational strategy and data calibration procedures. The maser observations were centered at the systemic velocity (VLSR) of +2.0 km s-1, also traced with the CH3CN line emission by Hofner et al. (1996). Spectral resolution was 0.38 km s-1. Two fringe finders, J1743–0350 and J1800+3848 from the ICRF catalog, were observed for single-band delay and instrumental phase-offset calibration. For background position references, we observed 4 calibrators, J1803–2030, J1804–2147, J1808–2124 and J1811–2055, from the extragalactic radio survey by Xu et al. (2006). Only the first and last calibrators were detected with our VLBA measurements (see Table 1 and Figure 1). We selected the LSR velocity channel at +0.1 km s-1 as the phase reference, corresponding to the peak intensity of the bright and compact maser spot F1, following the labeling of Minier et al. (2002) (see Figure 1 and 3). Table 1 summarizes source properties.
The absolute positions of the two background sources were not known with sufficient accuracy to be used to determine the absolute position of the maser emission. However, the a priori position of the maser reference spot (F1) was correct to about 20 mas, as indicated by the low fringe rates of the interferometer phases. After calibration, we imaged the phase reference maser channel and continuum sources using the AIPS task IMAGR with a circular restoring beam of at each epoch, equal to the east-west naturally weighted dirty beam size, which was typically at a P.A. of east of north, since the parallax information comes essentially from the east-west position shifts. The intensity peak of the phase reference spot varied by less than % across our observations spanning 2 yr (see Figure 4).
Figure 1 shows the images of the background sources, J1803–2030 and J1811–2055, and the phase reference maser spot from the middle epoch. For J1803–2030 the small deviations from a pointlike image are most likely caused by unmodeled short-term atmospheric fluctuations and follow the dirty beam shape (cf. Brunthaler et al. 2009). The calibrator J1811–2055 turned out to have an elongated-structure, with a possible extended halo. When imaging this source, we used a larger circular restoring beam of . This beam size was set to maximize the brightness sensitivity in the image. For parallax purposes, we fitted only the peak of the emission. At the first epoch (2005 March 25) only 4 (BR, FD, NL, OV) VLBA antennas were usable and the dynamic range of the images was about 7 times worse than for the subsequent 4 epochs. This precluded the use of the extended source J1811–2055 at this epoch. We measured the positions of the maser and the background sources by fitting elliptical Gaussian brightness distributions to the detected emission (AIPS task JMFIT).
3 Results
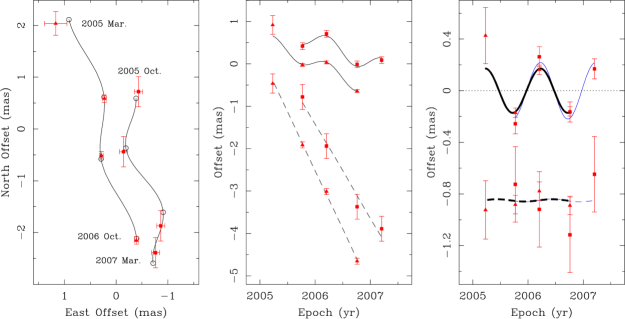
We measured the parallax and the proper motion of 12 GHz methanol masers by modeling the position differences between the reference maser spot and each calibrator versus time. The model is the sum of the parallax sinusoid, including the effects of the ellipticity of the Earth’s orbit, and a linear motion in each coordinate. Since systematic errors usually dominate over random noise, we adopted an “a posteriori” estimate of the errors from the fit itself. We assigned independent “error floors” to the east and north position offsets and added them in quadrature to the formal position fitting uncertainties. This procedure was iterated, adjusting error floors to achieve a reduced per degree of freedom near unity in each coordinate (see Paper I for a detailed discussion). We down-weighted the data from the first epoch (2005 March 25) by a factor 7, equal to the dynamic range degradation of the background source images. We can also put an upper limit on the shift over time of the centroid position of the quasars due to a possible jet component evolution. The small residuals for the parallax fits relative to the two quasars, and the similar parallax results, suggest that such effects are less than about 50 as.
Table 2 and Figure 2 show the results of the parallax and proper motion fit for each background source. While the post-fit residuals for the fit using J1803–2030 were about half that of the fit using J1811–2055, the J1803–2030 fit is dominated by data from only three epochs. As such, there are effectively near-zero degrees of freedom and the formal errors are not reliable. Since we could not reliably determine the relative weights for the two parallax data sets, we calculated an un-weighted average, instead of the combined fit procedure applied in previous papers (e.g. Paper I). The measured parallax of G9.62+0.20 (catalog ) obtained in this manner is mas, corresponding to a distance of kpc.
Our new distance indicates that the luminosity of the brightest 6.7 GHz methanol maser observed in the Galaxy has been substantially underestimated in the past. The near kinematic distance (2.0 kpc) adopted by Phillips et al. (1998) is only 38% of our measured distance implying a 7 times brighter source. This kinematic distance was derived by Forster & Caswell (1989) based on OH masers velocities, assuming the Schmidt (1965) Galactic rotation model and a Sun–Galactic center distance (R0) of 10 kpc. Adopting the IAU value of the distance to the Galactic center, R kpc, our measured distance translates to a Galactocentric radius of 3.5 kpc. The measured mean proper motion is mas yr-1 toward the east and mas yr-1 toward the north; at our measured distance these values correspond to km s-1and km s-1 eastward and northward, respectively. Completing the kinematic information, we assume a LSR velocity of km s-1 for the maser complex.
We compare our measurements with a simple rotation model of the Galaxy, converting these values from the equatorial heliocentric reference frame to a rotating Galactic reference frame. This approach subtracts a circular velocity component at the position of the source and yields a peculiar motion vector with respect to circular rotation (Reid et al., 2009b). Assuming negligible internal motions of CH3OH masers (e.g. Moscadelli et al. 2002, 2009) and adopting the IAU value for the distance to the Galactic center (R kpc), the rotation velocity at the solar circle ( km s-1), and the Hipparcos measurements of the solar motion (Dehnen & Binney, 1998), the peculiar velocity components of G9.62+0.20 (catalog ) are km s-1, where Us, Vs and Ws are directed toward the Galactic center, in the direction of Galactic rotation and toward the North Galactic Pole, respectively. Using instead the best-fit values of R kpc and km s-1, obtained from 16 parallax and proper motion measurements (Reid et al., 2009b), the peculiar velocity components are km s-1. Quoted uncertainties are based on proper motion and measurement errors and also a 7 km s-1 uncertainty in each peculiar velocity component, owing to expected Virial motions of a star within a high mass star forming region.
4 Galactic Location and Peculiar Motion
In the literature there are two estimates of distance to the source G9.62+0.20 (catalog ) consistent with our direct measurement. Scoville et al. (1987) derived a distance of 4.7 kpc for the H II complex G9.62+0.20 (catalog ), based on the association to a CO cloud with a LSR velocity of +4 km s-1 and following the expanding ring model of the 3 kpc-Arm given by Bania (1980). Hofner et al. (1994) showed that there is HI absorption over the LSR velocity range of -5 to 55 km s-1 and suggested a kinematic distance of 5.7 kpc. Our trigonometric parallax places G9.62+0.20 (catalog ) at a distance close to 5.2 kpc. The combination of distance and Galactic coordinates locates G9.62+0.20 (catalog ) in the inner region of the Galaxy within the so-called “molecular ring”, which appears as a complex structure in CO longitude-velocity maps (e.g. Dame et al. 2001; Rodriguez-Fernandez & Combes 2008). Based on the observations of distinct tangents points, traced by the early CO surveys in the southern Milky Way (e.g. Robinson et al. 1984; Bronfman et al. 1989), the inner edge of the molecular ring is thought to be composed of the Norma and Expanding 3 kpc arms (e.g. Figure 5 in Bronfman et al. 2000; Figure 3 in Dame et al. 2001). Due to observational difficulties detecting and following the Norma Arm in CO emission at positive longitudes, the question to which arm, if any, does the Norma Arm connect in the first quadrant is still controversial (e.g. Russeil 2003; Vallée 2008). Therefore in the following, we focus our comparison of the spatial and velocity properties of G9.62+0.20 (catalog ) with the well-studied Expanding 3 kpc-Arm.
Since the LSR velocity for a nearly circular Galactic orbit at the longitude and distance of G9.62+0.20 (catalog ) would be km s-1, about 50 km s-1 greater than observed, G9.62+0.20 (catalog ) is clearly highly kinematically anomalous. We can gain a more complete picture of the region by comparing the Galactic location (,b) and the LSR velocity (+2 km s-1) of G9.62+0.20 (catalog ) with respect to the distribution of CO toward this region. Using the longitude-velocity and latitude-velocity CO line maps of Bitran et al. (1997), we find the HMSFR G9.62+0.20 (catalog ) associated with the edge of a CO clump (cutoff at 0.5 K). Dame & Thaddeus (2008) locate the Expanding (Near) 3 kpc-Arm (hereafter simply the 3 kpc-Arm) below the plane of the Milky Way at Galactic longitude , whereas G9.62+0.20 (catalog ) is slightly above the plane. The LSR velocity of the 3 kpc-Arm in this direction is expected to be km s-1, blueshifted by about km s-1 with respect to a circular orbit at km s-1. We find G9.62+0.20 (catalog ) to have a km s-1, which, while close to the CO velocity at this longitude, is shifted by about 15 km s-1 with respect to CO in the 3 kpc-Arm. Thus, G9.62+0.20 (catalog ) may not be part of the 3 kpc-Arm as previously proposed and, perhaps, could belong to a nearby structure such as the Norma Arm. Either way, this source, and presumably its associated arm, has a large peculiar motion with a km s-1 component radially outward and a km s-1 component counter to Galactic rotation, rendering kinematic distances useless.
The spatial and velocity properties of the HMSFR G9.62+0.20 (catalog ) and the 3 kpc-Arm, although not strictly associated, suggest they could participate in a similar dynamical anomaly. The large peculiar motion of the 3 kpc-Arm might be induced by the gravitational influence of a central bar(s) potential, as explored by many authors. Habing et al. (2006) studied the distribution of maser stars in the inner Milky Way with respect to the ISM distribution and compared their spatial properties with a set of orbits derived by combining an axisymmetric potential plus a weak rotating bar. They found an overall agreement between maser stars and gas in both space and velocity, moving inward along the Galactic plane with almost circular orbits that become more and more elongated inside the molecular ring with radial motion increasingly important. Following Sevenster (1999), they suggested the 3 kpc-Arm to be the locus of ballistic orbits originating at the corotation radius of the bar. On the contrary, Rodriguez-Fernandez & Combes (2008) modeling the dynamics of the Milky Way gas flow in the presence of a potential from two nested bars, suggested by the Two Micron All Sky Survey (2MASS) data, reproduced the longitude-velocity features of the 3 kpc-Arm as a spiral density wave maximum surrounding the primary bar. Further parallax and 3-D velocity measurements of HMSFRs sampling the inner region of the Galaxy will help to constraint the dynamics of this complex region.
As a final remark, we note that two supernova remnants (SNRs), G9.8+0.6 and G9.7-0.0, are projected to within a half degree of G9.62+0.20 (catalog ). G9.8+0.6 has distance estimates of 8.8 kpc (Stupar et al., 2007) and 10.4 kpc (Case & Bhattacharya, 1998), both based on the -D relation, which may not be reliable (e.g. Green 2004), whereas the G9.7-0.0 has a near kinematic distance estimate (4.7 kpc) based on an associated OH maser velocity (+43 km s-1) detected toward the SNR (Hewitt & Yusef-Zadeh, 2009). However, the association of G9.62+0.20 (catalog ) and G9.7-0.0 is questionable given their about 40 km s-1 different radial velocity.
Y.X. was supported by Chinese NSF through grants NSF 10673024, NSF 10733030, NSF 10703010, and NSF 10621303.
Appendix A Appendix material: 12 GHz Methanol Masers
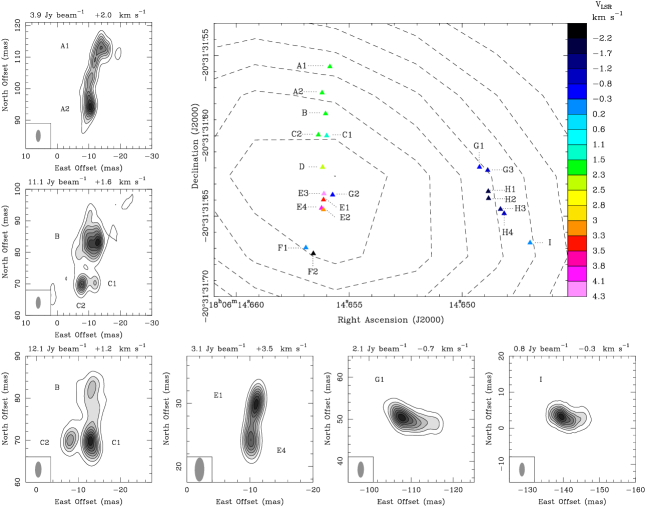
Our measurements allow us to locate the distribution of the individual maser spots with respect to the HCH II component G9.62+0.20 (catalog ) E. Figure 3 presents the absolute positions of the 12 GHz maser spots superposed on the 22 GHz continuum emission map of Testi et al. (2000). For this data taken in the BnA-configuration, the VLA has a synthesized HPBW of at a P.A. of east of north and is insufficient to resolve the emission of the HCH II region E. The accuracy in the absolute position of the VLA map is better than 0.2 arcsec. The spectral index of component E at radio frequencies, from 8.4 to 110 GHz, is 0.95 (Franco et al., 2000). We find that individual 12 GHz methanol maser spot velocities and flux densities, as well as their overall distribution, change little over a time span of about 8 yr, from 1998 November (Minier et al., 2002) to our observations in 2007 March. We detected all nine distinct clusters imaged by Minier et al. (2000, 2002) within a region of about mas2, labeled from A to I, and resolved them into 20 distinct spots/knots. The maser emission generally appears as compact cores of high brightness embedded in extended low brightness structures (Figure 3 edge panels).
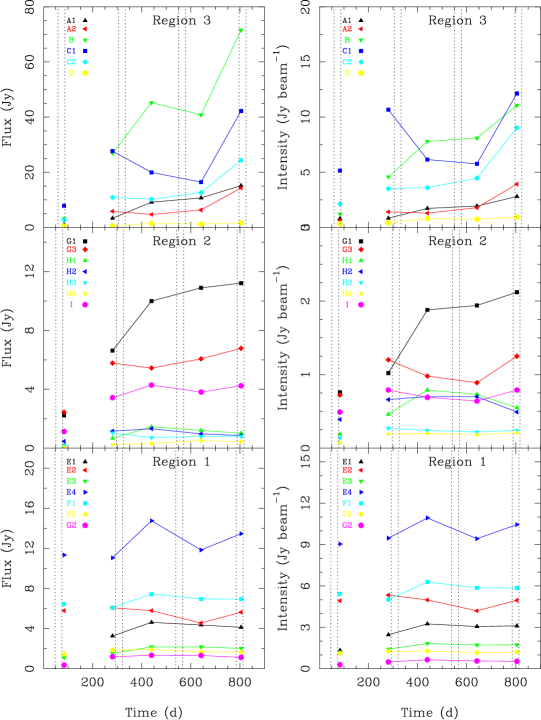
Analysis of the light curves of the brightest channel of each spot is consistent with the timing of the flares measured by Goedhart et al. (2003). Light curve data of 12 GHz methanol maser emission in G9.62+0.20 E at our 5 epochs are plotted in Figure 4. Brightness (Jy beam-1) and integrated flux density (Jy) of the brightest channel of each maser feature are estimated using the task IMSTAT. Selected BOXes for IMSTAT purposes are the same per spot at every epoch. Note that flux densities from the first epoch should be taken as lower limits because of the loss of extended emission due to the lack of short-baselines at that epoch (cf. visibility amplitude vs. uv-distance diagrams in Minier et al. 2002). Epoch 2 falls just before the start of the flare predicted by the periodicity and phasing reported by Goedhart et al. (2003); epoch 3 and 4 fall in the expected quiescent periods. Interestingly, Epoch 5 (2007 March) falls during the expected flaring time and our data for features B and C1 (which displayed the strongest flares previously; cf. Figure 7 in Goedhart et al. 2005) show the greatest increases of flux density.
References
- Bania (1980) Bania, T. M. 1980, ApJ, 242, 95
- Bitran et al. (1997) Bitran, M., Alvarez, H., Bronfman, L., May, J., & Thaddeus, P. 1997, A&AS, 125, 99
- Bronfman et al. (1989) Bronfman, L., Alvarez, H., Cohen, R. S., & Thaddeus, P. 1989, ApJS, 71, 481
- Bronfman et al. (2000) Bronfman, L., Casassus, S., May, J., & Nyman, L.-Å. 2000, A&A, 358, 521
- Brunthaler et al. (2009) Brunthaler, A., Reid, M. J., Menten, K. M., Zheng, X. W., Moscadelli, L., & Xu, Y. 2009, ApJ, 693, 424
- Case & Bhattacharya (1998) Case, G. L., & Bhattacharya, D. 1998, ApJ, 504, 761
- Caswell et al. (1995) Caswell, J. L., Vaile, R. A., Ellingsen, S. P., & Norris, R. P. 1995, MNRAS, 274, 1126
- Caswell (1998) Caswell, J. L. 1998, MNRAS, 297, 215
- Dame et al. (2001) Dame, T. M., Hartmann, D., & Thaddeus, P. 2001, ApJ, 547, 792
- Dame & Thaddeus (2008) Dame, T. M., & Thaddeus, P. 2008, ApJ, 683, L143
- De Buizer et al. (2003) De Buizer, J. M., Radomski, J. T., Telesco, C. M., & Piña, R. K. 2003, ApJ, 598, 1127
- Dehnen & Binney (1998) Dehnen, W., & Binney, J. J. 1998, MNRAS, 298, 387
- Forster & Caswell (1989) Forster, J. R., & Caswell, J. L. 1989, A&A, 213, 339
- Franco et al. (2000) Franco, J., Kurtz, S., Hofner, P., Testi, L., García-Segura, G., & Martos, M. 2000, ApJ, 542, L143
- Garay et al. (1993) Garay, G., Rodriguez, L. F., Moran, J. M., & Churchwell, E. 1993, ApJ, 418, 368
- Goedhart et al. (2003) Goedhart, S., Gaylard, M. J., & van der Walt, D. J. 2003, MNRAS, 339, L33
- Goedhart et al. (2005) Goedhart, S., Minier, V., Gaylard, M. J., & van der Walt, D. J. 2005, MNRAS, 356, 839
- Green (2004) Green, D. A. 2004, Bulletin of the Astronomical Society of India, 32, 335
- Habing et al. (2006) Habing, H. J., Sevenster, M. N., Messineo, M., van de Ven, G., & Kuijken, K. 2006, A&A, 458, 151
- Hewitt & Yusef-Zadeh (2009) Hewitt, J. W., & Yusef-Zadeh, F. 2009, ApJ, 694, L16
- Hofner et al. (1994) Hofner, P., Kurtz, S., Churchwell, E., Walmsley, C. M., & Cesaroni, R. 1994, ApJ, 429, L85
- Hofner & Churchwell (1996) Hofner, P., & Churchwell, E. 1996, A&AS, 120, 283
- Hofner et al. (1996) Hofner, P., Kurtz, S., Churchwell, E., Walmsley, C. M., & Cesaroni, R. 1996, ApJ, 460, 359
- Hofner et al. (2001) Hofner, P., Wiesemeyer, H., & Henning, T. 2001, ApJ, 549, 425
- Kurtz & Franco (2002) Kurtz, S., & Franco, J. 2002, Revista Mexicana de Astronomia y Astrofisica Conference Series, 12, 16
- Minier et al. (2000) Minier, V., Booth, R. S., & Conway, J. E. 2000, A&A, 362, 1093
- Minier et al. (2002) Minier, V., Booth, R. S., & Conway, J. E. 2002, A&A, 383, 614
- Moscadelli et al. (2002) Moscadelli, L., Menten, K. M., Walmsley, C. M., & Reid, M. J. 2002, ApJ, 564, 813
- Moscadelli et al. (2009) Moscadelli, L., Reid, M. J., Menten, K. M., Brunthaler, A., Zheng, X. W., & Xu, Y. 2009, ApJ, 693, 406
- Phillips et al. (1998) Phillips, C. J., Norris, R. P., Ellingsen, S. P., & McCulloch, P. M. 1998, MNRAS, 300, 1131
- Reid et al. (2009a) Reid, M. J., Menten, K. M., Brunthaler, A., Zheng, X. W., Moscadelli, L., & Xu, Y. 2009a, ApJ, 693, 397
- Reid et al. (2009b) Reid, M. J., et al. 2009, ApJ, 700, 137
- Robinson et al. (1984) Robinson, B. J., Manchester, R. N., Whiteoak, J. B., Sanders, D. B., Scoville, N. Z., Clemens, D. P., McCutcheon, W. H., & Solomon, P. M. 1984, ApJ, 283, L31
- Rodriguez-Fernandez & Combes (2008) Rodriguez-Fernandez, N. J., & Combes, F. 2008, A&A, 489, 115
- Russeil (2003) Russeil, D. 2003, A&A, 397, 133
- Schmidt (1965) Schmidt, M. 1965, Galactic Structure, 513
- Scoville et al. (1987) Scoville, N. Z., Yun, M. S., Sanders, D. B., Clemens, D. P., & Waller, W. H. 1987, ApJS, 63, 821
- Sevenster (1999) Sevenster, M. N. 1999, MNRAS, 310, 629
- Stupar et al. (2007) Stupar, M., Filipović, M. D., Parker, Q. A., White, G. L., Pannuti, T. G., & Jones, P. A. 2007, Ap&SS, 307, 423
- Testi et al. (2000) Testi, L., Hofner, P., Kurtz, S., & Rupen, M. 2000, A&A, 359, L5
- Vallée (2008) Vallée, J. P. 2008, AJ, 135, 1301
- Xu et al. (2006) Xu, Y., Reid, M. J., Menten, K. M., & Zheng, X. W. 2006, ApJS, 166, 526
| Source | R.A. (J2000) | Dec. (J2000) | P.A. | Tb | VLSR | |
|---|---|---|---|---|---|---|
| (h m s) | ( ’ ”) | () | () | (Jy beam-1) | (km s-1) | |
| G9.62+0.20 | 18 06 14.6568 | -20 31 31.670 | 5.0–6.3 | +0.1 | ||
| J1803–2030 | 18 03 23.7204 | -20 30 17.242 | 0.7 | -70 | 0.011 | |
| J1811–2055 | 18 11 06.7911 | -20 55 03.286 | 1.2 | 127 | 0.018 |
Note. — Absolute positions are accurate to about 20 mas. Angular offsets () and position angles (P.A.) east of north relative to the maser source are indicated in columns 4 and 5. Brightness (Tb) for the background sources are from the third epoch. Restoring beam sizes (FWHM) were 1.5 mas (round) for G9.62+0.20 and J1803–2030, and 3.0 mas (round) for J1811–2055.
| Maser VLSR | Background | Parallax | ||
|---|---|---|---|---|
| (km s-1) | Source | (mas) | (mas yr-1) | (mas yr-1) |
| +0.1 | J1803–2030 | |||
| +0.1 | J1811–2055 | |||
| Mean |
Note. — Column 1 reports the LSR velocity of the reference maser channel; column 2 indicates the background sources whose data were used for the parallax fit; column 3 reports the fitted parallax; columns 4 and 5 give the fitted proper motions along the east and north direction, respectively. “Mean” is the un-weighted average of the measurements relative to the two background sources.