The spectroscopically confirmed huge cosmic structure at
Abstract
Context. We report on the spectroscopic confirmation of a huge cosmic structure around the CL0016 cluster at . We made wide-field imaging observations of the surrounding regions of the cluster and identified more than 30 concentrations of red galaxies near the cluster redshift. The follow-up spectroscopic observations of the most prominent part of the structure confirmed 14 systems close to the cluster redshift, roughly half of which have a positive probability of being bound to the cluster dynamically. We also made an X-ray follow-up, which detected extended X-ray emissions from 70% of the systems in the X-ray surveyed region. The observed structure is among the richest ever observed in the distant Universe. It will be an ideal site for quantifying environmental variations in the galaxy properties and effects of large-scale structure on galaxy evolution.
Aims.
Methods.
Results.
Key Words.:
Galaxies : clusters : individual : CL0016+16, large-scale structure of Universe1 Introduction
The cosmic large-scale structure has grown from the nearly uniform matter distribution in the early Universe to the rich filamentary and clumpy structure that we observe locally today (York et al. 2000; Colless et al. 2001). Recent large redshift surveys with 8m telescopes unveiled structure up to (Scoville et al. 2007). Cosmic structure is now probed at even higher redshifts by narrow-band surveys (e.g., Shimasaku et al. 2003; Matsuda et al. 2005). Galaxies are arrayed in filamentary structure with a typical scale of 10 Mpc (Colberg et al. 2005) and filaments form the complicated cosmic web. Galaxy clusters often lie at nodes of filaments, and a prominent structure is often expected around them (Bond et al. 1996; Springel et al. 2005) and so is observed (e.g., Gal et al. 2008; Tanaka et al. 2008). Blank field surveys tend to miss a very rich structure because it is rare, but pointed observations of rich clusters can discover it. In this paper, we present an extremely rich structure around the CL0016+16 cluster at .
The structure around the cluster was first noted by Koo (1981). Several follow-up observations have been carried out since then (Hughes et al. 1995; Munn et al. 1997; Hughes & Birkinshaw 1998; Dressler et al. 1999). In Tanaka et al. (2007) we presented the spectroscopic confirmation of the prominent structure around the cluster in the form of two clumpy filaments. The structure appeared to extend outside of the observed field. Motivated by this, we made further imaging and spectroscopic observations of the surrounding regions to follow the entire structure.
The layout of the paper is as follows. In Sect. 2, we summarize our imaging and spectroscopic observations and move on to present the huge structure in Sect. 3. The paper is summarized in Sect. 4. Unless otherwise stated, we adopt H, , and .
2 Observations
2.1 Optical imaging observations
The imaging observations of the surrounding regions of the CL0016 cluster were carried out with Suprime-Cam (Miyazaki et al. 2002) in and bands between August 2007 and January 2008. Six pointings were observed in total (NE, NW, E, W, SW, and SE of the central field presented in Tanaka et al. 2007). The observing conditions were good and all the images were smoothed to a common FWHM size of . The exposure times varied from pointing to pointing, but they were typically 18 min in and 6 min in . Data were reduced using the generic imaging pipeline (Yagi et al. 2002) with custom designed scripts. The photometric zero-points were obtained using the standard stars observed in the same nights. The Galactic extinction was corrected using the dust map by Schlegel et al. (1998).
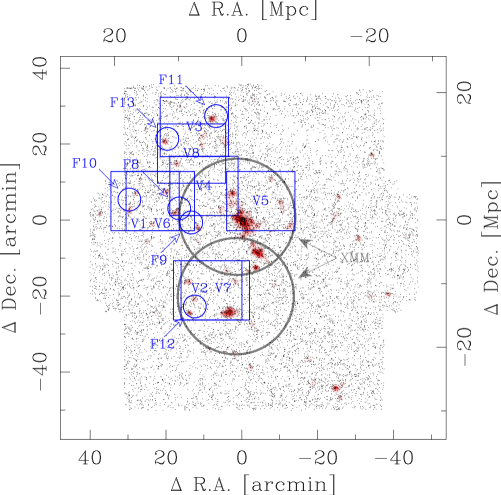
Red galaxies around the cluster redshift were selected using the color ( from the cluster red sequence). The distribution of the selected galaxies is shown in Fig. 1. The extremely rich CL0016 cluster is at (R.A.,Dec.)=(,). A clumpy structure extends to the south reaching to another rich cluster at (R.A.,Dec.)=(,) (Hughes & Birkinshaw 1998). There are more than 10 concentrations of red galaxies in the E-NE of the cluster. There are also several scattered groups to the west of the cluster. The prominent structure seems to extend more than 20 Mpc, and it is potentially among the richest ever discovered in the distant Universe.
2.2 X-ray Observations
CL0016 was originally observed by XMM-Newton for a 38ks observation on 2000 Dec. 29 (OBSID 0111000101 and 0111000201; Worrall & Birkinshaw 2003). This was then followed by a 62ks observation on 2007 Dec. 14 (OBSID 0502860101) that was offset by arcminutes to the south to cover the large-scale structure detected in our optical survey (Kodama et al. 2005). In addition to the standard data processing of the EPIC data, which was done using XMMSAS version 6.5 (Saxton et al. 2005), we performed a more conservative removal of time intervals affected by solar flares (Zhang et al. 2004). To increase our capability of detecting extended, low surface brightness features, we applied the quadruple background subtraction (Finoguenov et al. 2007) and also checked for high background, identifying a hot MOS2 chip (CCD id=5) in the OBSID 0502860101. We removed the identified hot chip from any further analysis. The resulting cleaned exposure time for the on-source observation amounts to 35ksec (pn, m1, m2) and off source ksec (m1 and m2) and 30 ksec (pn).
After the background was estimated for each observation and each instrument separately, we produced the final mosaic of cleaned images. We used the prescription of Finoguenov, A. et al. (2009) for extended source detection, which consists of removal of the PSF model for each detected point source from the data before applying the extended source search algorithm. We found 28 extended X-ray sources in the 0.35 square degrees of the XMM mosaic, 7 of which are associated with the target cluster and groups at the cluster redshift.
For clumps 4 and 6 (see below for the definitions of the clumps), the X-ray data were sufficient for spectral analysis. Spectra were extracted with an aperture of radius 1.5′ for each camera, with background spectra extracted from 4 regions of the same size at the same off-axis angle. This ensured that the vignetting of the X-ray photons was similar in the source and background regions. The data from the different cameras were fit simultaneously with an absorbed APEC model (Smith et al. 2001) with the absorbing column fixed at the Galactic value (Dickey & Lockman 1990). The metal abundance was left free, but was not tightly constrained by the data for either clump. We measured temperatures for clump 4 and 6 as (consistent with Worrall & Birkinshaw 2003) and , respectively.
2.3 Optical spectroscopic follow-up observations
Following the imaging observations, we carried out spectroscopic observations to probe the most prominent part of the structure using FOCAS on Subaru and VIMOS on VLT Melipal. The FOCAS observations were taken on 2008 Aug. 9-10 in visitor mode. The 300B grism blazed at with the SY47 order sorting filter was used giving a resolving power of . The observing conditions were very good and the seeing was arcsec. Six fields were observed in total (F8-F13). Integration times were 60 min (15min 4 shots) for all of the fields, except for F13, which was observed 45 min in total. The data were reduced using a custom-designed pipeline.
The VIMOS observations were taken between October and December 2008 in queue mode. The MR grism with GG495 order sorting filter was used, providing a resolving power of . The observing conditions were variable – thin to clear conditions with seeing. Some of the observations were executed under relatively bright conditions. It should be noted that not all the planned observations were executed, and the resulting field coverage is somewhat patchy. Each mask was exposed for 16 min shots 64 min. The data were reduced in the same way as for the FOCAS data.
We visually inspected all the reduced spectra and assigned redshifts and confidence flags. We also collected redshifts from the literature (Hughes et al. 1995; Hughes & Birkinshaw 1998; Munn et al. 1997; Dressler et al. 1999; Tanaka et al. 2007). The final spectroscopic catalog contains 1202 secure redshifts and 132 possible redshifts including 48 duplicated measurements. The median and dispersion of the differences between the duplicated redshifts are and 0.0007, respectively. There is no sign of systematic offset between the different observing runs. We regard redshifts with quality flag from Munn et al. (1997) and flag from Dressler et al. (1999) as secure. In this paper, we use only objects with secure redshifts.
3 The cosmic large-Scale structure at
We present in Fig 2 the spectroscopically confirmed large-scale structure around the CL0016 cluster. We confirm many of the photometrically identified groups of galaxies with a few exceptions, which turn out to be background systems. Apparent concentrations of spectroscopic galaxies are numbered in the figure and their properties are summarized in Table 3. Their coordinates are given in J2000 in the 2nd and 3rd columns. Redshifts (4th column) and velocity dispersions (6th column) are estimated with the -clipped biweight estimator and gapper method (Beers et al. 1990), respectively, using galaxies within 0.5 Mpc (physical) from the clump centers. The numbers of galaxies used after the clipping are listed in the 5th column. The centers are defined as the positions of the outstandingly bright spectroscopic members or the averaged centers of a few brightest members. The errors were estimated by bootstrapping the input objects taking the individual redshift errors into account. The 7th and 8th columns are masses ( in units of ) from the velocity dispersion (Carlberg et al. 1997) and X-ray, respectively.
The statistics are still poor, and it is in some cases not obvious whether a clump is a bound system. We classify a clump as a group if there is a strong spatial and redshift concentration of galaxies based on a visual inspection. The clumps with weak spatial concentrations may be loose groups, but we are not yet sure at this point. Several statistical methods of quantifying filamentary structure are proposed in the literature (e.g., minimum spanning tree; Barrow et al. 1985), but we cannot apply these methods to our data due to the very irregular spatial sampling of the spectroscopic galaxies.
The prominent structure extends towards the NE of the cluster, where we confirm 7 systems (clumps 7, 8, 13, 14, 15, 16, and 17). There seems to be two distinct structures there. One is at , only a slight distance from the CL0016 cluster (), consisting of clumps 8, 14, and 16. The other one is at the cluster redshift formed by the other clumps. The main structure extends towards west and SE as reported in Tanaka et al. (2007), but there are several concentrations of red galaxies, for which we did not perform spectroscopic follow-up observations. We did not explore S-SW of the cluster further beyond clump 6, but it is interesting to note that the spectroscopically observed galaxy at (R.A, .Dec.)(,) by Munn et al. (1997) is an outstandingly bright galaxy at the center of a concentration of red galaxies. This likely cD galaxy of a possible group implies that the structure extends farther. It will not be surprising if the structure extends beyond the probed field.
We quantified the dynamical status of the structure based on the classical Newtonian dynamics (Beers et al. 1982; Hughes et al. 1995; Lubin et al. 1998). We estimated a probability that each system is dynamically bound to the CL0016 cluster. The entire tidal field around the cluster should ideally be taken into account, but in our particular case, the CL0016 cluster is by far the most massive system in the field, and it likely dominates the tidal field. Here we simply solve the two-body problem. Most of the masses from the velocity dispersions have large errors due to poor statistics. We used X-ray masses where available. For the CL0016 cluster, we used the hydrostatic mass derived by Solovyeva et al. (2007). For clumps 4 and 6, we used our derived temperatures to estimate masses from the mass-temperature relation of Sanderson et al. (2003; we used their relation D and included self-similar evolution). For the other clumps detected in X-ray, masses were estimated using the relation from Leauthaud, A. et al. (2009). The luminosity derived masses of clumps 4 and 6 are consistent with those derived from the temperature.
The probabilities are summarized in the 9th column in Table 3. The probabilities for clumps 1, 2, 3, and 6 are somewhat lower compared to those by Tanaka et al. (2007) due to the lower mass of the CL0016 cluster adopted here. (Tanaka et al. 2007 took the mass from velocity dispersion) Many of the confirmed groups close to the cluster are likely to be bound to the cluster, suggesting they would fall into the cluster in the future. Clumps 8, 14, and 16 are not bound to the cluster, and the NE structure at is not within the gravitational reach of the cluster. However, given its close proximity () to the cluster, the structure is likely spatially connected to the cluster, being a part of the huge cosmic structure around CL0016. The rest of the clumps in the NE may be bound to the cluster albeit with the large uncertainties.
This is the first confirmation of such a prominent clumpy structure in the distant Universe, which is among the richest ever observed. The structure extends well over 20 Mpc, and some of the clumps are probably bound to the central cluster. This suggests that it is a physically connected structure. However, the structure can be further extended beyond the probed field given that some of the spectroscopically confirmed groups are located near the edge of the field. More observations are needed to observe the gigantic cosmic structure in its entirety.

| R.A. | Dec. | [] | comment | ||||||
|---|---|---|---|---|---|---|---|---|---|
| CL0016 | 00 18 33.4 | 16 26 14 | 24 | — | is from Solovyeva et al. (2007) | ||||
| Clump1 | 00 17 40.2 | 16 24 59 | 6 | () | filament/group reported in Tanaka et al. (2007) | ||||
| Clump2 | 00 17 58.9 | 16 23 28 | 8 | () | filament/group reported in Tanaka et al. (2007) | ||||
| Clump3 | 00 18 16.4 | 16 14 02 | 6 | group reported in Tanaka et al. (2007) | |||||
| Clump4 | 00 18 17.4 | 16 17 39 | 12 | cluster reported in Hughes et al. (1995) | |||||
| Clump5 | 00 18 43.7 | 16 33 17 | 9 | group | |||||
| Clump6 | 00 18 47.6 | 16 02 14 | 21 | cluster reported in Hughes & Birkinshaw (1998) | |||||
| Clump7 | 00 19 06.5 | 16 53 02 | 8 | — | group | ||||
| Clump8 | 00 19 17.6 | 16 48 29 | 4 | — | group? | ||||
| Clump9 | 00 19 22.2 | 16 24 32 | 5 | — | background loose group? | ||||
| Clump10 | 00 19 25.7 | 16 05 23 | 8 | () | group | ||||
| Clump11 | 00 19 31.5 | 16 27 44 | 4 | background group | |||||
| Clump12 | 00 19 32.4 | 16 02 03 | 13 | background group | |||||
| Clump13 | 00 19 47.9 | 16 28 11 | 10 | — | group | ||||
| Clump14 | 00 19 53.3 | 16 36 02 | 6 | — | loose group? | ||||
| Clump15 | 00 19 58.4 | 16 46 58 | 9 | — | group | ||||
| Clump16 | 00 20 10.4 | 16 25 21 | 4 | — | group? | ||||
| Clump17 | 00 20 29.9 | 16 33 23 | 7 | — | group |
4 Summary
We have reported the spectroscopic confirmation of the huge structure at . We carried out the wide-field imaging and spectroscopic observations of the rich cluster CL0016 at . We spectroscopically confirmed many of the photometrically identified galaxy groups at the cluster redshift. The structure probed will be among the most prominent confirmed structures in the distant Universe, although the structure likely extends farther.
The huge structure provides us with a unique opportunity to quantify the dependence of galaxy properties on the whole range of environment at . In particular, we can address the effects of large-scale environments on galaxy evolution. The amplitude of clustering of groups around the CL0016 is unusually high. This enables us to effectively extend our previous studies to large physical separations, where the role of structure formation on galaxy properties has not been revealed yet. We will report on differences in spectral properties of galaxies in different environments, together with more detailed X-ray analysis, in a forthcoming paper.
Acknowledgements.
This study is based on data collected at the Subaru Telescope, which is operated by the National Astronomical Observatory of Japan, through program S07B-SV148 and S08B-025. We thank Dr. Furusawa and Dr. Hattori for their help during the observations. This study is also based on observations obtained at the ESO Very Large Telescope through program 082.A-0201 and on observations obtained with XMM-Newton, an ESA science mission with instruments and contributions directly funded by ESA Member States and NASA. We thank S. Finnegan and J. Leyland for their preliminary analysis of the XMM data. This work was financially supported in part by the Grant-in-Aid for Scientific Research (No. 18684004 and 21340045) by the Japanese Ministry of Education, Culture, Sports, and Science. YK acknowledges support from the Japan Society for the Promotion of Science (JSPS) through JSPS fellowships for Young Scientists. AF has been partially supported trough NASA grant NNX08AD93G to UMBC. We thank the anonymous referee for helpful comments, which improved the paper.References
- Barrow et al. (1985) Barrow, J. D., Bhavsar, S. P., & Sonoda, D. H. 1985, MNRAS, 216, 17
- Beers et al. (1990) Beers, T. C., Flynn, K., & Gebhardt, K. 1990, AJ, 100, 32
- Beers et al. (1982) Beers, T. C., Geller, M. J., & Huchra, J. P. 1982, ApJ, 257, 23
- Bond et al. (1996) Bond, J. R., Kofman, L., & Pogosyan, D. 1996, Nature, 380, 603
- Carlberg et al. (1997) Carlberg, R. G., Yee, H. K. C., & Ellingson, E. 1997, ApJ, 478, 462
- Colberg et al. (2005) Colberg, J. M., Krughoff, K. S., & Connolly, A. J. 2005, MNRAS, 359, 272
- Colless et al. (2001) Colless, M., Dalton, G., Maddox, S., et al. 2001, MNRAS, 328, 1039
- Dickey & Lockman (1990) Dickey, J. M. & Lockman, F. J. 1990, ARA&A, 28, 215
- Dressler et al. (1999) Dressler, A., Smail, I., Poggianti, B. M., et al. 1999, ApJS, 122, 51
- Finoguenov et al. (2007) Finoguenov, A., Guzzo, L., Hasinger, G., et al. 2007, ApJS, 172, 182
- Finoguenov, A. et al. (2009) Finoguenov, A. et al. 2009, ApJ, accepted
- Gal et al. (2008) Gal, R. R., Lemaux, B. C., Lubin, L. M., Kocevski, D., & Squires, G. K. 2008, ApJ, 684, 933
- Hughes & Birkinshaw (1998) Hughes, J. P. & Birkinshaw, M. 1998, ApJ, 497, 645
- Hughes et al. (1995) Hughes, J. P., Birkinshaw, M., & Huchra, J. P. 1995, ApJ, 448, L93+
- Kodama et al. (2005) Kodama, T., Tanaka, M., Tamura, T., et al. 2005, PASJ, 57, 309
- Koo (1981) Koo, D. C. 1981, ApJ, 251, L75
- Leauthaud, A. et al. (2009) Leauthaud, A. et al. 2009, ApJ, submitted
- Lubin et al. (1998) Lubin, L. M., Postman, M., & Oke, J. B. 1998, AJ, 116, 643
- Matsuda et al. (2005) Matsuda, Y., Yamada, T., Hayashino, T., et al. 2005, ApJ, 634, L125
- Miyazaki et al. (2002) Miyazaki, S., Komiyama, Y., Sekiguchi, M., et al. 2002, PASJ, 54, 833
- Munn et al. (1997) Munn, J. A., Koo, D. C., Kron, R. G., et al. 1997, ApJS, 109, 45
- Saxton et al. (2005) Saxton, R. D., Altieri, B., Read, A. M., et al. 2005, in Society of Photo-Optical Instrumentation Engineers (SPIE) Conference Series, Vol. 5898, Society of Photo-Optical Instrumentation Engineers (SPIE) Conference Series, ed. O. H. W. Siegmund, 73–84
- Schlegel et al. (1998) Schlegel, D. J., Finkbeiner, D. P., & Davis, M. 1998, ApJ, 500, 525
- Scoville et al. (2007) Scoville, N., Aussel, H., Brusa, M., et al. 2007, ApJS, 172, 1
- Shimasaku et al. (2003) Shimasaku, K., Ouchi, M., Okamura, S., et al. 2003, ApJ, 586, L111
- Smith et al. (2001) Smith, R. K., Brickhouse, N. S., Liedahl, D. A., & Raymond, J. C. 2001, ApJ, 556, L91
- Solovyeva et al. (2007) Solovyeva, L., Anokhin, S., Sauvageot, J. L., Teyssier, R., & Neumann, D. 2007, A&A, 476, 63
- Springel et al. (2005) Springel, V., White, S. D. M., Jenkins, A., et al. 2005, Nature, 435, 629
- Tanaka et al. (2008) Tanaka, M., Finoguenov, A., Kodama, T., et al. 2008, A&A, 489, 571
- Tanaka et al. (2007) Tanaka, M., Kodama, T., Kajisawa, M., et al. 2007, MNRAS, 377, 1206
- Worrall & Birkinshaw (2003) Worrall, D. M. & Birkinshaw, M. 2003, MNRAS, 340, 1261
- Yagi et al. (2002) Yagi, M., Kashikawa, N., Sekiguchi, M., et al. 2002, AJ, 123, 66
- York et al. (2000) York, D. G., Adelman, J., Anderson, Jr., J. E., et al. 2000, AJ, 120, 1579
- Zhang et al. (2004) Zhang, Y.-Y., Finoguenov, A., Böhringer, H., et al. 2004, A&A, 413, 49