High-redshift elliptical galaxies: are they (all) really compact?
Abstract
We investigate the properties of 12 ultra-massive passively evolving early type galaxies (ETGs) at in the COSMOS 2 deg2 field. These 12 ETGs were selected as s, have accurate , high Sérsic index profiles typical of ellipticals, no detection at 24m, resulting in a complete ETG sample at (Chabrier IMF). Contrary to previous claims, the half light radii estimated in very high S/N imaging data from HST+ACS are found to be large for most of the sample, consistent with local ellipticals. If the high redshift ETGs with are really small in size and compact as reported in previous studies, our result may suggest a “downsizing” scenario, whereby the most massive ETGs reach their final structure earlier and faster than lower mass ones. However, simulating galaxies with morphological properties fixed to those of local ETGs with the same stellar mass show that the few compact galaxies that we still recover in our sample can be understood in term of fluctuations due to noise preventing the recovery of the extended low surface brightness halos in the light profile. Such halos, typical of Sérsic profiles, extending even up to 40 kpc, are indeed seen in our sample.
keywords:
galaxies:evolution – galaxies:formation –galaxies: high redshift – galaxies: elliptical and lenticular, cD.1 Introduction
Understanding the formation processes of galactic spheroids, i.e., bulges and early-type galaxies (ETG), remains a central theme in the context of galaxy formation and evolution. The discovery of a widespread population of passively evolving ETGs at proved that quenching of star formation in massive galaxies is well under way by (Glazebrook et al. 2004; Cimatti et al. 2004).
Further studies of high redshift ETGs then revealed an unexpected property of a sizable fraction of them: many such ETGs appear to have much smaller effective radii (, by factors to ) with respect to ETGs of comparable stellar mass () in the local Universe (Daddi et al. 2005, D05), a result then confirmed by several other studies (e.g. Trujillo et al. 2006, 2007; Longhetti et al. 2007; Zirm et al. 2007; McGrath et al. 2008; Toft et al. 2007; Cimatti et al. 2008; van Dokkum et al. 2008; Buitrago et al. 2008; Damjanov et al. 2009; Saracco et al. 2009; Rettura et al. 2008). ETGs with similar stellar densities appear to be extremely rare in the local Universe (Trujillo et al. 2009), although it has been argued that such compact high redshift ETGs have survived as the cores of present-day massive spheroids (Hopkins et al. 2009).
It has also been argued that the relation for ETGs would keep evolving also from all the way to , with a steady increase of for given (van der Wel et al. 2008; Bernardi 2009).
The formation of very compact ETGs at high redshift may not be a problem: submillimetre galaxies appear to have comparable masses (largely in gas form) and radii, hence may likely be precursors to compact ETGs (Cimatti et al. 2008; Tacconi et al. 2008), turning into them upon expulsion of their residual gas. However, no generally accepted explanation has yet been established on how such compact ETGs would evolve into their present descendants, i.e., how they can inflate to reach 2–4 times larger effective radii.
ETG-ETG (dry) merging soon appeared to be a plausible mechanism (e.g., Khochfar & Silk 2006), but most such events would result in an increase of both mass and radius such to move galaxies parallel to the local relation, rather than towards it (Cimatti et al. 2008; Saracco et al. 2009). Moreover, major dry merging events may be too rare anyway, as the vast majority of high- ETGs do not appear to have close ETG companions of similar brightness (Cimatti et al. 2008). Having excluded major mergers, accretion of many satellites (i.e., minor dry mergers) were then considered, either adding an extended envelope to the compact core (Cimatti et al. 2008), or expanding such core by gravitationally heating (Naab et al. 2007). It has also been suggested that the expansion of high- ETGs would be the result of AGN feedback driving the rapid expulsion of the residual gas (Fan et al. 2008), but such expansion must take place in at most a few dynamical times ( yr), hence only very few objects could be caught as already passive and still compact.
On the other hand, the possibility that the apparent small radii may not be real was not completely excluded. This could be either the effect of part of the light coming from a centrally concentrated source (e.g., an AGN or central starburst), or to some systematic bias not having been taken in full account (D05). Recently, La Barbera et al. (2009) have argued for the presence of a radial age gradient in local ETGs, that would result in an apparent decrease of with increasing redshift, as the younger, more centrally concentrated population differentially brightens w.r.t. the older and broader stellar component. However, there appears to be no strong colour gradients in the few cases in which both optical and near-IR HST imaging is available for high- ETGs (e.g. Toft et al. 2007), or within different ACS bands (D05).
In this letter we present the results of two-dimensional (2D) surface brightness profile fitting of a complete sample of 12 extremely massive ETGs () at , using the HST+ACS/WFC images of the COSMOS 2 deg2 field (Koekemoer et al. 2007). Selection of high-z ETGs over such a large area allows us to pick the most massive/luminous high- ETGs, and tackle the size issue with the highest S/N ratio.
2 Data, sample selection, and SED fitting
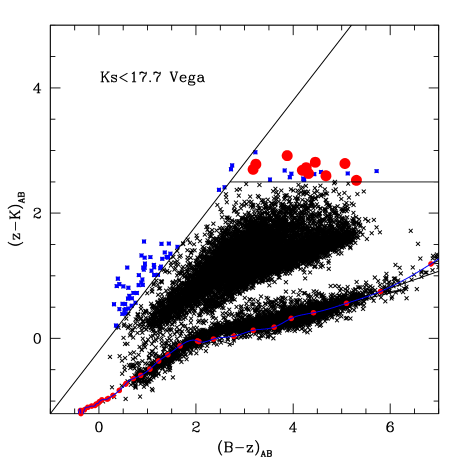
A sample of extremely massive ETGs was extracted from the catalogue of -selected galaxies in the 2 deg2 COSMOS field (McCracken et al. 2009). From this catalogue we extracted all the objects with , whose corresponding plot is shown in Fig. 1. From this sample we then selected the brightest galaxies satisfying the passive BzK galaxy criterion of Daddi et al. (2004), for which the limit roughly corresponds to at for a Chabrier IMF. This resulted in a sample of 22 sources, having retained only galaxies with IRAC 3.6 m detections with separations from the -band positions, a criterion required to avoid objects affected by blending in the IRAC and MIPS images (see, e.g. Daddi et al. 2007). We notice that 4 star-forming galaxies () are found to , after excluding likely AGNs among s, i.e., the blue squares with in Fig. 1. The colours of these 4 objects are close to the boundary and in principle some genuine ETG could have been scattered there just by photometric errors noise. However, we find that all 4 objects are well detected at m.
Since these 22 -selected objects could include heavily dust-reddened star-forming galaxies at , we carefully checked the properties of the sample to solidly identify the bona-fide ETGs and discard possible contaminants. We requested all of the following criteria for retaining ETG candidates:
i) non detection at 24 m in the Spitzer+MIPS data (Sanders et al. 2007). We used the most recent deep catalogue by Aussel & Le Floc’h, reaching 5 completeness levels down to 80Jy (Le Floc’h et al. 2009, submitted to ApJ). This corresponds to a limit of Star Formation Rate (SFR) yr-1 for , using the models of Chary & Elbaz (2001);
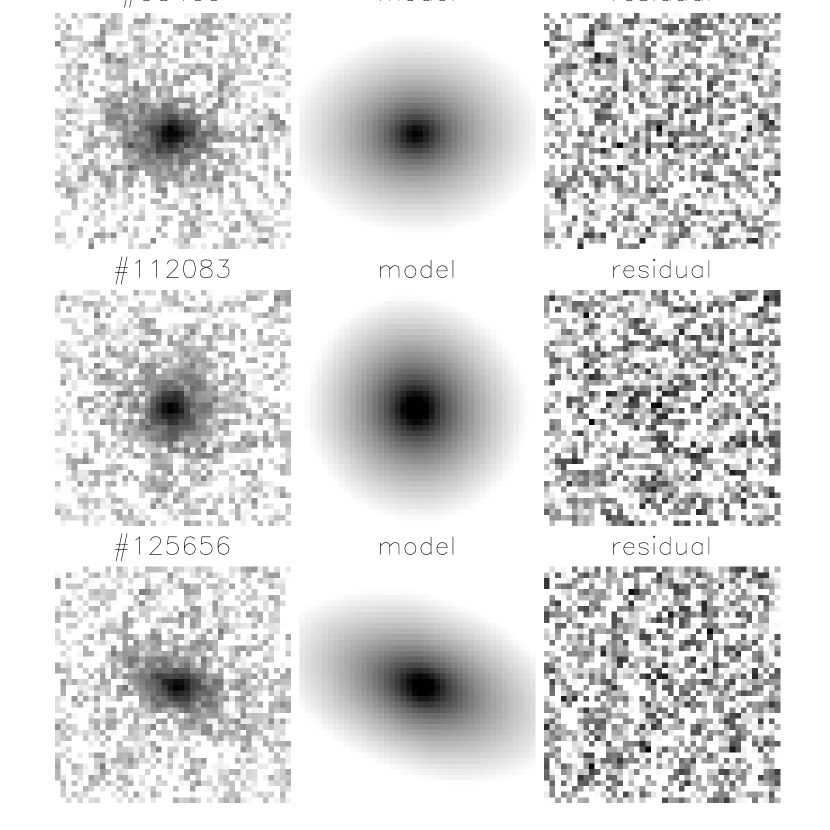
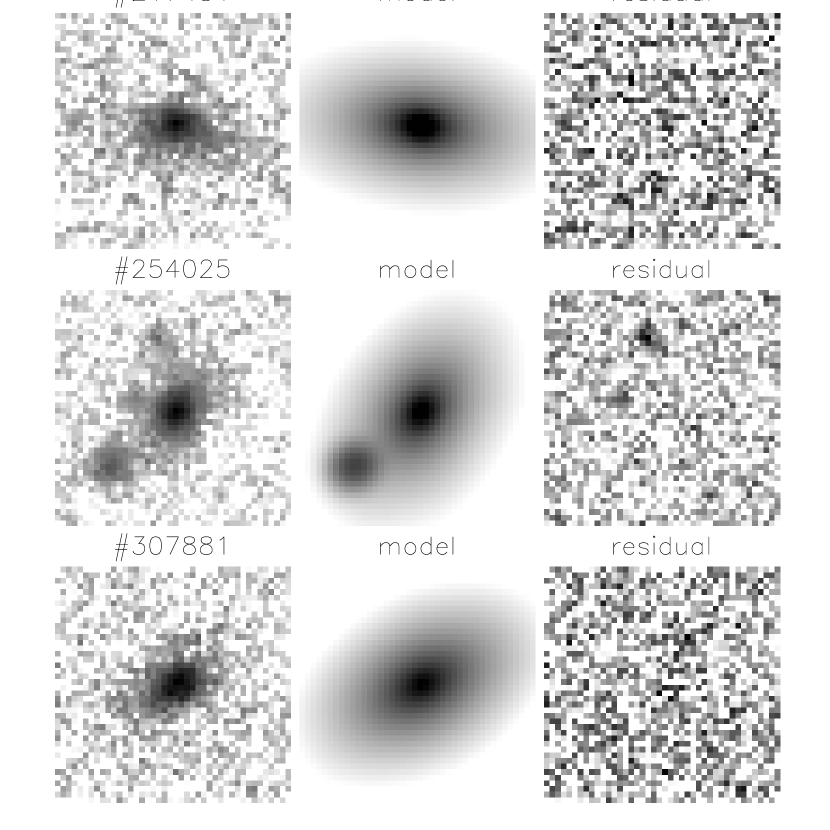
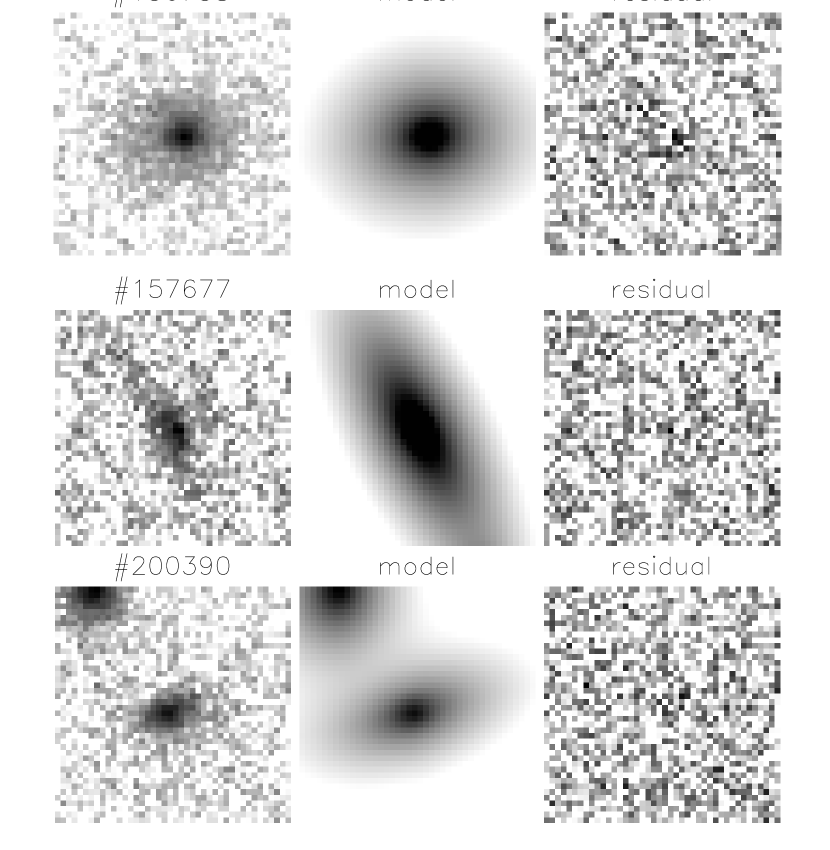
ii) elliptical like compact morphology, based on a visual inspection of the ACS –band images (Fig. 2);
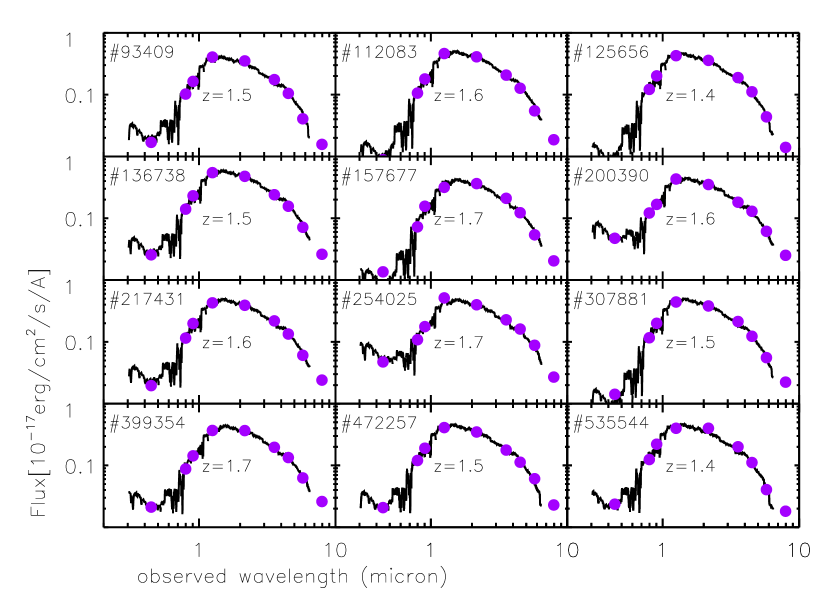
iii) multicolour SEDs best fitted with old, passively evolving populations with no dust reddening as showing in Fig. 3. SEDs were constructed using COSMOS photometry in the -, -, -, , -band data consistently with McCracken et al (2009), expanded to include photometry in the first 3 IRAC bands (from Ilbert, Salvato, & S-COSMOS collaboration, Ilbert et al. (2009).
We found that 12 of the 22 galaxies do satisfy all these criteria and are retained as our sample of bona-fide ETGs. The remaining 10 galaxies that were discarded are found to fail multiple criteria in most cases: they tend to be 24m detected (6/10), have irregular (or point like, unresolved) morphologies in the ACS imaging (7/10), are best fitted by star forming galaxy templates with large amounts of reddening (7/10), or show evidence for strong AGN contamination of the optical/near-IR light (3/10) as indicated by the ‘power law’ shape of the SED and X-ray and/or radio detection. These criteria are very efficient in selecting truly passively evolving ETGs, as confirmed by their spectroscopic identification in the HUDF by D05.
Photometric redshifts and stellar masses were derived from the SEDs using the Hyperz code (Bolzonella et al. 2000), and fitting photometric data with simple stellar populations (SSP) as well as with composite populations described by -models (SFR, with from 0.1 Gyr to ), and using the population models of Maraston (2005). This parametrisation of the star formation history may be inappropriate for actively star forming galaxies (especially at high redshifts), because it assumes that all galaxies are caught at their minimum SFR. However, for passively evolving galaxies this assumption may not affect appreciably the redshift and mass determinations, as their SFR is indeed .
The 10 galaxies that we discarded as dusty contaminants are found to be at . All 12 bona-fide ETGs have photometric redshifts in the range of , are fitted by SSP models (Maraston 2005) older than Gyr (i.e., with strong 4000Å/Balmer breaks), and have stellar masses in the range , adopting the Chabrier (2003) IMF, as reported in Table 1. Following D05 and Maraston et al. (2006) we expect that photometric redshifts of ETGs computed in this way should be accurate to within .
3 Surface brightness profile fitting and simulations
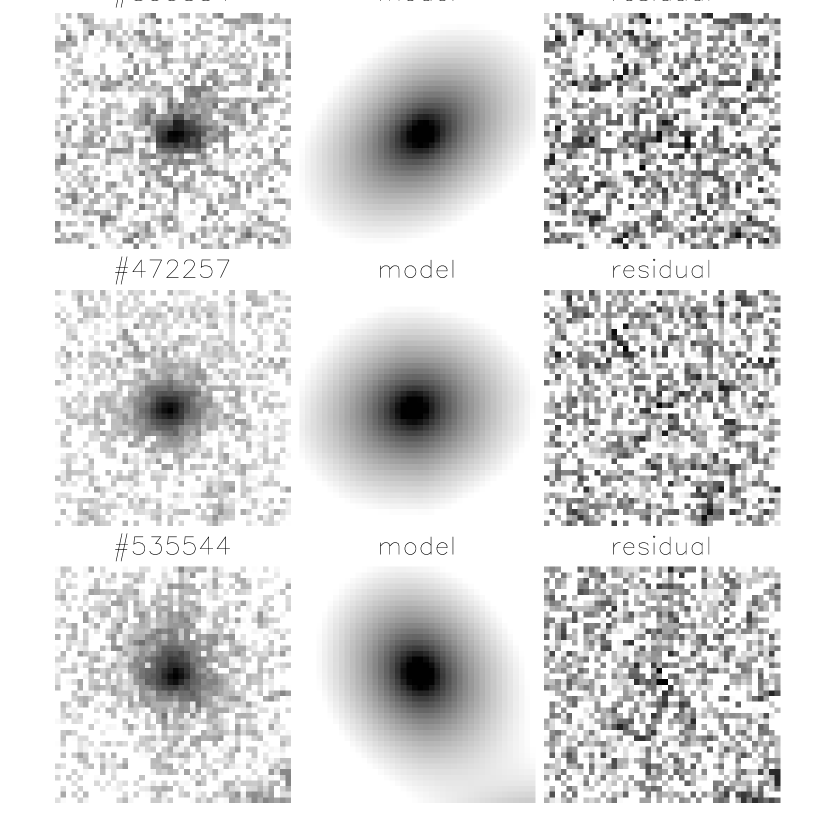
We used GALFIT (Peng et al. 2002) to fit 2D Sersic (1968) profiles to the -band (F814W filter) ACS images of the 12 ETGs. The median integration over the COSMOS field is 2028 s, the pixel-scale is , and the FWHM of the PSF is . GALFIT was run on sky-subtracted images, obtained by the SExtractor software (Bertin & Arnouts 1996). Thus, the sky was fixed to a null value in the GALFIT procedure, and the galaxy Sérsic index (), effective radius (), and total magnitude () were left as free parameters. Other free parameters in the fit are the object position (, ), the position angle (PA) of the major axis , and the axis ratio () between minor and major axis. On the other hand, leaving both and the sky background as free parameters in GALFIT may lead to unreliable results for galaxies with intrinsically high values of (see the GALFIT home page111http://users.ociw.edu/peng/work/galfit/TFAQ.html#sensitivity). For each galaxy the adopted PSF was obtained from the closest suitable bright unsaturated star. We verified that swapping PSF by using different stars in the COSMOS field or synthetic PSFs, built by means of the Tiny Tim222http://www.stsci.edu/software/tinytim software package (v. 6.3 Krist & Hook 2004) gives virtually identical results. When galaxy isophotes partially overlap with bright close neighbours, we fitted galaxy and neighbours simultaneously (this was the case for objects #136738, #157677, #200390, #254025). For smaller and fainter neighbours we used masked regions. Weight maps were used accounting for shot noise and sky noise.
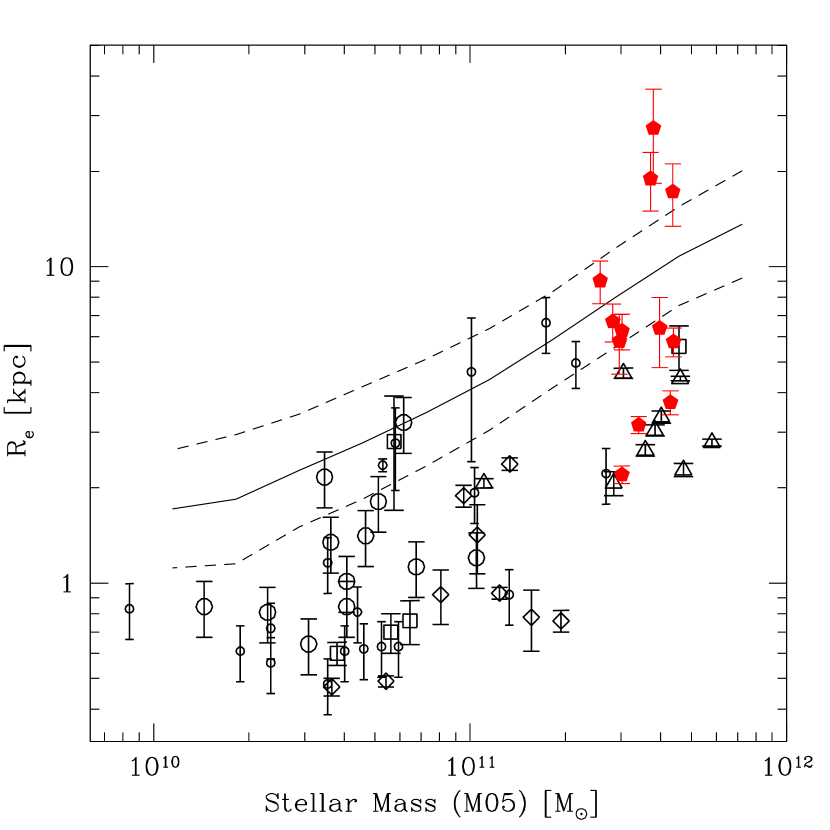
In Fig. 2 we show the galaxy ACS I-band images, the corresponding GALFIT best fit model, and the residuals for each object. The best-fit parameters , the Sérsic index (which measures the light central concentration), and the half light radius (i.e. circularised radius of the ellipse containing half of the total luminosity of the best-fitting Sérsic profile) are reported in Table 1. As shown in Fig. 4 and Table 1, only 3 of the 12 objects have very small effective radii for their mass ( arcsec, i.e., to kpc at ). This qualifies them as ‘compact’, compared to the local ellipticals, whereas the remaining 9 objects appear to be consistent with local ETGs, although the effective radii of some of the objects with the largest size (e.g., #136738, #535544, #157677) have also very large intrinsic uncertainties. For all the objects but one we found , as expected for typical ETGs. The exception is object #307881, one of the smallest in the sample, which may consist of a bulge plus an exponential disk. On the contrary, the highest Sérsic index () is found for object #136738. A large generally indicates an highly centrally concentrated light profile, compatible with such massive elliptical galaxy. However, for this object the presence of some structure at the centre of the residual image (Fig. 2) suggests that a central unresolved point-source (probably an AGN) may have contributed to increase the value. Thus, we fitted object #136738 by adding a central point-source, finding =1.22 arcs ( 10 kpc at ), and =22.28 for the Sérsic component, and a magnitude of =25.88 for the point source component. We conclude that the possible presence of a point-source would decrease by almost a factor of 2 the resulting value, but it would not dramatically affect the large ( kpc) found for this object, still consistent with the size of similarly massive local ETGs.
Fig. 4 shows that our 12 ETGs span a large range in size, although they have very similar masses. A large scatter in the size distribution was also found in other studies for less massive galaxies. Note that the 3 smallest objects in our sample, with kpc, are among the faintest in the full sample of 12 ETGs, and are all fainter than . This leads us to wonder if the 3 small galaxies are really small as we have measured, or if their apparent small is due to an observational bias. Thus, what we would like to clarify is whether the recovered distribution of and for our ETG sample, including the 3 apparently small galaxies, could still be consistent with the local distribution of these structural parameters.
In order to answer this question we have constructed a simulated set of galaxies all having kpc and , which are the typical values for local ETGs with stellar masses as large as those estimated for the 12 ETG objects at (Shen et al. 2003; Caon et al. 1993). The GALFIT package was used to generate synthetic galaxies with the chosen light profile and having total fluxes similar to those of our ETG sample. The simulated galaxies were placed in empty sky regions of the COSMOS ACS image, close to our real galaxies (within arcmin), resulting in similar values of background noise. The noise and PSF images were constructed as for the real observed galaxies, and we tested that the results were not substantially altered if we used different PSF stars for creating and fitting the simulated galaxies.
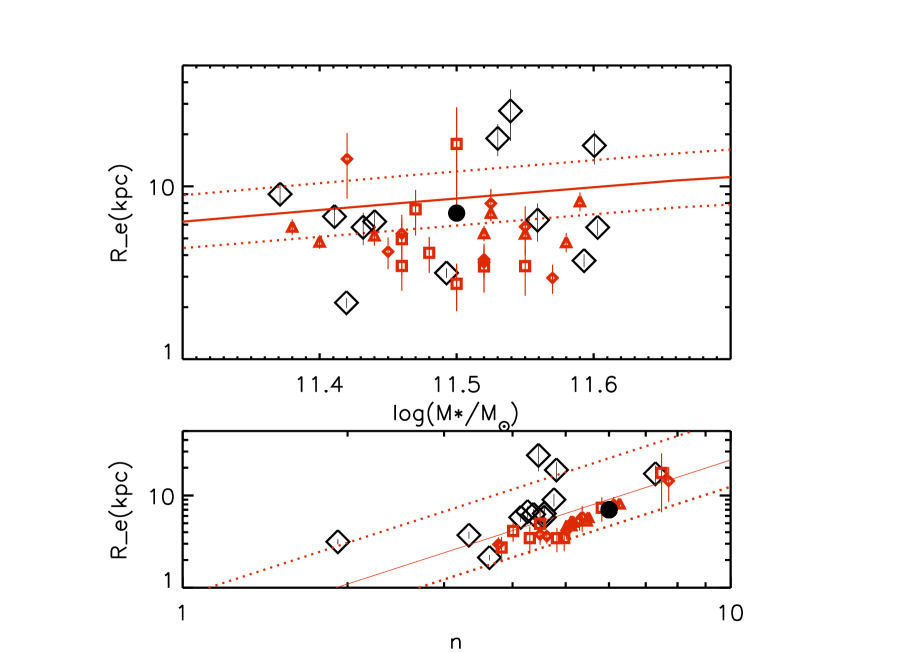
In the two panels of Fig. 5 the local average and relations and their 1 dispersion are compared with , , and masses of our 12 ETGs, along with those obtained for 24 simulated objects, assuming different input luminosities, namely =22, 23, 23.5, and positions on the frame.
It is worth emphasising that all the 24 simulated galaxies have the same intrinsic effective radius and Sérsic index (i.e., we are neglecting here intrinsic size and scatter), and yet their output and well reproduce the large scatter in and observed for our real sample. The spread in size for the simulated galaxies is a result of the spread in luminosity and of the different local background noise realisations, with a tendency to underestimate the size by up to a factor for the faintest objects, with . This suggests that the apparent compactness of the 3 smallest objects (that are also among the faintest ones) may be just a consequence of their lower S/N ratio, but intrinsically they could not be exceptionally small in size compared to local ETGs of the same mass. Thus, within our sample of 12 very high mass ETGs at we do not find convincing evidence for the small size syndrome affecting other samples of high- ETGs. We conclude that the sample of 12 ETGs at shows a distribution of sizes that is fully consistent with those of local ETGs of the same mass.
| #ID | RA(J200) | Dec(J200) | m814 | (arcs) | (kpc) | n | zph | log(M*) | age | AV | |
|---|---|---|---|---|---|---|---|---|---|---|---|
| 93409 | 10:01:27.0044 | 01:39:53.1198 | 22.730.08 | 0.780.11 | 6.700.92 | 4.260.34 | 1.52 | 11.45 | 2.40 | 0.08 | 17.68 |
| 112083 | 09:59:11.4551 | 01:42:25.2173 | 22.930.05 | 0.440.04 | 3.730.32 | 3.33 0.21 | 1.61 | 11.63 | 2.75 | 0.00 | 17.51 |
| 125656 | 10:00:22.9577 | 01:44:16.8353 | 22.530.07 | 0.730.09 | 6.260.81 | 4.37 0.35 | 1.43 | 11.48 | 2.75 | 0.08 | 17.66 |
| 136738 | 09:59:47.0280 | 01:45:52.2360 | 21.980.11 | 2.020.45 | 17.273.84 | 7.29 0.58 | 1.59 | 11.64 | 2.40 | 0.00 | 17.35 |
| 157677 | 10:01:34.2920 | 01:48:32.0022 | 22.510.20 | 3.201.06 | 27.369.03 | 4.46 0.62 | 1.70 | 11.58 | 2.50 | 0.00 | 17.64 |
| 200390 | 10:01:01.9974 | 01:54:32.4251 | 23.430.11 | 0.680.14 | 5.811.24 | 4.57 0.60 | 1.61 | 11.47 | 2.00 | 0.08 | 17.68 |
| 217431 | 10:02:39.5288 | 01:56:59.1162 | 21.850.12 | 2.220.47 | 18.923.98 | 4.81 0.44 | 1.61 | 11.57 | 2.40 | 0.00 | 17.56 |
| 254025 | 10:02:28.4912 | 02:02:13.6899 | 22.500.06 | 0.680.07 | 5.790.61 | 4.14 0.26 | 1.71 | 11.64 | 2.10 | 0.08 | 17.54 |
| 307881 | 10:02:35.6396 | 02:09:14.3640 | 22.950.04 | 0.370.02 | 3.160.20 | 1.92 0.12 | 1.52 | 11.53 | 2.50 | 0.08 | 17.59 |
| 399354 | 10:02:49.4055 | 02:21:47.4012 | 22.980.14 | 0.750.20 | 6.391.60 | 4.57 0.64 | 1.70 | 11.59 | 2.30 | 0.08 | 17.63 |
| 472257 | 10:01:06.0754 | 02:31:35.1966 | 23.040.04 | 0.250.02 | 2.130.14 | 3.63 0.23 | 1.52 | 11.46 | 2.40 | 0.00 | 17.69 |
| 535544 | 10:00:00.6592 | 02:40:29.6220 | 22.290.09 | 1.060.16 | 9.031.39 | 4.76 0.35 | 1.41 | 11.41 | 2.30 | 0.16 | 17.54 |
From left to right: #ID: identification number in the catalogue of McCracken et al (2009); RA(J2000) and Dec(J2000): coordinates from WIRCAM/-band data set; m814: ACS F814W –band magnitude; : effective radius in arcseconds and kpc; n: Sérsic index; zph: photometric redshifts, log(M*): galaxy stellar masses in M⊙ units; mean stellar age in Gyrs; AV reddening parameter; : -band WIRCAM+CHFT magnitude in Vega system).
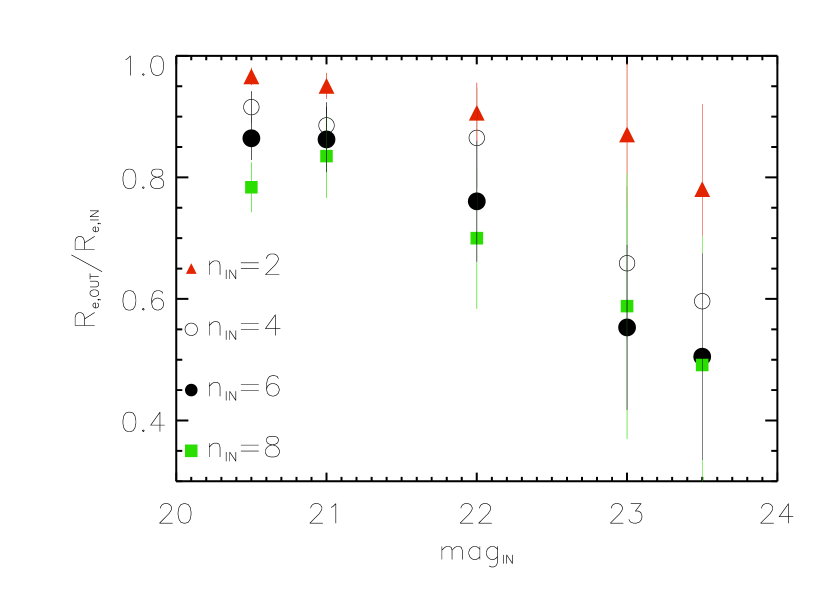
In order to understand these results and place them in the contest of previous findings we run a more general suite of simulations. We built 1200 synthetic galaxies with a much wider range of parameters: =0.2, 0.4, 0.8, 1.6, and 3.2 arcsec (corresponding to kpc at ); =2, 4, 6, and 8, and =20.5, 21, 22, 23, and 23.5. In particular, since the ACS/F814W magnitudes of the galaxies in our sample are in the range , this allowed us to explore the size-estimate dependence on the signal-to-noise ratio (S/N) over a range of S/N (here as well as below we refer to the galaxy S/N as measured within a diameter aperture).
These simulations show that the size estimates is affected by a combination of three factors: i) the S/N of the galaxy image, ii) the intrinsic galaxy size (), and iii) the profile shape (). The effects of these three factors are discussed below:
i) As expected, the brighter the simulated objects, i.e. the higher the S/N, the better the accuracy in the recovered parameters. As illustrated in Fig. 6, the fainter the input magnitude, the smaller the recovered effective radius, i.e., the stronger the underestimate of the size.
ii) For simulated galaxies with parameters and S/N similar to those of our 12 real ETGs (), the mean difference between the input and output effective radii turns out to be , with a dispersion of , with most of this systematic offset and large dispersion being due to the largest simulated objects. For the average offset is very close to zero, with a small scatter. Beyond we found that the output underestimates the input radius and the scatter increases.
iii) The size estimates depend on the capability of recovering the Sérsic index, since the best fit parameters are correlated via the and relations (Caon et al. 1993; D’Onofrio et al. 1994). Thus, for input the output values tend to be underestimated up by a factor of , and mostly for galaxies with the lowest S/N. Hence, this underestimate of is accompanied by a size underestimate, as illustrated in Fig 6. The recovered effective radius decreases with increasing index (and decreasing luminosity). Similar trends are generally found for simulated galaxies with kpc.
These experiments confirm that for objects with large effective radius and Sérsic index, as ETGs with masses of M⊙ are expected to be, with the typical S/N of our 12 ETGs (i.e. S/N) one could still substantially underestimate and . This may be due to the fact that the halos in high Sérsic-index profiles are very extended and therefore have very low surface brightness, so that they can be easily missed in the noise at high redshift given that the surface brightness scales as .
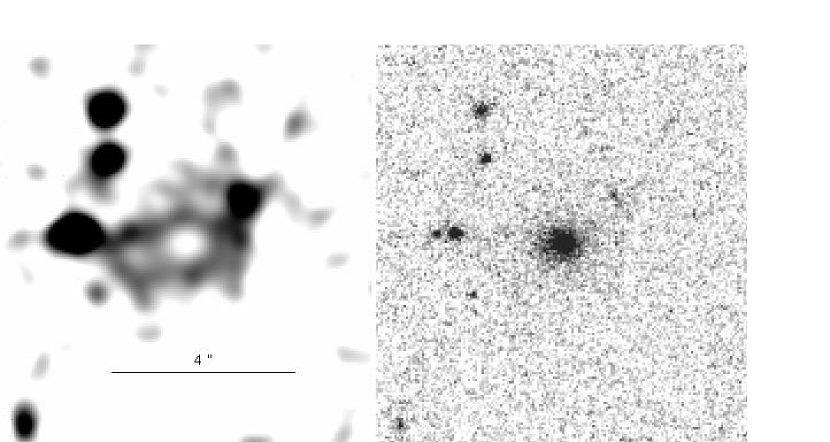
A remarkable exemplification of this situation is shown in Fig. 7 for the galaxy #136738, the most massive and K-band brightest ETG in our sample. A giant low-surface brightness halo is clearly detected, extending over some 4′′ in diameter around the galaxy (about 34 proper kpc at ), at a typical level of the order of 26 mag arcsec-2. Given the faintness of this structure, it would be obviously very easy to miss in the noise similar halos at a lower S/N ratio.
4 Discussion and Conclusions
Over the 2 square degrees COSMOS field, we have identified and studied the 12 -band brightest and most massive () ETGs at . Out of them, 9 follow the same size-mass relation of local ellipticals, and 3 appear to have smaller effective radii. However, our simulations show that their effective radius may have been underestimated by a factor of 2–3 because of their lower S/N. Hence, for the whole sample we find no compelling evidence of departures from the local size-mass relation.
Most previous studies of high- ETGs were restricted to much smaller areas, hence they may have missed the brightest/largest ETGs similar to those reported here, as their surface number density is very low, i.e., deg-2 to the limiting magnitude of the present sample. Using the redshift range to estimate the cosmological volume, this corresponds to a space density of Mpc-3. This is roughly 10% of the space density of local ETGs selected with . It is not clear if the different results of the present work compared to previous studies of high- ETGs are due to the galaxies in our sample being much more massive than those in most previous works. Combining the results of our 12 massive ETGs with the literature results –so to span a wide range of masses (2 dex)– we note that the departure of ETGs at from the size-mass relation seems to be differential with mass, with being on average close to 1 for the most massive systems, and for lower masses. This is reminiscent of the general downsizing scenario, whereby massive ETGs formed their stars and assembled their mass more rapidly and at higher redshifts compared to the less massive ones. Thus, the present results may extend the downsizing effect to the internal structure of ETGs, with the most massive ETGs reaching their internal and dynamical structure earlier and faster than lower mass ETGs at the same redshift.
However, we also argue that bias in the galaxy profile fitting could significantly affect the size measurements, as low-surface brightness halos could remain undetected in high redshift ellipticals if observed with low S/N ratios (e.g., Fig. 7). Based on redshifted mock images of local systems, Hopkins et al. (2009) also concluded that there is a tendency to underestimate the galaxy size which is more pronounced in the most massive galaxies, due to their large and . This is in agreement with the results of our simulations. They also stressed that elliptical galaxy profiles are not perfectly “Sérsic”, which would contribute to the size underestimate at high redshift.
Thanks to the exceptional brightness of our 12 ETGs, their S/N ratios in the single-orbit COSMOS -band images are among the highest reached by HST+ACS imaging of high- ETGs, and are comparable to those obtained by Daddi et al. (2005) for s in the extremely deep HUDF images. On average, their S/N ratio is also times higher than that of galaxies in the GMASS study, which used GOODS-S -band data (Cimatti et al. 2008). Hence, it is possible that also in these studies the effect of the noise has led to underestimate the size of some object by a factor of 2 or 3. Cimatti et al. (2008) used simulated objects to check the reliability of their derived effective radii, and estimated an average scatter on the galaxy size measurements of , with no strong bias. This suggests that a size underestimate is unlikely to account for the small size obtained for the bulk of the GMASS high- ETGs. Still, the parameter space (, , S/N) explored in the simulations of Cimatti et al. (2008) may not fully include that occupied by the real GMASS galaxies, hence we cannot exclude that also in this study the size of some of the intrinsically largest galaxies may have been underestimated by more than a 20%.
On the other hand, some studies using -band (F160W) NICMOS-2 imaging (e.g. Longhetti et al. 2007; van Dokkum et al. 2008) have also reached high S/N ratios, thanks to them sampling longer rest-frame wavelengths where the flux of ETGs is much stronger than in the near-UV. Using the NICMOS Exposure Time Calculator (ETC), we estimated that the S/N ratios of galaxies in Longhetti et al. (2007) and van Dokkum et al. (2008) were on average quite comparable, or sometimes even slightly higher than the ones obtained for our COSMOS ETG sample. The masses of ETGs in the former study (open triangles in Fig. 4) are similar to those of our galaxies, and yet the derived effective radii are up to 3 times smaller than those of local ellipticals with similar masses. Based on simulations, the authors argued that their typical image resolution and S/N led to underestimate by the effective radii of galaxies with an intrinsic and radii in the range of kpc, and took into account this result in their galaxy size estimate. However, they did not verify the robustness of their fitting procedure in recovering the light profiles of galaxies with kpc and , typical of such extremely massive ETGs ( M⊙), which we found instead to be affected by a substantial bias.
Similarly, van Dokkum et al. (2008) found their ETGs 5 times smaller compared to local ETGs of similar mass. However, their stellar masses were estimated using the stellar population models of Bruzual & Charlot (2003) that do not include stars in their TP-AGB phase, and therefore stellar masses of ETGs at might have been overestimated by a factor (Maraston et al. 2006), while the TP-AGB effect is negligible for local ETGs. In the size-mass diagram, this mass re-scaling would reduce by times the average offset in size with respect to the local relation (as shown in Fig. 4). Moreover, allowing for a systematic underestimate of the size of the galaxies with lower S/N, similar to the one found by Longhetti et al. (2007) for lower-redshift ETGs in NIC2 images, we conclude that some galaxy in the study of van Dokkum et al. (2008) may actually follow the local size-mass relation.
Saracco et al. (2009) collected 32 high-redshift ETGs with archival NICMOS data, among which 13 have given size comparable to the local galaxies and the others are more than 1 smaller compared to the local relation. Also in this case, based on the above arguments, we cannot exclude that the size of the galaxies with lower S/N and lower resolution (those observed only with NICMOS-3) may have been underestimated. However, the authors suggested an age-dependent evolution, with the young ETGs (mean stellar age Gyr) being more similar to their local counterparts, and the old ETGs being denser. Our results cannot confirm such claim, as our best-fit ages are all confined within a very narrow range (see Table 1).
A potentially powerful test of the reliability of the size estimates of high- ETGs consists in measuring their velocity dispersion , which would allow us to check for the consistency of the three quantities entering the virial relation: , with the constraint of the stellar mass being less than the dynamical mass. Due to the limits of the present-day telescopes, the low S/N of the available spectra of ETGs at allowed only a few attempts in this direction, most of which based on the analysis of average stacked spectra of several objects (Cenarro & Trujillo 2009; Cappellari et al. 2009). Both these attempts are based on the GMASS sample of spectra (Cimatti et al. 2008), and within the errors found agreement between stellar and dynamical masses. However, Cappellari et al. (2009) found a trend to underestimate the virial masses () on average by %, that may be ascribed to a size underestimate by a similar quantity. Thanks to a S/N ratio of their spectra, Cappellari et al. also measured the from the individual spectra of two of the galaxies with the largest size in the GMASS sample (whose sizes are consistent with those of local ETGs). The resulting agreement with the masses and sizes previously estimated by Cimatti et al. (2008) confirmed that these two objects are truly similar to local ETGs, as most of the ETGs in our sample. Most recently, van Dokkum et al. (2009) analysed the near-IR spectrum of an ETG at finding a very high velocity dispersion ( km/s), consistent with the small size measured for this object, which then suggests a strong structural/dynamical evolution from to 0 for similarly massive ETGs. Yet, the relatively low S/N of the near-IR spectrum implies a fairly large uncertainty in the measured . Recently some among us were able to obtain a good S/N near-IR spectrum of one of our 12 ETGs (object # 254025) with the MOIRCS spectrograph at the SUBARU telescope, and a measurement of will be attempted (M. Onodera et al. in preparation).
We conclude that the fraction of high-redshift ETGs which are genuinely undersized with respect to local ETGs is still poorly known. Several massive ETGs at high redshift (certainly the majority in our sample) are as large as their local counterparts, and therefore recipes aimed at inflating putative small ETGs should avoid to create oversize ETGs at low redshifts out of those having already reached their final size at . We also hint at a possible downsizing effect not only on stellar ages and mass assembly, but also on the structural properties of these galaxies, with the most massive ETGs being in all respects the first to reach their final configuration.
Acknowledgements
We wish to thank Swara Ravindranath and Paolo Cassata for useful discussions. This work has been supported by grants ASI/COFIS/WP3110+WP3400 I/026/07/0. CM, ED, FS, HJMCC, and MO acknowledge funding support of French ANR under contracts ANR-07-BLAN-0228 and ANR-08-JCJC-0008, and CM thanks CEA Saclay for hospitality and funding at the beginning of this work.
References
- Bernardi (2009) Bernardi M., 2009, arXiv0901.1318
- Bertin & Arnouts (1996) Bertin E., Arnouts S., 1996, A&AS, 117, 393
- Bolzonella et al. (2000) Bolzonella M., Miralles J.-M., Pelló R., 2000, A&A, 363, 476
- Bruzual & Charlot (2003) Bruzual G., Charlot S., 2003, MNRAS, 344, 1000
- Buitrago et al. (2008) Buitrago F., Trujillo I., Conselice C. J., Bouwens R. J., Dickinson M., Yan H., 2008, ApJ, 687, L61
- Caon et al. (1993) Caon N., Capaccioli M., D’Onofrio M., 1993, MNRAS, 265, 1013
- Cappellari et al. (2009) Cappellari M., di Serego Alighieri S., Cimatti A., Daddi E., Renzini A., Kurk J. D., Cassata P., Dickinson M., Franceschini A., Mignoli M., Pozzetti L., Rodighiero G., Rosati P., Zamorani G., 2009, ApJ, in press (ArXiv:0906.3648)
- Cenarro & Trujillo (2009) Cenarro A. J., Trujillo I., 2009, ApJ, 696, L43
- Chabrier (2003) Chabrier G., 2003, PASP, 115, 763
- Cimatti et al. (2008) Cimatti A., Cassata P., Pozzetti L. et al. 2008, A&A, 482, 21
- Cimatti et al. (2004) Cimatti A., Daddi E., Renzini A. et al. 2004, Nature, 430, 184
- Daddi et al. (2004) Daddi E., Cimatti A., Renzini A. et al. 2004, ApJ, 600, L127
- Daddi et al. (2007) Daddi E., Dickinson M., Morrison G. et al. 2007, ApJ, 670, 156
- Daddi et al. (2005) Daddi E., Renzini A., Pirzkal N. et al. 2005, ApJ, 626, 680
- Damjanov et al. (2009) Damjanov I., McCarthy P. J., Abraham R. G. et al. 2009, ApJ, 695, 101
- D’Onofrio et al. (1994) D’Onofrio M., Capaccioli M., Caon N., 1994, MNRAS, 271, 523
- Fan et al. (2008) Fan L., Lapi A., De Zotti G., Danese L., 2008, ApJ, 689, L101
- Glazebrook et al. (2004) Glazebrook K., Abraham R. G., McCarthy P. J. et al. 2004, Nature, 430, 181
- Hopkins et al. (2009) Hopkins P. F., Bundy K., Murray N., Quataert E., Lauer T., Ma C.-P., 2009, ArXiv e-prints
- Ilbert et al. (2009) Ilbert O., Capak P., Salvato M. et al. 2009, ApJ, 690, 1236
- Khochfar & Silk (2006) Khochfar S., Silk J., 2006, ApJ, 648, L21
- Koekemoer et al. (2007) Koekemoer A. M., Aussel H., Calzetti D. et al. 2007, ApJS, 172, 196
- Krist & Hook (2004) Krist J., Hook R., 2004, The TINY TIM User’s guide. Available online, (www.stsci.edu/software/tinytim/tinytim.pdf)
- La Barbera et al. (2009) La Barbera F., de Carvalho R. R., de la Rosa I. G., Sorrentino G., Gal R. R., Kohl-Moreira J. L., 2009, AJ, 137, 3942
- Lejeune et al. (1997) Lejeune T., Cuisinier F., Buser R., 1997, A&AS, 125, 229
- Longhetti et al. (2007) Longhetti M., Saracco P., Severgnini P. et al. 2007, MNRAS, 374, 614
- Maraston (2005) Maraston C., 2005, MNRAS, 362, 799
- Maraston et al. (2006) Maraston C., Daddi E., Renzini A., Cimatti A., Dickinson M., Papovich C., Pasquali A., Pirzkal N., 2006, ApJ, 652, 85
- McGrath et al. (2008) McGrath E. J., Stockton A., Canalizo G., Iye M., Maihara T., 2008, ApJ, 682, 303
- Naab et al. (2007) Naab T., Johansson P. H., Ostriker J. P., Efstathiou G., 2007, ApJ, 658, 710
- Peng et al. (2002) Peng C. Y., Ho L. C., Impey C. D., Rix H.-W., 2002, AJ, 124, 266
- Rettura et al. (2008) Rettura A., Rosati P., Nonino M., Fosbury R. A. E., Gobat R., Menci N., Strazzullo V., Mei S., Demarco R., Ford H. C., 2008, ArXiv e-prints
- Sanders et al. (2007) Sanders D. B., Salvato M., Aussel H. et al. 2007, ApJS, 172, 86
- Saracco et al. (2009) Saracco P., Longhetti M., Andreon S., 2009, MNRAS, 392, 718
- Sersic (1968) Sersic J. L., 1968, Atlas de galaxias australes. Cordoba, Argentina: Observatorio Astronomico, 1968
- Shen et al. (2003) Shen S., Mo H. J., White S. D. M., Blanton M. R., Kauffmann G., Voges W., Brinkmann J., Csabai I., 2003, MNRAS, 343, 978
- Tacconi et al. (2008) Tacconi L. J., Genzel R., Smail I. et al. 2008, ApJ, 680, 246
- Toft et al. (2007) Toft S., van Dokkum P., Franx M. et al. 2007, ApJ, 671, 285
- Trujillo et al. (2009) Trujillo I., Cenarro A. J., de Lorenzo-Cáceres A., Vazdekis A., de la Rosa I. G., Cava A., 2009, ApJ, 692, L118
- Trujillo et al. (2007) Trujillo I., Conselice C. J., Bundy K., Cooper M. C., Eisenhardt P., Ellis R. S., 2007, MNRAS, 382, 109
- Trujillo et al. (2006) Trujillo I., Förster Schreiber N. M., Rudnick G. et al. 2006, ApJ, 650, 18
- van der Wel et al. (2008) van der Wel A., Holden B. P., Zirm A. W., Franx M., Rettura A., Illingworth G. D., Ford H. C., 2008, ApJ, 688, 48
- van Dokkum et al. (2008) van Dokkum P. G., Franx M., Kriek M. et al. 2008, ApJ, 677, L5
- van Dokkum et al. (2009) van Dokkum P. G., Kriek M., Franx M., 2009, ArXiv e-prints
- Zirm et al. (2007) Zirm A. W., van der Wel A., Franx M. et al. 2007, ApJ, 656, 66