Heating and Cooling in Clusters and Groups
Abstract
The gas in the cores of many clusters and groups of galaxies has a short radiative cooling time. Energy from the central black hole is observed to flow into this gas by means of jets, bubbles and sound waves. Cooling is thus offset by heating. We discuss the mechanisms involved and observed in the X-ray brightest clusters and explore the closeness of the heating/cooling balance. It is surprisingly tight on the cooling side when soft X-ray spectra are examined. Non-radiative cooling by mixing is suggested as a means to relax the apparent strong lack of cooling. Nevertheless the heating and cooling must balance on average to better than 20 per cent.
Keywords:
cooling flows - X-rays:galaxies:galaxy clusters:
98.65Cw, 98.65Hb1 Introduction
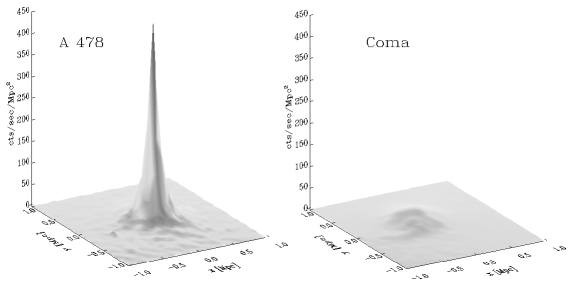
The hot gas in the cores of more than one third of clusters of galaxies, and most elliptical-rich groups of galaxies, has a radiative cooling time shorter than about 3 Gyr. This is significantly less than the age of these systems, so the gas would develop into a cooling flow in the absence of additional heating (Fabian, 1994). X-ray observations show that the central gas temperature drops and the density consequently rises (Fig. 1), as expected in a cooling flow, but the temperature does not drop completely. (They are therefore known as cool-core clusters.) The likely explanation is that the active nucleus of the central galaxy injects energy into its surroundings which offsets cooling. The activity is evident in jets seen in radio observations and bubbles inflated by the jets seen in X-ray images (for reviews see Peterson and Fabian (2006); McNamara and Nulsen (2007)).
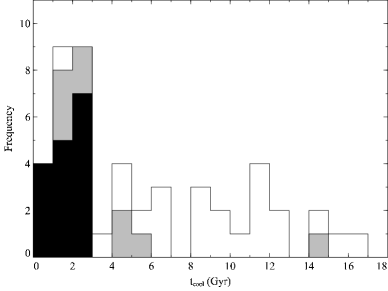
A study of a small complete sample of clusters by Dunn and Fabian (2006) shows that 90 per cent of those with a central cooling time less than 3 Gyr have a central radio source and 70 per cent have a bubbles associated with that source (Fig. 2). In other words, where cooling is proceeding most rapidly then there is a high probability that energy is being injected. Moreover, the duty cycle of this activity is high, between 70 and 90 per cent.
The power required by the heat source ranges to above in the most extreme cases, but is more typically for a cluster and for a group. The energy in a bubble of relativistic gas with volume is , where is the surrounding pressure, and the buoyancy time, which is the time taken to fill the bubble, is comparable to the sound crossing time of the bubble. The power can then be obtained from the X-ray data, yielding estimates which in most cases are comparable to the cooling rate of the surrounding cool core Bîrzan et al. (2004); Dunn et al. (2005); Rafferty et al. (2006). The bubbles demonstrate that jets transport considerable energy in a radiatively inefficient manner, with less than 0.1 to 0.01 per cent of the power emerging as radiation.
The right amount of energy is being injected, so energy is not a problem, but how does it get distributed? How close is the heating/cooling balance? Observations suggest that it is better than 10 per cent in some objects. How does such tight feedback work? Particularly when the wide range of timescales involved from several Gyr down to less than for the coolest gas seen below 1 keV is considered. We see no gas at all in the X-ray band at temperatures below 5 million K, how is the gas immediately hotter than this prevented from cooling? To examine these issues we use the best X-ray data from the brightest clusters.
2 Distributing the energy
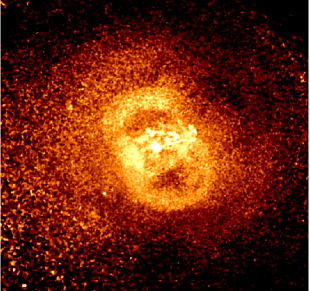
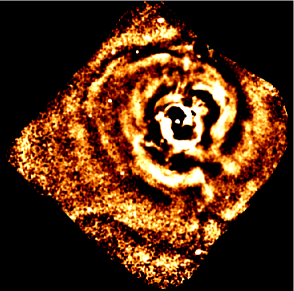
The X-ray brightest cool-core cluster, the Perseus cluster, also has the deepest Chandra exposure of nearly 1Ms, with about 70 million photons contributing to the image. It shows clear high pressure shells around the two radio bubbles (Fig. 3) and at least two buoyant outer bubbles (Fabian et al., 2006). There are weak shocks (Mach number 1.3) at the edge of the shells which presumably propagate outward developing into sound waves. Such sound waves explain the sequence of ripples seen in the X-ray surface brightness image (Fabian et al. (2003), Sanders and Fabian (2007), Fig. 3). There should be at least one sound wave per bubble inflation/buoyant rise cycle; large fluctuations in the jet power could lead to more.
The energy flux in the sound waves is seen to be close to that required to counterbalance the radiative cooling. Thus provided the sound energy is dissipated in the gas, we are seeing a mechanism which converts the directional jet energy into a quasi-isotropic heat source. Dissipation depends on viscosity, which is difficult to estimate in the intracluster medium. This is because the gas is magnetized, probably in a tangled manner. A bulk viscosity may result if the application of pressure changes the magnetic configuration. Otherwise the maximum shear viscosity is the Spitzer-Braginsky value (which is high) with the true value reduced by the magnetic fields.
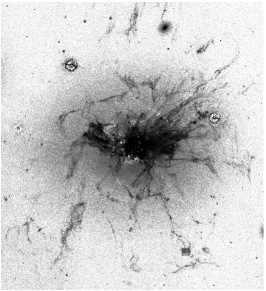
Several observational clues argue that the viscosity may be high. The quasi-linear nature of the H optical emission filaments seen around the central galaxy of the Perseus cluster, NGC 1275, and the Brightest Cluster Galaxies (BCGs) of many other cool-core clusters (Fig. 4) suggest that the gas is not highly turbulent. The SW X-ray plume seen near M87 has a very sharp edge, again showing that flows in the gas must be quasi-laminar and not chaotic. Estimates of the outward diffusion rates of the iron-rich gas around BCGs (Rebusco et al., 2005; Graham et al., 2006) also argue that motions are relatively quiet, and thus that the gas may be viscous.
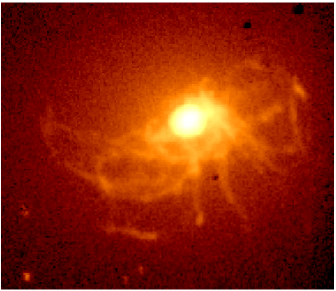
Although the sound waves seen in the Perseus cluster diminish with radius out to 100 kpc, consistent with energy being dissipated, outer ripples appear stronger. This could be due to the central source having been a few times more energetic a few 100 Myr ago. This would also explain the very long (50 kpc) Northern H filaments, if they were dragged out by rising bubbles at that time.
Ripples and weak shocks are also found in the Virgo (Forman et al., 2007), Centaurus (Sanders and Fabian, 2008) and A2052 (Blanton, this meeting) clusters, all of which are X-ray bright and have deep Chandra data. They will be difficult to see in general without very good data (Graham et al., 2008). Nevertheless they appear to be a major channel by which energy from the black hole is distributed in clusters and groups.
3 Cooler gas
We can address the issue of the tightness of feedback by looking for evidence of overheating or underheating. If too much energy is injected then we might expect evidence for strong turbulence or heating. Some non-cool core clusters may have resulted from this (e.g. Donahue et al. (2005); O’Sullivan et al. (2005)). We can say that it is not common but it is unclear what we would look for. If jets become more powerful then they can turn into FR II sources with energetic hotspots at the end of rapidly-extending long jets, such as seen in Cyg A and 3C295. Both of these objects are in cool core clusters. Their hotspots are expected to rapidly pass beyond the inner region where heat is needed. They may then be relatively inefficient in heating most of the core gas (i.e. that not along the jet direction). MS 0735.6 is a good example where a very energetic event, or sequence of events, has dumped most of the energy well beyond the core (McNamara et al., 2009).
The luminous quasar H1821+643 lies at the centre of a rich cluster. Chandra imaging shows little impact of such powerful fuelling of the black hole on the gas in the core beyond 20 kpc (Russell et al, submitted).
If too little energy is supplied then radiative cooling ensues and we can expect to accumulate cold gas and possibly have star formation. Considerable cold gas is associated with many cool core cluster BCGs, mostly in the form of molecular gas (Edge, 2001; Salomé et al., 2006). The filaments of Perseus (Fig. 4) are mostly molecular, even the outer ones (Hatch et al., 2006; Salomé et al., 2006), with a total mass of about . A plausible scenario for the origin of the filaments is that they are due to cooled gas, enriched by stellar mass loss (including dust), which is then dragged out beneath buoyantly-rising bubbles.
The filaments are very thin and likely magnetized (Fabian et al., 2008). They are quite luminous and have a lowly-ionized spectrum which can be explained by heating by particles, either low-energy cosmic rays within the filaments themselves perhaps energised by their motion, or by the outside hot gas (Ferland et al., 2009).
Star formation is common in such BCGs (O’Dea et al. (2008) and refs therein) with, for example, A1835 showing the highest star formation rate for an early-type system in the low redshift universe. The star formation rate is however only about 10 per cent of what could result if a steady-state cooling flow took place without any heating.
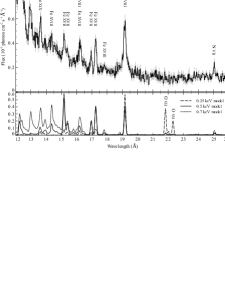
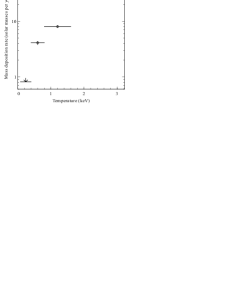
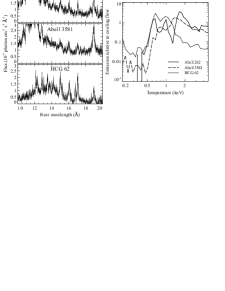
We have been using spectra from the XMM Reflection Grating Spectrometer to quantify the amount of gas cooling below 10 million K in a number of groups and clusters. For the Centaurus cluster we see clear evidence of gas down to about 4 MK but not below that temperature (Fig. 5; Sanders et al. (2008)), with similar results for some groups (Fig. 6, Sanders 2009 submitted). A similar conclusion has been obtained on M87 by Werner et al. (2006). No group or cluster shows clear evidence for gas cooling below that temperature. In particular, no OVII emission is seen (as expected from gas at say 3 MK), although the constraint does not rely just on that species.
The limit on cooling in the Centaurus cluster is so stringent (Fig. 5, right) that one could conclude that the heating/cooling balance is kept to within a few per cent. (The abundance gradient mentioned earlier restricts any overheating.)
The coolest gas () in the Centaurus cluster seen in the Chandra image is clumpy. It is also the most rapidly cooling gas with a cooling time of only . If heating explains the lack of yet cooler X-ray emitting gas, then it must be very selectively targeted by the heat source. An alternative is that the coolest gas does cool, but non-radiatively. It cools by mixing with the cold filamentary gas which is distributed over the same inner, few kpc, region. Most of the thermal energy of the hotter gas is then eventually radiated in the infrared band by dust and molecular emission (Fabian et al. (2002), Soker et al. (2004)).
This relaxes the balance to be within 10 to 20 per cent, with the constraints on cold gas and star formation (which may be sporadic) becoming crucial.
Although the radio source is undoubtedly variable on short timescales (3C 84 in NGC 1275 has varied considerably over the past 50yr), the heating/cooling balance remains fairly tight on timescales longer than and must be long lived (several Gyr) in most objects. This means it lasts over tens to hundreds of bubble cycles. Quite how this is achieved is unclear, especially when the large range of distances involved in the feedback cycle is considered. For a billion solar mass black hole the event horizon (near which most of the energy is released) is about , the Bondi accretion radius (which may control the black hole accretion rate) may be 30 pc, the gas below 1 keV is mostly within a few kpc and the cooling radius (where the radiative cooling time of the gas is say 7 Gyr) may be 100 kpc. Angular momentum should spoil any simple feedback loop, introducing an uncertain and possibly long delay. Perhaps this can be overcome if the gas is really viscous, transporting the angular momentum outward?
In summary, the mechanisms by which energy is fed back into the intracluster medium from a central black hole are observed. A close heating/cooling balance has been set up which is not fully understood. There remains the possibility, however, that there is continuous mild overheating, where the balance is tipped slightly towards heating.
References
- Fabian (1994) A. C. Fabian, ARA&A 32, 277–318 (1994).
- Peterson and Fabian (2006) J. R. Peterson, and A. C. Fabian, Phys. Rep. 427, 1–39 (2006).
- McNamara and Nulsen (2007) B. R. McNamara, and P. E. J. Nulsen, ARA&A 45, 117–175 (2007).
- Dunn and Fabian (2006) R. J. H. Dunn, and A. C. Fabian, MNRAS 373, 959–971 (2006).
- Bîrzan et al. (2004) L. Bîrzan, D. A. Rafferty, B. R. McNamara, M. W. Wise, and P. E. J. Nulsen, ApJ 607, 800–809 (2004).
- Dunn et al. (2005) R. J. H. Dunn, A. C. Fabian, and G. B. Taylor, MNRAS 364, 1343–1353 (2005).
- Rafferty et al. (2006) D. A. Rafferty, B. R. McNamara, P. E. J. Nulsen, and M. W. Wise, ApJ 652, 216–231 (2006).
- Fabian et al. (2006) A. C. Fabian, J. S. Sanders, G. B. Taylor, S. W. Allen, C. S. Crawford, R. M. Johnstone, and K. Iwasawa, MNRAS 366, 417–428 (2006).
- Fabian et al. (2003) A. C. Fabian, J. S. Sanders, S. W. Allen, C. S. Crawford, K. Iwasawa, R. M. Johnstone, R. W. Schmidt, and G. B. Taylor, MNRAS 344, L43–L47 (2003).
- Sanders and Fabian (2007) J. S. Sanders, and A. C. Fabian, MNRAS 381, 1381–1399 (2007).
- Rebusco et al. (2005) P. Rebusco, E. Churazov, H. Böhringer, and W. Forman, MNRAS 359, 1041–1048 (2005).
- Graham et al. (2006) J. Graham, A. C. Fabian, J. S. Sanders, and R. G. Morris, MNRAS 368, 1369–1376 (2006).
- Fabian et al. (2008) A. C. Fabian, R. M. Johnstone, J. S. Sanders, C. J. Conselice, J. S. I. C. S. Crawford, Gallagher, and E. Zweibel, Nature 454, 968–970 (2008).
- Crawford et al. (2005) C. S. Crawford, N. A. Hatch, A. C. Fabian, and J. S. Sanders, MNRAS 363, 216–222 (2005).
- Forman et al. (2007) W. Forman, C. Jones, E. Churazov, M. Markevitch, P. Nulsen, A. Vikhlinin, M. Begelman, H. Böhringer, J. Eilek, S. Heinz, R. Kraft, F. Owen, and M. Pahre, ApJ 665, 1057–1066 (2007).
- Sanders and Fabian (2008) J. S. Sanders, and A. C. Fabian, MNRAS 390, L93–L97 (2008).
- Graham et al. (2008) J. Graham, A. C. Fabian, and J. S. Sanders, MNRAS 391, 1749–1757 (2008).
- Donahue et al. (2005) M. Donahue, G. M. Voit, C. P. O’Dea, S. A. Baum, and W. B. Sparks, ApJ 630, L13–L16 (2005), arXiv:astro-ph/0508587.
- O’Sullivan et al. (2005) E. O’Sullivan, J. M. Vrtilek, J. C. Kempner, L. P. David, and J. C. Houck, MNRAS 357, 1134–1150 (2005).
- McNamara et al. (2009) B. R. McNamara, F. Kazemzadeh, D. A. Rafferty, L. Bîrzan, P. E. J. Nulsen, C. C. Kirkpatrick, and M. W. Wise, ApJ 698, 594–605 (2009).
- Edge (2001) A. C. Edge, MNRAS 328, 762–782 (2001).
- Salomé et al. (2006) P. Salomé, F. Combes, A. C. Edge, C. Crawford, M. Erlund, A. C. Fabian, N. A. Hatch, R. M. Johnstone, J. S. Sanders, and R. J. Wilman, A&A 454, 437–445 (2006).
- Hatch et al. (2006) N. A. Hatch, C. S. Crawford, R. M. Johnstone, and A. C. Fabian, MNRAS 367, 433–448 (2006).
- Ferland et al. (2009) G. J. Ferland, A. C. Fabian, N. A. Hatch, R. M. Johnstone, R. L. Porter, P. A. M. van Hoof, and R. J. R. Williams, MNRAS 392, 1475–1502 (2009).
- O’Dea et al. (2008) C. P. O’Dea, S. A. Baum, G. Privon, J. Noel-Storr, A. C. Quillen, N. Zufelt, J. Park, A. Edge, H. Russell, A. C. Fabian, M. Donahue, C. L. Sarazin, B. McNamara, J. N. Bregman, and E. Egami, ApJ 681, 1035–1045 (2008).
- Sanders et al. (2008) J. S. Sanders, A. C. Fabian, S. W. Allen, R. G. Morris, J. Graham, and R. M. Johnstone, MNRAS 385, 1186–1200 (2008).
- Werner et al. (2006) N. Werner, J. de Plaa, J. S. Kaastra, J. Vink, J. A. M. Bleeker, T. Tamura, J. R. Peterson, and F. Verbunt, A&A 449, 475–491 (2006).
- Fabian et al. (2002) A. C. Fabian, S. W. Allen, C. S. Crawford, R. M. Johnstone, R. G. Morris, J. S. Sanders, and R. W. Schmidt, MNRAS 332, L50–L54 (2002).
- Soker et al. (2004) N. Soker, E. L. Blanton, and C. L. Sarazin, A&A 422, 445–452 (2004).