Vol. 8 (2008), No. 1, 1–11
11institutetext: Center for Astrophysics, University of Science and
Technology of China, Hefei 230026; xkong@ustc.edu.cn
22institutetext: Joint Institute for Galaxy and Cosmology (JOINGC) of SHAO and
USTC
33institutetext: National Astronomical Observatories, Chinese Academy of
Sciences, Beijing 100012, China
\vs\noReceived 2007 April 12; accepted 2007 May 16
Star-Forming Galaxies at in the Hubble Ultra Deep Field ∗ 00footnotetext: Supported by the National Natural Science Foundation of China.
Abstract
Using a simple color selection based on -, - and -band photometry, , we picked out 52 star-forming galaxies at (sBzKs) from a -band selected sample () in an area of arcmin2 of the Hubble Ultra Deep Field (UDF). We develop a new photometric redshift method, and the error in our photometric redshifts is less than . From the photometric redshift distribution, we find the color criterion can be used to select star-forming galaxies at with . Down to , the number counts of sBzKs increase linearly with the magnitude; the sBzKs are strongly clustered, and most of them have irregular morphologies on the ACS images. They have a median reddening of , an average star formation rate of yr-1 and a typical stellar mass of . The UV criterion for the galaxies at can select most of the faint sBzKs in the UDF, but it does not work well for bright, massive, highly-reddened, actively star-forming galaxies.
keywords:
galaxies: evolution —galaxies: high-redshift — galaxies: photometry — cosmology: observations1 Introduction
A number of observations suggest that the era of is important in galaxy evolution for various reasons: the cosmic star formation rate begins to drop at from a flat plateau at higher redshifts; the morphological type mix of field galaxies changes remarkably at ; the number density of QSOs has a peak at (Dickinson et al.2003; Fontana et al.2003; Steidel et al.2004; Kong et al.2006; Richards et al.2006). However, galaxies in the redshift interval have been called the “redshift desert” by some researchers because, to date, we lack the tools to pick out dim galaxies in that range.
Recently, Steidel’s group has extended the UV technique for selecting LBGs (Lyman Break Galaxies) to using a color-color diagram which isolates star-forming galaxies at (Erb et al.2003; Steidel et al.2004; Adelberger et al.2004). However, star-forming galaxies can be selected as LBGs only if they are UV bright (i.e. actively star forming) and not heavily reddened by dust. Using the highly complete spectroscopic redshift database of the K20 survey, Daddi et al.(2004) introduced a new criterion, , in the -, - and -band photometry, for obtaining a virtually complete sample of star-forming galaxies in the redshift range (for convenience, we use the term sBzKs for the galaxies selected in this way). This criterion is reddening independent for star-forming galaxies in the selected redshift range, thus can be used to select the reddest dust-extinguished galaxies. This should allow a relatively unbiased selection of star-forming galaxies at within the magnitude limit of the sample studied.
Based on photometry obtained by combining Subaru optical and ESO near-IR data over two separate fields and using the selection technique, Kong et al.(2006) has obtained complete samples of candidate sBzKs which were identified over an area of arcmin2 to , of which 320 arcmin2 are complete to . Using HST/ACS- (F814W), Subaru-, CFHT- and KPNO/CTIO- data, Renzini et al.(2008) has selected sBzKs over an area of arcmin2 to in the COSMOS survey (Scoville et al.2007). The surface density, number counts, clustering, reddening, star formation rates (SFRs) and stellar masses () of these bright sBzKs ( or ) were analyzed in these papers. To select faint sBzKs and study their properties, deep infrared images are required. The Hubble Ultra Deep Field (UDF) provides us with the deepest view to date of the visible universe. In this paper, we will use the space-based and ground-based UDF data to select a faint sBzKs sample (down to ) to study the properties of faint sBzKs, and compare the differences between faint and bright sBzKs.
This paper is organized as follows. Section 2 describes the UDF observations and the method for obtaining the photometric catalog. Section 3 describes the calculation and calibration of photometric redshifts. Section 4 presents the selection, morphologies, number counts, clustering and physical properties of sBzKs. Section 5 compares the samples selected with the technique to those UV-selected galaxies at . Finally, a brief summary is presented in Section 6. For the sake of comparison with previous works, magnitudes and colors in both AB and Vega systems had to be used.
2 UDF Overview
The UDF (RA=, Dec=, J2000) is located within one of the best studied areas of the sky: the Chandra Deep Field South (CDF-S or GOODS-South region). With a total of 544 orbits, it is one of the largest time allocations with HST, and indeed the filter coverage, depth, and exquisite quality of the UDF ACS and NICMOS images provide an unprecedented data set for the study of galaxy evolution. The field has been imaged by a large number of telescopes at a variety of wavelengths. In this paper, three sources of imaging data and the VLT/FORS2 spectroscopic data for this field are used.
2.1 Observations
The UDF is a public survey of a single Advanced Camera Survey (ACS) wide field camera (WFC) field (11.5 arcmin2) in 4 broad-band filters: F435W (), F606W (), F775W () and F850LP () (Beckwith et al.2006). For our analysis we use the reduced UDF data v1.0 made public by the Space Telescope Science Institute on 09 March 2004. The 10- limiting magnitudes at -band, -band, -band and -band are 28.7, 29.0, 29.0 and 28.4, respectively, in an aperture of 0.2 arcsec2.
We also use the HST/NICMOS (Near-Infrared Camera and Multi-Object Spectrometer) UDF photometry data for our analysis, which were taken with NICMOS under the HST Cycle 12 Treasury Program in two bands, F110W and F160W, which roughly correspond to and . Due to the small field of NICMOS camera, the NICMOS UDF only covers a part (5.76 arcmin2) of the optical UDF. The data reduction and photometry were introduced by Thompson et al.(2005). The 5- limiting AB magnitude is 27.7 at 1.1 and 1.6 m in a 0.6′′ diameter aperture.
Ground-based near-infrared images () of the UDF were taken as part of the GOODS survey with ISAAC on the VLT. These data were obtained as part of the ESO Large Programme LP168.A-0485(A), and GOODS/ISAAC Data Release Version 1.5 was used for our analysis. This data release includes 24 fully reduced VLT/ISAAC fields in and bands covering 159.1 and 159.7 arcmin2 of the GOODS region, respectively, and 19 fields in band covering 126.7 arcmin2. The ISAAC data were reduced using an improved version of the ESO/MVM image processing pipeline. The 5- limiting AB magnitudes at -band, -band and -band are 25.3, 24.8 and 24.4, in a 2.0′′ diameter aperture.
A catalog of objects whose redshifts are known from spectroscopic observations is very important to the construction of a photometric redshift code. For this reason, the GOODS multi-object, optical to NIR spectroscopy in CDF-S was used for our analysis (Version 2.0, 24 December 2005), with the FORS2 on the VLT. We obtained 1204 spectra of 930 individual targets, providing in total 943 redshift measurements with quality flag A, B or C (A=solid redshift, B=likely redshift, C=potential redshift). Of the targets 725 have an assigned redshift with quality flag A, B or C. A full description of the survey can be found in Vanzella et al.(2005). Forty-eight of the targets are located in the UDF, of which 23 have quality flag “A” and 10 have quality flag “B”.
2.2 Image Resampling
All of these data have been released in fully processed form, and no additional processing is necessary. However, the images in different data sets have different scales and sizes, so they must be resampled in order to put on the same astrometric grid. The resampling was done with IRAF’s and tasks. The NICMOS image was used as the base image to which all the other images were matched. The NICMOS image need no remapping as it was already on the same scale. The optical images from the HST/ACS and the near-infrared images from VLT/ISAAC were remapped. This changed their scales from 0.03 and 0.15 to 0.09 ′′ pixel-1. The resampling does not introduce any appreciable shifts in either the position or flux.
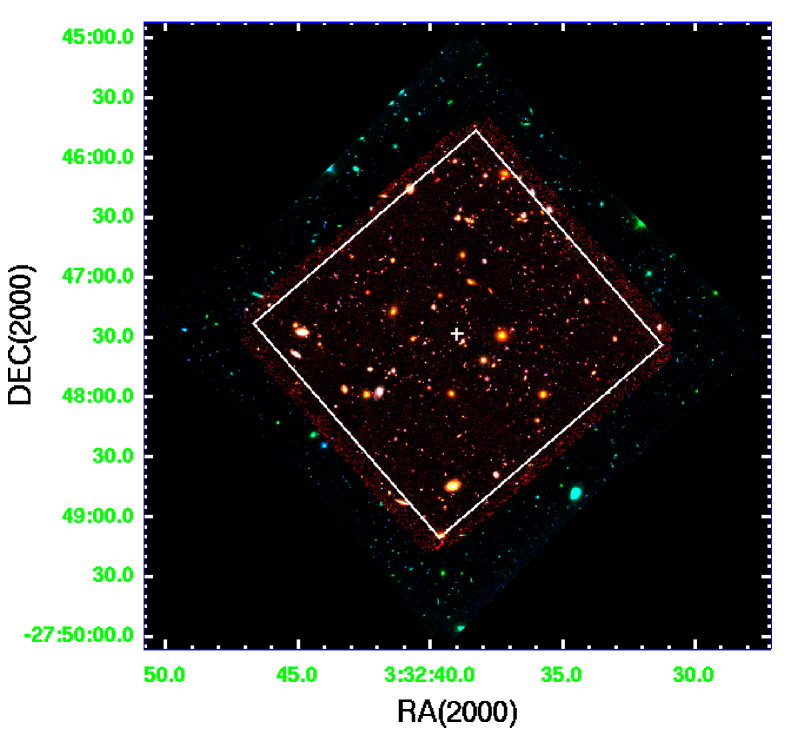
Figure 1 shows a composite pseudo-color image of the UDF. From this figure, we find that the full drizzled image does not have a uniform integration time over the image. In particular, the edges of the HST/NICMOS image have only one integration, as compared to the average 16 integrations for the interior of the image. Therefore, the area, as discussed in this paper, was reduced from HST/NICMOS’s 5.76 to 5.50 arcmin2, as is outlined near the center of the image.
2.3 Photometry
Source extraction in the science image was performed with the source extraction program SExtractor version 2.5 (Bertin & Arnout 1996) in the dual image and rms image mode. The source extraction includes four HST/ACS images, three VLT/ISAAC images, as well as two HST/NICMOS images. The NICMOS image was used as the detection image for our catalog. The source extraction parameters were similar to those used in the NICMOS treasury version 2.0 catalog, except for 2′′ diameter aperture used for the aperture magnitudes. 620 sources were detected in the central 5.5 arcmin2 area down to mag. For most of the objects, our Kron automatic aperture magnitudes (MAG_AUTO) for are close to those in Thompson et al. (2005), with differences generally less than 0.05 mag.
The total magnitude was then defined as the brighter of the Kron automatic aperture magnitude and the corrected aperture magnitude. The colors were measured using the 2′′ diameter aperture magnitudes. All magnitudes were corrected for Galactic extinction, , taken from Schlegel et al.(1998), using the empirical selective extinction function of Cardelli et al.(1989). Compared to the optical selection, the near-IR selection (in particular in the band) offers several advantages (Cimatti et al.2002). Therefore, we select objects to over a total sky area of 5.5 arcmin2 in the UDF, and 210 objects were included in our final catalog. Simulations of point sources show that in all the area the completeness is above 90% at this -band level.
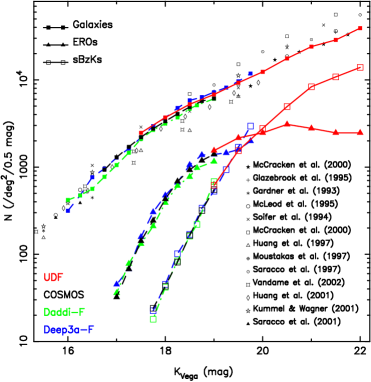
Figure 3 shows a comparison of the -band number counts in the UDF survey with a compilation of counts published in the literature. No corrections for incompleteness were applied to our data, and we excluded stars using the same method as that in Kong et al.(2006). The red-, black-, green- and blue-filled squares correspond to the counts of field galaxies in the UDF, COSMOS (Renzini et al.2008), Daddi-F and Deep3a-F (Kong et al.2006), respectively. As shown in the figure, our number counts in different fields are in good agreement with those of the previous surveys.
3 Photometric Redshifts
Photometric redshifts (hereafter ) were calculated for all the objects in the UDF. We take the public code , which uses a usual template-fitting and a minimization method (Bolzonella et al.2000).
We use a stellar population synthesis model (Kodama & Arimoto 1997, hereafter KA97) to make template SEDs. KA97 was successfully used to obtain photometric redshifts of low redshift galaxies (Kodama, Bell & Bower 1999) and high redshift galaxies (Furusawa et al.2000). The template SEDs consisted of the spectra of pure disks, pure bulges and composites obtained by interpolation. In total, our basic template set consisted of 303 SEDs (more description in a forthcoming paper). The spectral energy distribution derived from the observed magnitudes of each object was compared to each template spectrum (redshift from 0.0 to 5.0 at steps of 0.05; from 0.0 to 4.5 at steps of 0.05 and Calzetti et al.’s internal reddening law) in turn. The weighted mean redshift from was then calculated for each object.
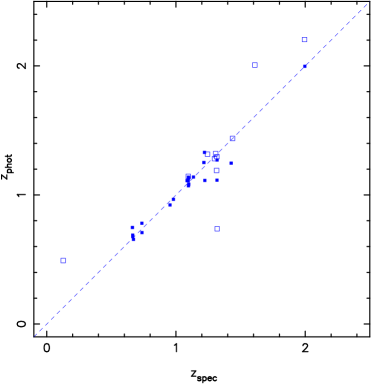
Figure 3 shows a comparison of the photometric redshifts with the 33 spectroscopic redshifts from VLT/FOS2 spectroscopy (Sect. 2.1). Filled squares show the objects with ”solid redshifts” (quality flag A) while open squares show the objects with less secure spectroscopic redshift identifications (quality flag B, ”likely redshift”). Taking into account only the objects with solid redshifts, the error in the photometric redshifts is with no catastrophic failures, but taking into account all the 33 objects, the error would increase to .
4 BK in the UDF
In this section, we select sBzKs in the UDF using the multicolor catalog based on the NIR -band image. Then we will discuss the number counts, clustering, morphologies, reddening, SFR and stellar masses of faint sBzKs in the UDF.
4.1 sBzKs Selection
The UDF - and -band filters are the same as those used in Daddi et al.(2004) while the -band filters are different in the UDF (F435W) and Daddi et al.(2004) (Bessel B). Using the Pickles (1998) stellar spectra, we find the correction term to the -band is very small ( in all cases). So we applied the selection criterion from Daddi et al.(2004) without change to the sBzKs selection in the UDF without additional correction.
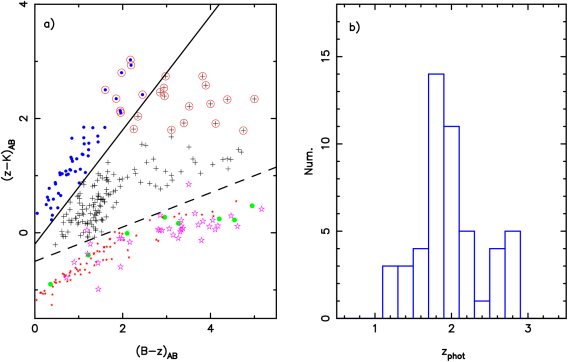
Figure 4a shows the color diagram of -selected objects in the UDF. Using the color criterion from Daddi et al.(2004), , 52 galaxies with are selected in the UDF as sBzKs, which occupy a narrow range on the left of the solid line in Figure 4a. To , the surface density of sBzKs is arcmin-2. We also selected EROs in the UDF with the criterion (AB mags), corresponding closely to (Vega mags). In the UDF to 24 EROs are selected and plotted in Figure 4a with open circles.
Figure 4b shows the photometric redshift histogram of 52 UDF galaxies selected with the criterion. The average redshift and the peak of the redshift distribution of sBzKs are . Only about 10% of them (6 objects) have , three of these six objects are EROs, and the other three are just marginally inside the selection region. The photometric redshift distribution supports the view that the criterion is valid for picking out star-forming galaxies at with .
4.2 Morphologies of sBzKs
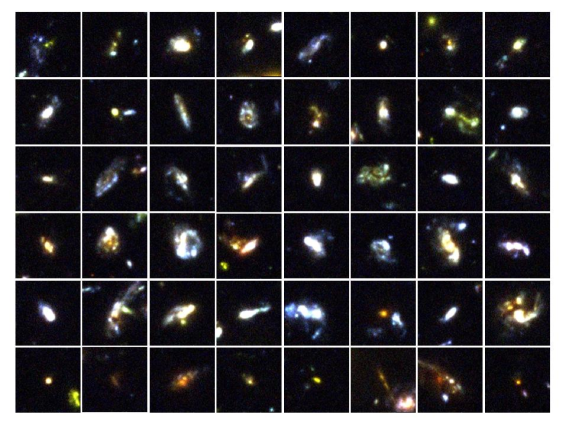
The morphology of a galaxy reflects its dynamical history and evolution. For example, different Hubble types are associated with different star formation histories and different patterns of motion of stars and gas. Morphological studies of distant objects have become possible now with the high-resolution capabilities of HST/ACS. The ACS imaging provides a fundamental complement of investigating the nature of sBzKs and elucidating their evolutionary status. Figure 5 shows the color images for 48 sBzKs (to show the image well, we randomly selected 48 sBzKs from all 52 sBzKs) in the UDF. The -, - and -band images were colored red, green, and blue, respectively.
From this figure, we find that although the sBzKs show a range of morphologies from compact protobulges to disturbed major-mergers, most of them show irregular/merging-like morphologies. The bottom row in Figure 5 shows objects which satisfy both the criterion (sBzKs) and the criterion (EROs). More detailed analysis, including concentration (), asymmetry (), clumpiness (), the Gini coefficient () and for the sBzKs and comparison with other high redshift galaxies will be presented in our forthcoming paper.
4.3 Number Counts of sBzKs
The differential number counts of sBzKs and EROs in the UDF are plotted in Figure 3. Open squares and solid triangles with solid lines in Figure 2 show the number counts for the sBzKs and EROs in the UDF, respectively.
From Figure 2 some characteristics are distinguished: 1) The fraction of sBzKs increases very steeply towards fainter magnitudes, and the counts of sBzKs have roughly the same slope at all K-band magnitudes. 2) The slope of the number counts of EROs is variable, being steeper at bright magnitudes and flattening out towards faint magnitudes. A break in the counts is present at , very similar to the break that has been shown in the previous works. 3) The counts of field galaxies, EROs and sBzKs in the UDF are almost identical to those in COSMOS, Daddi-F, and Deep3a-F to their limits of .
4.4 Clustering of sBzKs
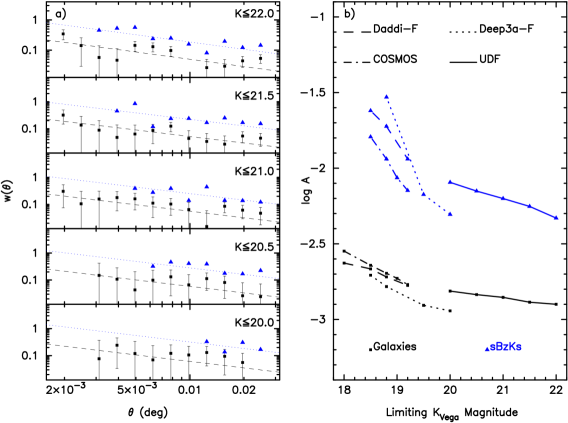
Measurement of the clustering of galaxies provides an additional tool for studying the evolution of galaxies and the formation of structures. In this section we estimate the angular correlation of the general galaxy population as well as that of sBzKs. In order to measure the angular correlation function of various galaxy samples, we apply the Landy-Szalay technique (Landy & Szalay 1993; Kerscher et al.2000). A fixed slope 0.8 is assumed for the two-point correlation function.
In Figure 6a, the bias-corrected two-point correlation functions of field galaxies are shown as squares. The dashed line shows the power-law correlation function given by a least squares fitting. We clearly have detect a positive correlation for the field galaxies with an angular dependence broadly consistent with the adopted slope 0.8. The derived clustering amplitudes (where is the amplitude of the true angular correlation at 1 degree) are , 1.46, 1.40, 1.30 and 1.26 for , 20.5, 21.0, 21.5, 22.0, respectively.
We estimate the clustering properties of the UDF sBzKs (the triangles in Figure 6a). The dotted lines show the power-law correlation function given by a least squares fitting to the measured values. A strong clustering of sBzKs is indeed present at all scales, with amplitudes about 6 times higher than those of the field population at the same limits, in agreement with the previous findings (Kong et al. 2006). The derived amplitudes are , 7.06, 6.30, 5.59 and 4.68 for , 20.5, 21.0, 21.5, 22.0, respectively.
Figure 6b summarizes the clustering measurements for the two populations examined (field galaxies and sBzKs), as a function of the -band limiting magnitudes of the samples. Clear trends with the magnitudes are present for all samples, that the fainter galaxies apparently have lower intrinsic (real space) clustering, consistent with the fact that objects with fainter magnitudes are less massive, or have wider redshift distributions, or both. We compare our results on the UDF with those previously reported by Renzini et al.(2008) for the COSMOS and Kong et al.(2006) for the Daddi-F and Deep3a-F, and find they all show a smooth decline in amplitude with -band magnitudes. However, the decline is not less steep in the range . Furthermore, the clustering amplitudes in these fields are slightly different. The field-to-field variation may be one of the possible reasons for this discrepancy, depending on the survey geometry, surface density and clustering properties.
4.5 Physical Quantities of sBzKs
In this subsection, physical properties of sBzKs such as color excess , SFRs and stellar masses, are derived on the basis of the present photometric data and the recipes calibrated in Daddi et al.(2004).
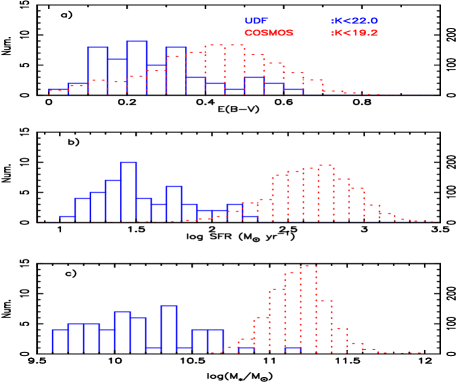
Following Daddi et al.(2004), the reddening of sBzKs can be estimated by the colors, providing a measure of the UV slope. The Daddi et al.’s recipe is consistent with the recipes by Meurer et al.(1999) and Kong et al.(2004) for the Calzetti et al.(2000) extinction law, based on the UV continuum slope. The histogram of sBzKs in the UDF is shown in Figure 7a (solid line). The median reddening for the sBzKs is estimated to be , and 18% of sBzKs have , where the UV-based criterion of Steidel et al.(2004) would fail to select the galaxies at . For comparison, we show the histogram of sBzKs in the COSMOS () in Figure 7a (dotted line), too. The median reddening for the sBzKs in the COSMOS is estimated to be , and 56% of them have . The difference is due to the different limiting magnitudes in the two fields.
Knowing the reddening, the reddening corrected -band flux is used to estimate the 1500 Å rest-frame luminosity, assuming an average redshift of 1.8, which can then be translated into SFR on the basis of the Bruzual & Charlot (2003) models. Daddi et al. (2005) showed that SFRs derived in this way were consistent with radio and far-IR based estimates for the average sBzKs. The SFR histograms of sBzKs in the UDF and COSMOS are shown in Figure 7b as solid line and dotted line, respectively. About 16% of the sBzKs in the UDF have SFR yr-1, and the median SFR is about yr-1. However, about 98% of the sBzKs in the COSMOS have SFR70 yr-1, and the median SFR is yr-1.
Following Daddi et al.(2004), the stellar masses of the sBzKs are estimated by an empirical relation between their observed -band total magnitudes and colors. The histograms for the stellar masses of sBzKs derived in this way are shown in Figure 7c. Almost all of the sBzKs in the UDF have and the median stellar mass is ; in the COSMOS, of the sBzKs have and the median stellar mass is . The higher masses for the sBzKs in the COSMOS compared to the UDF result from the shallower -band limit.
5 sBzKs- vs. UV-selected Galaxies at
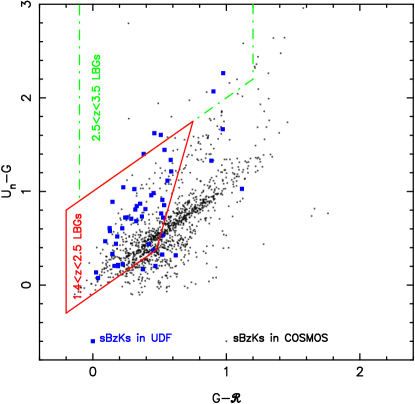
Recently, the UV technique for selecting LBGs has been extended to using a color-color diagram, which isolates star-forming galaxies at (Erb et al.2003; Steidel et al.2004; Adelberger et al.2004), a redshift range matching that of the selection. To compare these different color criteria (BzK-criterion and UV-criterion) for selecting star-forming galaxies at , we show the sBzKs in the UDF and COSMOS on the color-color diagram in Figure 8.
As no photometry is available to us for the sBzKs in the UDF region, synthetic magnitudes have been derived from the KA97 models which provided the best fits to the observed ACS-, NIC- and ISAAC- SEDs. Figure 8 shows the resulting synthetic vs. colors. Among the 52 sBzKs in the UDF, 39 (75%) would be selected by the Adelberger et al.(2004) criterion for the galaxies at , five would be selected by the Steidel et al.(2003) criterion for the galaxies at , only eight sBzKs fail to be selected by the UV criterion (these are highly dust obscured galaxies).
In Figure 8, we also plot the COSMOS sBzKs on the synthetic vs. diagram. Synthetic magnitudes have been derived from the KA97 models that provided the best fits to the observed CFHT-, Subaru-, SDSS- and KPNO/CTIO- SEDs. Among sBzKs in the COSMOS, only 450 (35%) would be selected by the Adelberger et al.(2004) criterion while about 65% sBzKs fail to be selected by the UV criterion.
From Figure 8 we find that most of the faint sBzKs can be selected by the UV criterion for the galaxies at , but it does not work well for the brighter sBzKs objects. One possible reason is that the UV-selection requires the UV continuum to be relatively flat, thus limits the overall dust extinction to (Adelberger & Steidel 2000), but many of the bright sBzKs at are more reddened. As we discussed in Section 4.5, a large proportion of highly reddened galaxies are actively star-forming and have large stellar masses. Therefore, a large fraction (as high as ) of the galaxies at fail to be selected by the UV criterion of identifying galaxies at . As a consequence, a significant part of the SFR density and stellar mass density is missed.
6 Summary and Conclusions
In this paper, we investigate the properties of star-forming galaxies at (sBzKs) in the HST Ultra Deep Field. Using images from ACS-, NIC-, ISAAC- and spectroscopy from VLT/FOS2, we analyze the photometric redshifts, number counts, clustering, , SFRs, stellar masses and morphologies of sBzKs in the UDF. The main results can be summarized as follows.
1. Based on the KA97 templates and a standard minimizing method, we have developed a new photometric redshift method. Comparing the photometric redshifts for 33 galaxies with spectroscopic redshifts from VLT/FOS2, we find that the error in the photometric redshifts is less than 0.02(1+).
2. Combining multiwave band ground-based and ACS/NIC photometric data, we estimate the photometric redshifts for galaxies in the UDF. We find the color criterion can be used to select star-forming galaxies at with .
3. Down to , we selected 52 sBzKs in the UDF. Most of the sBzKs have irregular morphologies on the ACS images. The logarithm of the number counts of sBzKs increases linearly with the magnitudes, while that of EROs flattens out by .
4. The two-point angular correlation function of sBzKs and field galaxies were calculated, and the clustering amplitudes of sBzKs are found to be about a factor of 6 higher than those of generic galaxies at the same magnitude range. A smooth decline in amplitude with -band magnitude is found, which is consistent with results from previous works.
5. Using the approximate relations from Daddi et al. (2004) and multicolor photometry, we estimated the color excess, SFRs and stellar masses of sBzKs. These galaxies have a median reddening of , an average SFR of yr-1, and a typical stellar mass of .
6. The UV criterion for the galaxies at can select most of sBzKs in the UDF (), but it does not work well for the brighter sBzKs sample in the COSMOS (). A large fraction of massive, highly reddened, actively star-forming galaxies can not be selected by the UV criterion.
Acknowledgements.
We are grateful to Prof. Qirong Yuan for valuable suggestions. The work is supported by the National Natural Science Foundation of China (NSFC, Nos. 10573014 and 10633020), the Knowledge Innovation Program of the Chinese Academy of Sciences (No. KJCX2-YW-T05), and National Basic Research Program of China (973 Program) (No. 2007CB815404). Observations have been carried out using Hubble Space Telescope (HST) and the Very Large Telescope (VLT).References
- [Adelberger & Steidel(2000)] Adelberger K. L., Steidel C. C., 2000, ApJ, 544, 218
- [Adelberger et al.(2004)] Adelberger K. L., Steidel C. C., Shapley A. E. et al., 2004, ApJ, 607, 226
- [Beckwith et al.(2006)] Beckwith S. V. W. et al., 2006, AJ, 132, 1729
- [Bertin & Arnouts(1996)] Bertin E., Arnouts S., 1996, A&AS, 117, 393
- [Bolzonella et al.(2000)] Bolzonella M., Miralles J.-M., Pelló R., 2000, A&A, 363, 476
- [Bruzual & Charlot 2003] Bruzual G., Charlot S., 2003, MNRAS, 344, 1000
- [Calzetti et al.(2000)] Calzetti D., Armus L., Bohlin R. C. et al., 2000, ApJ, 533, 682
- [] Cardelli J. A., Clayton G. C., Mathis J. S., 1989, ApJ, 345, 245
- [Cimatti et al.(2002)] Cimatti A. et al., 2002, A&A, 392, 395
- [Daddi et al.(2004)] Daddi E., Cimatti A., Renzini A. et al., 2004, ApJ, 617, 746
- [Daddi et al.(2005)] Daddi E., Renzini A., Pirzkal N. et al., 2005, ApJ, 626, 680
- [Dickinson et al.(2003)] Dickinson M., Papovich C., Ferguson H. C., Budavári T., 2003, ApJ, 587, 25
- [Erb et al.(2003)] Erb D. K., Shapley A. E., Steidel C. C. et al., 2003, ApJ, 591, 101
- [Fontana et al.(2003)] Fontana A. et al., 2003, ApJ, 594, L9
- [Furusawa et al.(2000)] Furusawa H., Shimasaku K., Doi M., Okamura S., 2000, ApJ, 534, 624
- [Kerscher et al.(2000)] Kerscher M., Szapudi I., Szalay A. S., 2000, ApJ, 535, L13
- [Kodama & Arimoto 1997] Kodama T., Arimoto N., 1997, A&A, 320, 41
- [Kodama, Bell, & Bower 1999] Kodama T., Bell E. F., Bower R. G., 1999, MNRAS, 302, 152
- [Kong et al.(2004)] Kong X., Charlot S., Brinchmann J., Fall S. M., 2004, MNRAS, 349, 769
- [Kong et al.(2006)] Kong X. et al., 2006, ApJ, 638, 72
- [Landy & Szalay(1993)] Landy S. D., Szalay A. S., 1993, ApJ, 412, 64
- [Meurer et al.(1999)] Meurer G. R., Heckman T. M., Calzetti D., 1999, ApJ, 521, 64
- [Pickles(1998)] Pickles A. J., 1998, PASP, 110, 863
- [Renzini et al.(2008)] Renzini A., et al., 2008, ApJ, in preparation
- [Richards et al.(2006)] Richards G. T. et al., 2006, AJ, 131, 2766
- [Schlegel, Finkbeiner, & Davis(1998)] Schlegel D. J., Finkbeiner D. P., Davis M., 1998, ApJ, 500, 525
- [Scoville et al.(2007)] Scoville N., et al. 2007, ApJS, 172, 1
- [Steidel et al.(2004)] Steidel C. C., Shapley A. E., Pettini M. et al., 2004, ApJ, 604, 534
- [Thompson et al.(2005)] Thompson R. I. et al., 2005, AJ, 130, 1
- [Vanzella et al.(2005)] Vanzella E. et al., 2005, A&A, 434, 53