The Masses of Population II White Dwarfs11affiliation: Data presented herein were obtained at the W. M. Keck Observatory, which is operated as a scientific partnership among the California Institute of Technology, the University of California, and the National Aeronautics and Space Administration. The Observatory was made possible by the generous financial support of the W. M. Keck Foundation. 22affiliation: Based on observations obtained at the Gemini Observatory (Program IDs: GS-2005A-Q-5 and GS-2006B-Q-25), which is operated by the Association of Universities for Research in Astronomy, Inc., under a cooperative agreement with the NSF on behalf of the Gemini partnership: the National Science Foundation (United States), the Particle Physics and Astronomy Research Council (United Kingdom), the National Research Council (Canada), CONICYT (Chile), the Australian Research Council (Australia), CNPq (Brazil) and CONICET (Argentina). 33affiliation: Based on observations with the NASA/ESA Hubble Space Telescope, obtained at the Space Telescope Science Institute, which is operated by the Association of Universities for Research in Astronomy, Inc., under NASA contract NAS5-26555. These observations are associated with proposal GO-8679.
Abstract
Globular star clusters are among the first stellar populations to have formed in the Milky Way, and thus only a small sliver of their initial spectrum of stellar types are still burning hydrogen on the main-sequence today. Almost all of the stars born with more mass than 0.8 have evolved to form the white dwarf cooling sequence of these systems, and the distribution and properties of these remnants uniquely holds clues related to the nature of the now evolved progenitor stars. With ultra-deep HST imaging observations, rich white dwarf populations of four nearby Milky Way globular clusters have recently been uncovered, and are found to extend an impressive 5 – 8 magnitudes in the faint-blue region of the H-R diagram. In this paper, we characterize the properties of these population II remnants by presenting the first direct mass measurements of individual white dwarfs near the tip of the cooling sequence in the nearest of the Milky Way globulars, M4. Based on Gemini/GMOS and Keck/LRIS multiobject spectroscopic observations, our results indicate that 0.8 population II main-sequence stars evolving today form 0.53 0.01 white dwarfs. We discuss the implications of this result as it relates to our understanding of stellar structure and evolution of population II stars and for the age of the Galactic halo, as measured with white dwarf cooling theory.
Subject headings:
globular clusters: individual (M4) – stars: evolution – stars: mass loss – techniques: spectroscopic – white dwarfs1. Introduction
The end products of stellar evolution for 98% of all stars will be white dwarfs. This final state results because most stars are not massive enough to ignite C and O, so that nuclear reactions cease with the formation of a degenerate core of He or a combination of He, C, and O. With the cessation of nuclear reactions, white dwarfs emit light only via their cooling and become dimmer as time passes. These remnants have very thin surface layers of H and/or He, the bulk of the envelope having been blown away during relatively quiescent stages of mass loss in the progenitor star. For the oldest stellar populations, 15% of the entire present day mass of the system is tied up in white dwarfs, and therefore their distribution and detailed properties represent a unique link to explore the nature of the now-evolved population II progenitors. Such studies are enhanced in star clusters where all of the remnants are co-spatial, have the same total age, and evolved from stars with the same metallicity, yet over a range in initial mass.

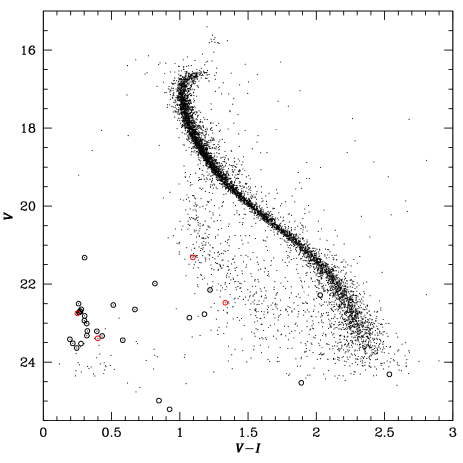
Milky Way globular star clusters have been dated to a formation time roughly 12 Gyr ago (e.g., Krauss & Chaboyer 2003), and therefore represent the first structures to form in the Galaxy. These systems are one of the most important tools that we have to probe the formation and evolution processes of galaxies (Brodie & Strader, 2006). Given their ages, the present day main-sequence turnoff mass in globulars is about 0.8 , and therefore the bulk of their population has evolved through post main-sequence evolution, the majority having formed faint white dwarf stars. Through almost 400 orbits of Hubble Space Telescope imaging observations this decade, our team has uncovered the complete white dwarf cooling sequences of the two nearest globular clusters, M4 and NGC 6397 (Richer et al., 2004, 2008), and will target the third nearest cluster, 47 Tuc, in Cycle 17 (GO-11677). A shallower study of the massive globular Omega Cen by Monelli et al. (2005) and Calamida et al. (2008) has successfully uncovered over 6500 remnants in this single cluster111Given the larger distance, the brightest faint-blue objects on the apparent Omega Cen white dwarf cooling sequence may be subdwarf stars., roughly a quarter of the total known white dwarf population in the entire Milky Way from all other studies combined (e.g., Eisenstein et al. 2006, and subsequent Sloan Digital Sky Survey work). The color-magnitude diagrams (CMDs) of these clusters, extending to impressively faint magnitudes, are presented in Figure 1 (see also Bedin et al. 2009 for a more recent ACS study of M4).
The white dwarf cooling sequences of nearby globular clusters have been analyzed to independently (e.g., of main-sequence stars and turnoff morphology) derive the distances and ages of the clusters (Hansen et al., 2004, 2007), explore age variations between metal-rich and metal-poor systems using stars whose evolution is almost completely independent of metallicity (Hansen et al., 2007), possibly suggest large fractions of helium-core white dwarfs produced through binary interactions (Monelli et al., 2005; Calamida et al., 2008), and hint that mass loss stages leading to the formation of white dwarfs may involve small asymmetric kicks (Davis et al., 2008). For each of these studies, the interpretation of the photometry to yield the results depends on knowledge of the mass of the brightest white dwarfs that are forming today in these old systems. Yet, at present, no direct measurements of the masses of such population II white dwarfs exists, although several indirect arguments suggest that the value should be 0.53 . As discussed in Renzini & Fusi Pecci (1988) and Renzini et al. (1996), stellar evolution theory and our understanding of the maximum luminosity of red giant (RG) and asymptotic giant branch (AGB) stars, as well as the luminosity of the horizontal branch (HB), predict that white dwarfs forming in globular clusters today should have 0.51 0.55 . The best observational verification of this theoretical prediction in the case of cluster white dwarfs was provided recently by Moehler et al. (2004), who reported the masses of white dwarfs in NGC 6752 to be 0.53 . However, their spectroscopic measurements were only of sufficient quality to yield the temperatures of the white dwarfs, and therefore the photometry from the CMD was leveraged to derive masses. Recently, a study of the masses of field white dwarfs was also presented from the SPY project (ESO SN Ia Progenitor surveY). Pauli et al. (2006) find several hundred thin disk and thick disk white dwarfs, and seven candidate halo objects based on kinematic analysis. The masses of six of these white dwarfs range from 0.44 – 0.51 , with an additional lower mass star at 0.35 .
In this paper we present the first results from a new study aimed at directly (i.e., purely from spectroscopic absorption line fitting) measuring the masses of known population II white dwarfs in different environments. Our goal is to target the brightest white dwarfs in the nearest globular star clusters (such as M4, NGC 6397, and 47 Tuc) and in the halo field, with ground-based spectroscopic instruments on 8–10 m telescopes. The clusters listed above span an appreciable range in metallicity (factor of 20) and are located at distances such that the brightest white dwarfs with = 10.5 have apparent magnitudes of = 22 – 24. The faintness of these stars, crowding issues in the cluster, and the need to obtain high signal-to-noise (S/N) spectra of the higher order Balmer lines at 4000 make this a difficult, but possible, project with current telescopes. Below, we discuss the results from our first study, in which we target two dozen white dwarfs in M4 with the Gemini/GMOS and Keck I/LRIS multiobject spectrographs over several observing runs. The spectra for six of these stars, that are confirmed as cluster members and that have sufficient S/N to yield accurate mass measurements, are consistent with = 0.53 0.01 . The impact of this measurement for bettering our knowledge of stellar structure and evolution, and for dating halo globular clusters through white dwarf cooling theory, are discussed. An analysis of the remaining M4 spectra that did not yield masses, e.g., to define the spectral types of population II white dwarfs, is presented in the companion paper by Davis et al. (2009).
2. Imaging and Spectroscopic
Observations of M4
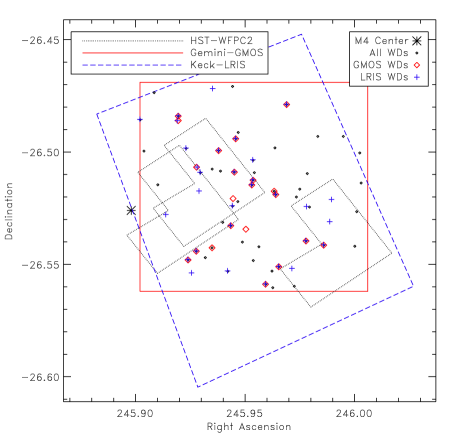
The deep HST imaging data of M4 illustrated in Figure 1 (left) were collected with the Wide Field Planetary Camera 2 (WFPC2) camera in 2001 as a part of GO-8679 (Richer et al., 2004). The observations spanned a total of 123 orbits, in the broadband and filters, and were centered on a field located at (,) = (, ), 2.4 pc (4.8′) S-E of the center of the cluster. Although the HST photometry is very accurate, and there is no ambiguity on the membership of the white dwarfs, the bulk of the stars are too faint to be useful for spectroscopic follow up with modern day facilities. Additionally, the WFPC2 field of view is 5.3 square arcminutes, about six times smaller than our ground based instruments, and therefore the spectroscopic program would be highly inefficient with just this input list of targets. Below we first discuss supplemental imaging of these data with the Gemini South telescope (§ 2.1), followed by spectroscopic follow up (§ 2.2). In §§ 2.3 and 2.4, we discuss additional spectroscopic observations of M4’s white dwarf population with the Keck I telescope.
2.1. Gemini/GMOS Photometry and Astrometry
We reobserved M4 with the Gemini South telescope and Gemini MultiObject Spectrograph (GMOS), anchoring the deep HST field near the south-eastern edge of the ground based image and placing shallower HST pointings near the western side. The GMOS photometry, over a 5.5 5.5′ area, has the added advantage that it extends continuous imaging into the denser region towards the center of M4 and therefore provides a higher density of targets down to a given magnitude limit. Of course, crowding in the ground-based data prevents the targeting of white dwarfs near bright stars, and this increases in the direction of the cluster center. A footprint of the HST and GMOS images is provided in Figure 2.
As this map illustrates, less than half of the Gemini/GMOS field of view overlaps the HST/WFPC2 observations. In order to effectively select white dwarf candidates over the entire GMOS field, we obtained imaging in both the ′ and ′ filters, down to a depth of 25th mag. The images were corrected for bias and flat fielding by the Gemini iraf pipeline, version 1.4. The processed images were then reduced with the standard DAOPHOT/ALLSTAR photometry package to yield PSF photometry (Stetson, 1994). Further details on the steps involved in our application are provided in Kalirai et al. (2008) for a similar study.
The matched catalog of WFPC2 and GMOS sources contains stars. We calibrate the ′ and ′ magnitudes to HST and (hereafter called and ) using derived transformations for the common stars in the space- and ground-based systems (see Davis et al. 2009 for details on the transformations). These offsets are then applied to the entire GMOS catalog. The positions of all stars on the GMOS image were carefully measured with respect to both HST positions and standard USNO guide stars to yield precise astrometry.
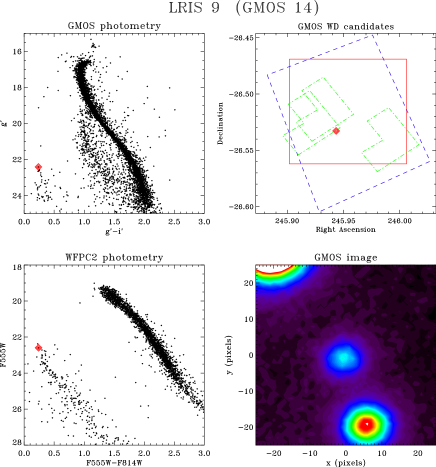
The Gemini/GMOS CMD of M4 is presented in Figure 3. Both the main-sequence and white dwarf cooling sequence are well measured, the latter containing about two dozen candidates brighter than = 24. The location of these white dwarf candidates are illustrated on Figure 2 as smaller points. The selection here includes stars with 20 24.5 and colors 0.5. Note the paucity of ground based candidates in the two inner WFPC2 fields (top-left). There are in fact many white dwarfs at these positions, however, the crowding limits their detection from the ground.
We further subdivide the sample of white dwarf candidates into two bins, with priority 1 stars being our strongest white dwarf candidates in the dominant part of the cooling sequence, and priority 2 objects being somewhat more uncertain objects that are located off the cooling sequence (e.g., redder or bluer) and/or near a bright star. These latter objects are only included in the spectroscopic mask if they do not overlap a priority 1 star (hence, we get a spectrum of the potential white dwarf for free). Any of the confirmed members of M4, based on HST proper motions in the region of overlap, were also targeted as priority 1 objects. Finally, we include several redder stars that are candidate CVs in the priority 2 sample; most of these are HST proper motion members as well. In total, 21 white dwarf candidates were targeted with Gemini/GMOS for follow up spectroscopy. Note, a few of the very red or faint objects shown in the CMD were included without pre-selection for the purpose of filling the spectroscopic mask (these objects were not detected from the ground).
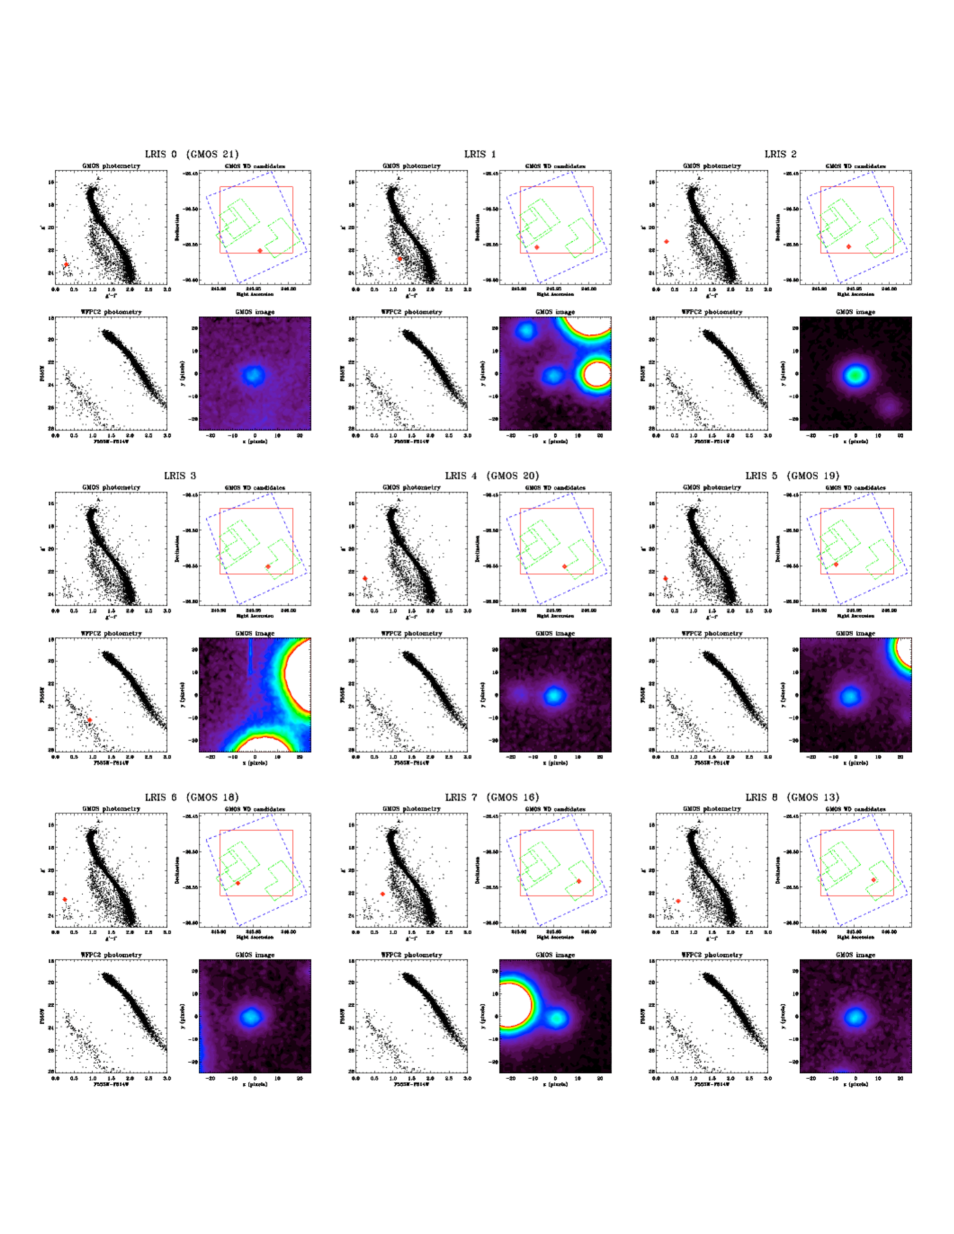
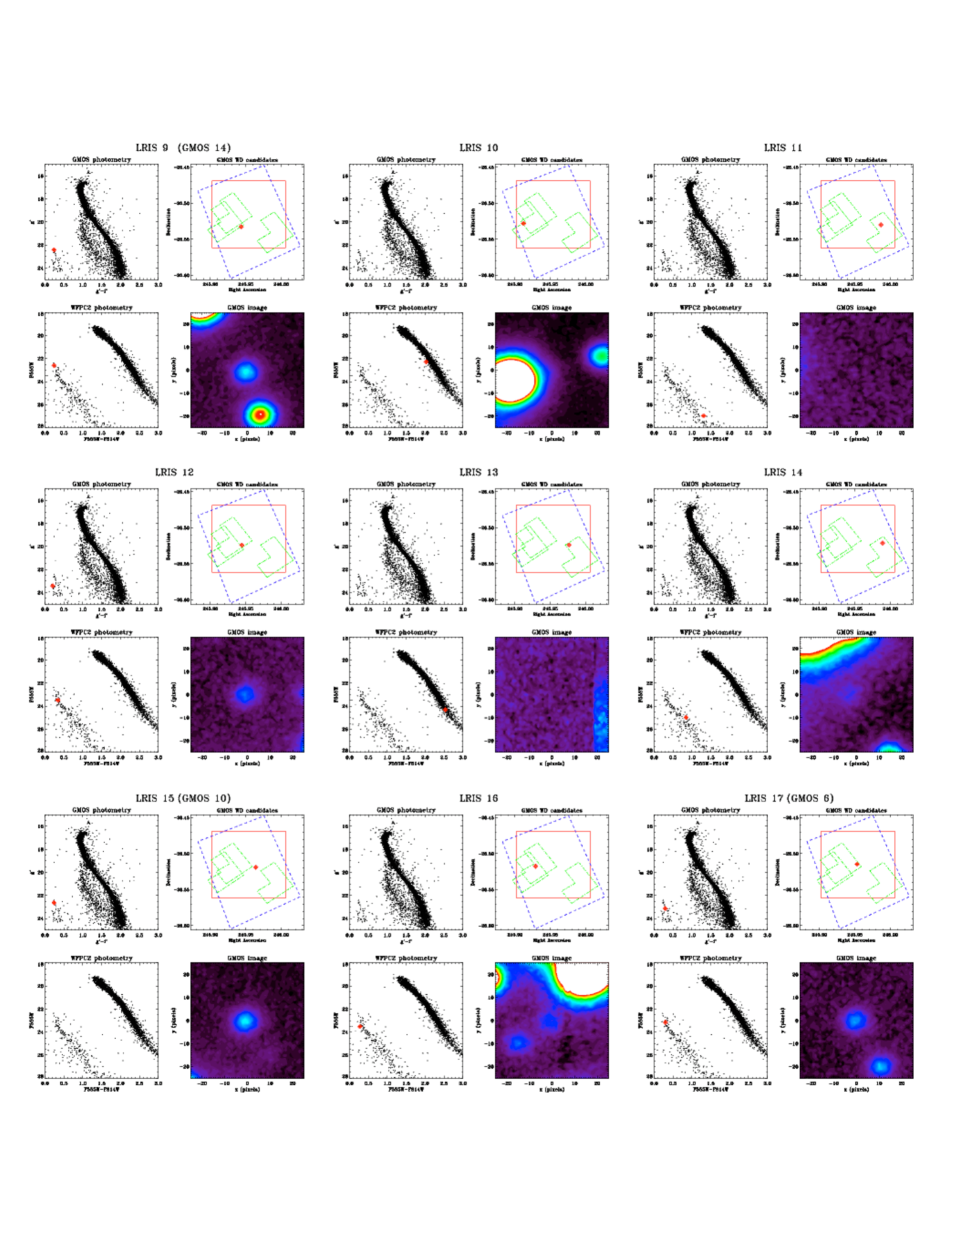
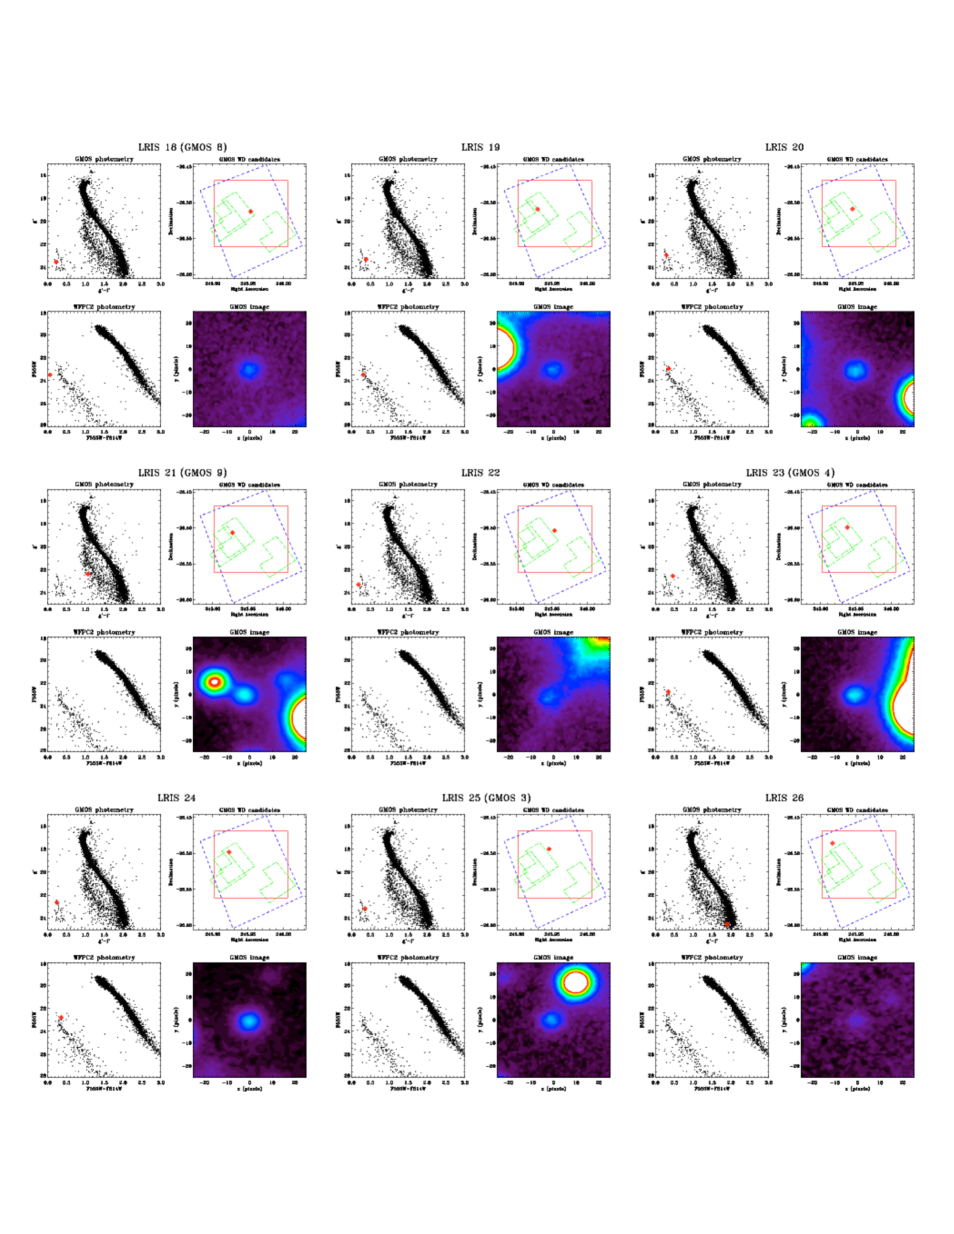
An example of the GMOS and WFPC2 photometry, astrometry, and a postage stamp image of the white dwarf candidate WD 09 is shown in Figure 4. Similar figures for all other white dwarf candidates are provided in the Appendix.
2.2. Gemini/GMOS Spectroscopy
In total, we obtained approximately 14.5 and 9 hours of queue scheduled spectroscopic science exposures with Gemini/GMOS in June/August 2005 and August/September 2006, respectively. The observations were taken with the B600 grating, covering a broad wavelength region of 2700 centered at 4680 . The data were binned by a factor of two in the spectral direction to improve the S/N. All science exposures were obtained in sub-arcsecond seeing conditions and photometric skies.
The raw data frames were downloaded from the Canadian Astronomy Data Center (CADC) in multi-extension FITS (MEF) format and reduced with the Gemini iraf Package, version 1.4. The reductions are described in detail in Davis et al. (2009). Of the 21 targeted white dwarfs, a spectrum was recovered for all but three. Remarkably, all 18 of the recovered spectra show pressure-broadened absorption lines indicative of white dwarfs. The spectra for these 18 stars, as well as an analysis of their spectral types is also presented in Davis et al. (2009). Unfortunately, in order to determine reliable spectroscopic masses, characterization of H is crucial, and even H (3889 ) is very useful. The lack of flux at these wavelengths in our Gemini data limited the utility of the GMOS spectra for the central goals of this paper. Although we could derive mass measurements from the spectra (see § 4.1), the uncertainties are several tenths of a solar mass and therefore we decided to supplement these data with higher S/N observations, especially at bluer wavelengths.
2.3. Keck/LRIS Target Selection
With a sample of confirmed white dwarfs established from the GMOS observations, we applied for Keck I telescope time to reobserve the targets using the LRIS multiobject spectrograph. Not only does Keck provide a larger aperture than Gemini, but the spectrograph is very efficient in the blue and has an atmospheric dispersion corrector to minimize light loss at large airmasses (this is important for this study since Keck is in the north and M4 is in the south). Given the similarities in the field of view (LRIS has a 5 7′ footprint), we simply used as many of the confirmed sample of white dwarfs from Gemini as our input, as well as several additional redder stars in the same brightness range. The location of the 31 LRIS targets in the ground-based CMD are shown in Figure 3 as larger open circles. The objects marked in red circles are those that were targeted with Gemini, but not Keck. The LRIS footprint is also shown in Figure 2.
2.4. Keck/LRIS Spectroscopy
Keck/LRIS spectroscopic observations (R. M. Rich, PI) of the single M4 mask proved challenging. Half nights, required due to the low declination of M4, were scheduled in 2005 June, 2007 April/July, and 2008 April, with the 2007 and 2008 observations benefiting from the LRIS atmospheric dispersion correction system. The multiple allocations were required due to poor weather that resulted in the loss of a significant number of scheduled hours. Altogether, we obtained 10.6 hours of useful exposure time. Even these data are of highly variable quality, with seeing measurements ranging from 08 to over 20. In these crowded fields, our final spectra are dominated by a few of the contributions from the best nights.
LRIS (Oke et al., 1995) has a dichroic that splits the spectrum into two channels at 5500 . On the blue side, we use the 400/3400 grism (dispersion = 1.09 /pixel) which covers a wavelength region from the atmospheric cutoff to the dichroic. For the red side, we use the 600/7500 grating (dispersion = 1.28 /pixel), centered at 6600 , which covers a wavelength baseline of 2620 . At our resolution and central wavelength, only H, which is a rather poor mass indicator, landed on the red side. Hence, we chose not to reduce the red-side data for this paper.
The blue-side LRIS spectra were reduced using standard iraf tasks. The trace, sky subtraction, and extraction were all performed with the apall task. As expected given the better blue sensitivity of LRIS compared to GMOS, the trace at blue wavelengths was far more certain. Given the high levels of crowding and background light from bright M4 stars in the field, our ability to obtain a reliable trace, and perform accurate sky subtraction is dependent on the particulars of each individual slitlet (see § 3).
The wavelength calibration was calculated in iraf from spectra of three lamps containing Hg, Zn, and Cd. The typical final dispersion of the wavelength solution was well constrained, with uncertainties of 0.1 . The reduced, wavelength calibrated LRIS spectra were flux calibrated using the spectrophotometric standard HZ44. Finally, the individual spectra were combined using scombine, with weights assigned according to the individual S/N ratios.
We summarize the identification, positions, and brightnesses of all white dwarf candidates in Table 1. The four stars that have slit conflicts, and therefore were not observed with Keck, are listed at the bottom of the table. Altogether, 31 objects were targeted with Keck/LRIS. Note, the identification of these stars as “WD” at this stage does not confirm their nature, although we will find later that most are in fact white dwarfs. We use this naming scheme for convenience as we will refer back to this Table in future sections.
| Identification # | RA (J2000) | DEC (J2000) | ||
|---|---|---|---|---|
| WD 00 | 245.9579 | 26.5589 | 0.32 | 23.32 |
| WD 01 | 245.9256 | 26.5540 | 1.18 | 22.77 |
| WD 02 | 245.9406 | 26.5531 | 0.30 | 21.32 |
| WD 03∗ | 245.9710 | 26.5511 | 0.93 | 25.21 |
| WD 04 | 245.9638 | 26.5511 | 0.27 | 22.69 |
| WD 05 | 245.9224 | 26.5480 | 0.27 | 22.71 |
| WD 06 | 245.9262 | 26.5442 | 0.28 | 22.65 |
| WD 07 | 245.9844 | 26.5414 | 0.82 | 21.99 |
| WD 08 | 245.9763 | 26.5396 | 0.67 | 22.65 |
| WD 09 | 245.9419 | 26.5328 | 0.26 | 22.50 |
| WD 10∗ | 245.9120 | 26.5281 | 2.03 | 22.28 |
| WD 11∗ | 245.9867 | 26.5300 | 1.31 | 26.96 |
| WD 12 | 245.9427 | 26.5241 | 0.22 | 23.52 |
| WD 13∗ | 245.9764 | 26.5240 | 2.54 | 24.31 |
| WD 14∗ | 245.9890 | 26.5214 | 0.85 | 24.99 |
| WD 15 | 245.9625 | 26.5190 | 0.26 | 22.73 |
| WD 16∗ | 245.9276 | 26.5175 | 0.28 | 23.53 |
| WD 17 | 245.9515 | 26.5147 | 0.32 | 23.20 |
| WD 18 | 245.9521 | 26.5125 | 0.25 | 23.64 |
| WD 19 | 245.9281 | 26.5092 | 0.43 | 23.33 |
| WD 20 | 245.9436 | 26.5090 | 0.32 | 23.01 |
| WD 21 | 245.9263 | 26.5067 | 1.22 | 22.15 |
| WD 22 | 245.9521 | 26.5037 | 0.19 | 23.41 |
| WD 23 | 245.9364 | 26.4994 | 0.51 | 22.54 |
| WD 24 | 245.9216 | 26.4984 | 0.26 | 22.72 |
| WD 25 | 245.9442 | 26.4941 | 0.39 | 23.21 |
| WD 26 | 245.9168 | 26.4860 | 1.89 | 24.53 |
| WD 27 | 245.9006 | 26.4856 | 0.58 | 23.44 |
| WD 28 | 245.9179 | 26.4840 | 0.30 | 22.81 |
| WD 29 | 245.9674 | 26.4789 | 0.30 | 22.94 |
| WD 30 | 245.9353 | 26.4719 | 1.07 | 22.86 |
| GemWD 05 | 245.9195 | 26.4860 | 1.33 | 22.48 |
| GemWD 11 | 245.9633 | 26.5174 | 0.40 | 23.39 |
| GemWD 15 | 245.9349 | 26.5426 | 0.25 | 22.75 |
| GemWD 17 | 245.9504 | 26.5344 | 1.10 | 21.31 |
3. Eliminating Non-White Dwarfs and Stars With Poor Spectra
The ground-based CMD of our targets in Figure 3 shows that the dominant, blue white dwarf cooling sequence of M4 extends from = 22.5 to 23.5, and contains eleven stars that were spectroscopically observed with LRIS (note, the clump at 22.7, 0.3 contains five LRIS targets). An additional target, WD 02, is almost one magnitude brighter than the family of fainter points and has = 21.3, another four stars are found fainter and bluer than the cooling sequence at 23.5, 0.25 (including the one object without ground based photometry), and two stars are at the faint end and redder than the cooling sequence at = 23.2 and = 0.4. Most of the stars that are redder than this sample of 18 objects (i.e., 0.5) yielded spectra that are not interesting for the goals of this paper and will be commented upon further in Davis et al. (2009). In Table 1, these objects are WD 01, 03, 07, 08, 10, 11, 13, 14, 21, 23, 26, 27, and 30. The one exception to this is possibly the relatively bright star just beyond the = 0.5 color cut at = 22.54, = 0.51 (WD 23). This star is a proper motion member of M4 but, as shown in the Appendix in Figure 12, is located very close to a bright neighbor. Likely, the color (and spectrum) of this star is contaminated from the neighboring star and we therefore eliminate it from our analysis.
| ID | (K)a | log a | () | b | S/Nc | Memberd | ||
|---|---|---|---|---|---|---|---|---|
| WD 00 | 23.32 | 20,600 600 | 7.75 0.09 | 0.52 0.04 | 22.82 0.26 | 40 6 | 39 | YES (PM) |
| WD 04 | 22.69 | 24,300 500 | 7.68 0.08 | 0.50 0.03 | 22.40 0.23 | 19 1 | 47 | YES (Lum) |
| WD 06 | 22.65 | 25,600 500 | 7.87 0.08 | 0.59 0.04 | 22.59 0.23 | 18 2 | 51 | YES (Lum) |
| WD 15 | 22.73 | 24,300 600 | 7.79 0.09 | 0.55 0.04 | 22.57 0.27 | 21 2 | 29 | YES (Lum) |
| WD 20 | 23.01 | 19,700 600 | 7.73 0.10 | 0.51 0.05 | 22.89 0.29 | 49 8 | 32 | YES (PM) |
| WD 24 | 22.72 | 25,700 500 | 7.70 0.07 | 0.51 0.03 | 22.33 0.21 | 16 1 | 54 | YES (PM) |
| WD 02 | 21.32 | 18,800 200 | 8.16 0.04 | 0.75 0.03 | 23.56 0.14 | 128 11 | 61 | NO |
| WD 05 | 22.71 | 28,200 400 | 7.59 0.08 | 0.48 0.03 | 21.93 0.22 | 12 1 | 49 | NO |
| WD 09 | 22.50 | 25,100 600 | 8.19 0.09 | 0.79 0.05 | 23.10 0.25 | 44 12 | 32 | NO or DD |
| WD 29 | 22.94 | 20,900 700 | 7.44 0.11 | 0.41 0.04 | 22.32 0.31 | 33 4 | 27 | NO |
The family of 18 white dwarf candidates in M4’s ’pseudo’ cooling sequence are all confirmed to be white dwarfs (see Davis et al. 2009). For our primary goal of measuring accurate masses, we want to first restrict this sample to only include well measured, isolated white dwarfs with robust S/N (see § 4.1). The stars along the cooling sequence in our sample vary in brightness by about a factor of three, and therefore the fainter stars will intrinsically have much less signal than their brighter counterparts. Added to this, we note that the final quality of the spectrum for any star will depend on several factors and therefore not always correlate with the brightness. For example, the spatial length of the given slit effects the quality of the sky subtraction, the position of the star relative to M4’s center effects the sky background level, and any astrometric mis-centering of the star within the slit causes light loss. We first eliminate three (fainter) stars that are located within 30 pixels (2′′) of a bright neighbor. These stars, WD 16, 19, and 22, all exhibit a noisy spectrum that is likely contaminated with light from the nearby, brighter star (see Figures 11 & 12 in the Appendix). We also eliminate five white dwarfs, four of which are isolated, for which our extractions resulted in S/N 10 spectra, WD 12, 17, 18, 25, and 28. The extracted spectra for these white dwarfs suffer from unusable line profiles blueward of H, but with improved S/N, these particular sources could also be analyzed as described below.
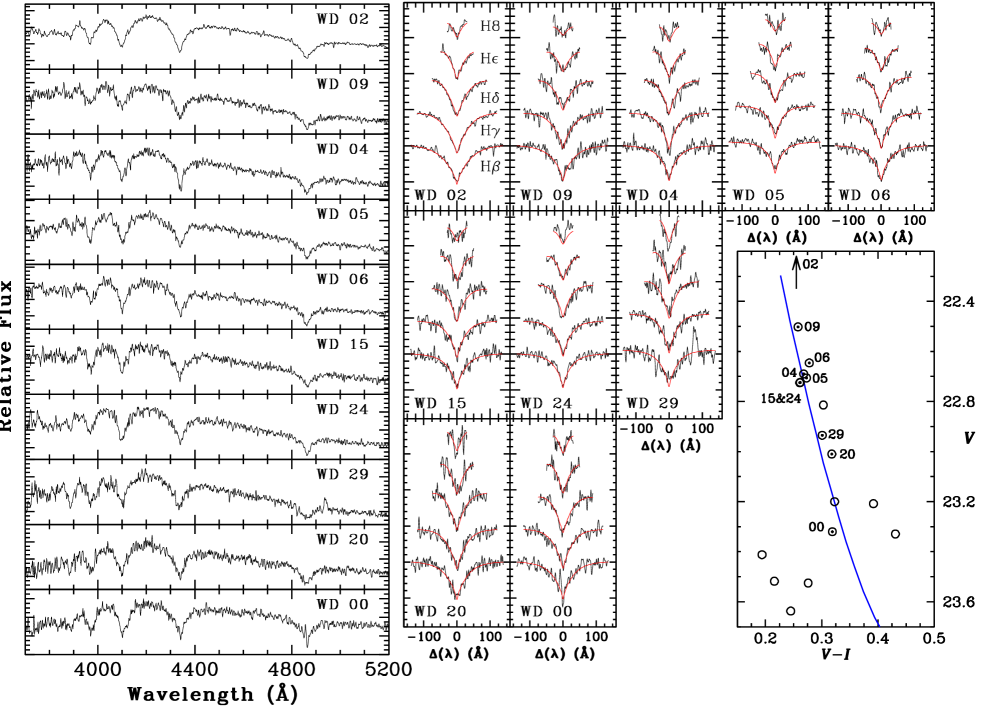
Our final sample has ten white dwarfs, all of which are close to the M4 cooling sequence and have 23.4 (seven of which have 23). As we demonstrate in § 4.3, four of these ten white dwarfs, WD 00, 09, 20, and 24, are HST proper motion members of M4. We present the spectra for these ten white dwarfs in Figure 5 (left). All of the spectra clearly show pressure-broadened Balmer lines extending from H to H8. These are therefore all DA (hydrogen) spectral type white dwarfs. We report the spectral types of all of our white dwarfs, including stars that are too faint for mass constraints, in Davis et al. (2009). The S/N per resolution element in our ten stars is generally 40 – 50, and at best 60 for one star (WD 02).222The spectral S/N is calculated at 4030 as discussed in § 4.2.
We also present a detailed view of the white dwarf cooling sequence in the CMD, and indicate the positions of these ten white dwarfs in the bottom-right panel of Figure 5 (dotted circles). The remaining open circles (without dots) in this diagram are those stars that were spectroscopically targeted in this narrow region of CMD space. We note that the magnitudes and colors of WD 15 and 24 are almost identical and so the two dots can not be discerned. We also illustrate a theoretical white dwarf cooling model for = 0.5 (Wood, 1995), which cuts through our sample nicely. From this plot, it is clear that WD 02 is well removed from the dominant sequence of points and the cooling model. Although it is possible that the photometry for this star is in gross error, it is more likely that the star is a field white dwarf along M4’s sightline (see § 4.3 for more information).
4. Mass Measurements of White Dwarfs in M4
The technique of measuring masses of white dwarfs from Balmer line fitting has been widely employed for field stars, such as in the Palomar-Green (PG) Sample (Liebert, Bergeron, & Holberg, 2005) and Sloan Digital Sky Survey (SDSS) (Eisenstein et al., 2006; Kepler et al., 2007). The technique has also been cross-checked against independent measures of the mass of a white dwarf such as astrometry for binary systems (e.g., Sirius B, Barstow et al. 2005), fits to the mass-radius relation for stars with trigonometric parallaxes (Holberg, Bergeron, & Gianninas, 2008), the gravitational redshift method (Reid, 1996), and pulsation mode analysis (Kawaler, 1991). For temperatures hotter than 12,000 K, these methods are in excellent agreement with the spectroscopic line fitting technique (Bergeron, Liebert, & Fulbright, 1995).
In this section, we first briefly describe our method to calculate masses for the ten white dwarfs discussed above. We then verify the uncertainties in the masses using synthetic spectra of the same quality as the observations, and fit using the same methods described below. Finally, we remove field white dwarfs from the sample and analyze the mass of the confirmed M4 members.
4.1. Balmer Line Fits
Fitting the Balmer lines of a white dwarf to model atmospheres involves reproducing multiple line profiles from H to higher order transitions (Bergeron, Saffer, & Liebert, 1992). Typically, four or five well measured lines are enough to constrain the temperature () and surface gravity (log ) of the star (Bergeron, Saffer, & Liebert, 1992). The fifth Balmer line in this sequence, H, is the weakest and bluest (at = 3889 ), and therefore a spectrograph with high throughput in the blue is needed to characterize the feature accurately in faint stars. General details of the fitting technique used to derive and log are provided in Bergeron, Saffer, & Liebert (1992), and recent refinements to this method are given in Liebert, Bergeron, & Holberg (2005). Additional information on the fitting of white dwarf spectra similar to these observations, and taken with our instrumental setup, are presented in § 6 of Kalirai et al. (2008). Specifically, the improved method to normalize the line profiles described in Liebert, Bergeron, & Holberg (2005) is used in our work.
Simultaneous fits of model atmospheres to all of the Balmer lines, in each of the ten white dwarfs discussed above, are presented in Figure 5 (top-right). Within each panel, the absorption lines of a given white dwarf are arranged with H at the bottom, and successive higher order transitions on top. The model fits are shown as smooth red curves and are excellent in all cases. We also confirmed that the two anomalous features, small spikes caused by bad sky subtraction in the H line of WD 00 and 29, do not affect the results of the fit. This line is least sensitive to changes in the gravity of the star. The output from the spectroscopic fits are the and log for each star, which we summarize in Table 2.
The masses of these ten stars () are simply calculated by combining the measured surface gravity of the stars with the well established mass-radius relation for white dwarfs. In general, most of the white dwarf masses are 0.5 with an uncertainty of 10%. We also estimate both the cooling ages, , and the theoretical luminosity of each star by interpolating the and log within evolutionary models similar to Fontaine, Brassard, & Bergeron (2001), but assuming a 50/50 carbon-oxygen core mix.333The models are available at http://www.astro.umontreal.ca/~bergeron/CoolingModels/. Our default calculations assume thick hydrogen layers with = = 10-4 and helium layers of = 10-2, and are summarized in Table 2 and discussed further below. We also tested the sensitivity of our results to models (e.g., Wood 1995) with pure carbon cores and to models with very thin hydrogen layers (e.g., = 10-10). The results from these comparisons, for both the final remnant masses and the theoretical luminosities, are identical to our default values within the measured uncertainties in these properties (which are small, see Table 2). We note, however, that the cooling ages of these bright, young white dwarfs are systematically larger in the pure C core models by 20 – 30%.
At the time of writing this paper, Tremblay & Bergeron (2009) have just presented the first results from an improved calculation of the Stark broadening of hydrogen lines in dense plasmas that are representative of white dwarf atmospheres. Their new results, including non-ideal effects, suggest that the masses measured through the spectroscopic technique require a slight upward revision of 0.034 . As the temperatures of the stars using the new calculations are also slightly hotter (e.g., 1,000 – 2,000 K), the luminosities are unaffected. The full implications of this study have not yet been investigated and the dependency of this offset on mass is not well constrained. In the results that follow, we have adjusted our default masses by 0.034 to be consistent with these new calculations (including the reported masses in Table 2). We have not corrected the individual and log values by a common offset (which would be approximately 1,500 K and 0.1 dex, respectively).
4.2. Testing the Uncertainties in : Synthetic Spectral Fits
The S/N of the ten white dwarfs in our sample is listed in column 8 of Table 2. This is calculated from the pseudo-continuum between the H and H Balmer lines, at 4030 . The pixel-to-pixel RMS scatter is converted to a S/N per resolution element by multiplying by the square root of the number of pixels per FWHM (six, in our case). The bulk of the stars have S/N = 40 – 50, although a few are as low as 30 and one object is above S/N = 60. Note, these S/N values should only be used as a relative ranking of the quality of each spectra, and are not indicative of the global S/N. We can see that, due to the throughput, the S/N decreases blueward of the wavelength at which we made this measurement.
In Figure 6 (top), we produce simulated white dwarf spectra over a range of S/N. These spectra have been convolved with a Gaussian profile with 6 FWHM. Directly comparing the quality of our data in Figure 5 to these simulated spectra, we can conclude that most of our objects are better than the S/N = 30 case, and similar, if not better, than the S/N = 40 case. For the latter, we generate a Monte-Carlo with 500 trials and fit each of these spectra in our fitting code. The prescription used in the fitting is identical to that for our actual white dwarfs, namely, the same models are used in the fit with five Balmer lines. The results from this test are shown in the middle panel of Figure 6. The input stellar parameters for the synthetic white dwarf are = 25,000 K, log = 7.80, and = 0.536 . From the distribution of recovered masses, we find = 0.54 with a dispersion of 0.06 . Therefore, we expect to measure the masses of our white dwarfs to roughly 10% precision based on this test, which agrees nicely with our reported uncertainties in mass (see Table 2, column 5). In the bottom panel of Figure 6, we extend the test above for other S/N values and plot the associated error from this fitting.

4.3. Establishing Cluster Membership
Thus far, we have established masses for ten white dwarfs in the M4 direction. As we have reported in previous spectroscopic studies of white dwarfs in star clusters, some fraction of the stars along these lines of sight are actually members of the field population and therefore need to be removed before discussing the mass distribution of bonafide members. The best method to establish such membership is through proper motion analysis, and we have such data from the HST overlap of a portion of our LRIS field (see Figure 2). Out of these ten white dwarfs, we can confirm that WD 00, 09, 20, and 24 are proper motion members (as are WD 16 and 23; these are rejected from our sample based on the poor quality of the recovered spectra and/or contamination from a nearby neighbor – see § 3). This is not a surprising result since the proper motions were folded into the selection process to target white dwarfs in the region of overlap with our HST field.
In addition to these five confirmed M4 white dwarfs, we note that the remaining objects in our sample closely follow the 0.5 cooling sequence, and are consistent in position in the CMD with the confirmed members. Although we do not have proper motions for these stars, some of them are likely members of M4. To distinguish members from non-members, we can use the theoretical luminosity of each star to calculate its distance modulus. Any stars that have significantly discrepant values from the known distance of M4, ()V = 12.51 0.09 (Richer et al., 2004), should be eliminated from our sample as they likely represent field white dwarfs along the line of sight, binary white dwarfs, or possibly objects for which the spectroscopic fit is incorrect due to some unknown artifact in the spectrum.

We compare the calculated distance modulus of each of our ten white dwarfs with the known M4 distance in Figure 7. The 1 uncertainty in the theoretical magnitude (i.e., from spectral fitting) is plotted as a horizontal bar for each star, and the mean distance of M4 and 2 uncertainties are indicated with the solid and dashed lines. We can use the proper motion members of the cluster as a rough guide to establish the expected scatter of known members in this diagnostic. The calculated distances of three of the four proper motion members of the cluster, WD 00, 20, and 24, are close to, but slightly larger than the distance of M4, whereas the fourth star (WD 09) appears to be 0.7 mags closer than the cluster. This object could therefore be a non-member that shares the proper motion of the cluster. Alternatively, if the object is a member, its overluminous nature may suggest an unresolved double degenerate in the cluster. We note that the mass derived from the spectrum of this star yields the unexpectedly high value of = 0.79 (see Table 2). Three additional white dwarfs are clearly members of the cluster, WD 04, 06, and 15, whereas three other stars WD 02, 05, and 29 are possibly field white dwarfs.
To summarize, our final secure sample of singly evolved, M4 member white dwarfs includes three objects that are proper motion members (WD 00, 20, and 24) and three objects which are on the cooling sequence and have the correct distance from spectral fitting (WD 04, 06, and 15).
4.4. Analysis of
Theory predicts that the masses of white dwarfs forming in old, population II systems such as globular clusters are expected to be in the range 0.51 0.55 (Renzini & Fusi Pecci, 1988; Renzini et al., 1996). As Table 2 indicates, the six single white dwarfs that we have confirmed as members of M4 have masses that range from 0.50 – 0.59 . The uncertainties in our mass measurements are all roughly the same, under 10%, and therefore the un-weighted mean mass of the sample of six white dwarfs is measured to be = 0.53 0.01 .
The present day temperature of these cooling remnants is also well measured from our data. There is a group of four stars in our sample with 22.6 ( = 10.1) and all have the same temperature, = 25,000 K. The two fainter stars, WD 00 and 20, are cooler than this group by about 5,000 K, as expected. The surface gravities, log , of all six stars are in the range log = 7.68 – 7.95. As mentioned earlier, the exact and log values have not been adjusted to reflect the small corrections required by the new Stark broadening calculations (Tremblay & Bergeron, 2009).
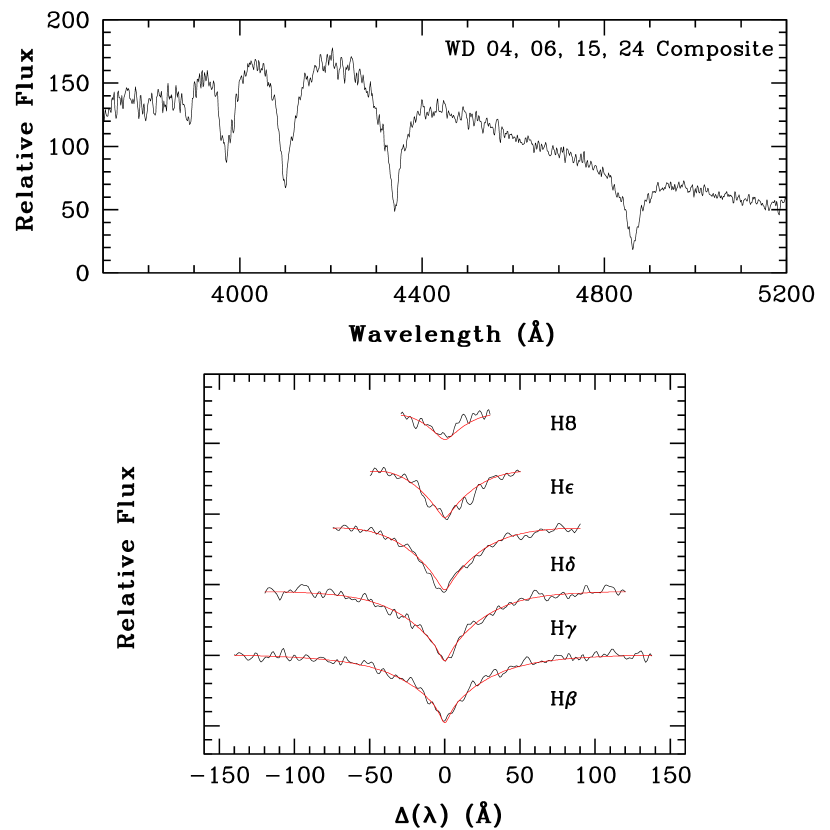
Our sampling of M4 cluster member white dwarfs in this study puts us in the fortunate situation of having characterized a group of four remnants at the same position on the CMD. Hansen et al. (2007) demonstrate that the mass difference between white dwarfs at the tip of the cooling sequence to those five magnitudes fainter at the limit of the HST study is only 0.1 . These four white dwarfs, WD 04, 06, 15, and 24, differ in luminosity by just 0.07 mag, and therefore should have the same mass, and have evolved from stars with the same progenitor mass. The expected temperature range in this group of four stars should only be 2%. As these differences are much smaller than our uncertainties, we can verify our mean mass measurement of M4 white dwarfs by creating a composite white dwarf spectrum, with very high S/N, from the coaddition of these individual spectra. Liebert et al. (1991) have shown that for unresolved double degenerate systems, the atmospheric parameters derived from assuming a single star are in fact an average of the parameters of both components of the system. Therefore, spectra with identical gravities should yield the same average gravity in a coaddition as compared to the true individual values.
Such a coaddition has the advantage that the resulting fit will be minimally influenced by any artifact affecting a given Balmer line in one spectrum (e.g., presence of a cosmic ray). This method has several disadvantages as well, for example, the spectral lines in the composite may be artificially blurred if the wavelength solution is not well determined in each of the individual spectra. We stress that this test is only intended as a verification of our results and should not be attempted in samples where the mass variation between individual white dwarfs is non-negligible (e.g., similar studies in younger clusters).
The composite spectrum from this analysis is shown in Figure 8 (top), and exhibits a S/N 100 at = 4030 . The Balmer lines in this spectrum are very accurately characterized; the resulting best fit model to the five lines is shown in the lower panel. The spectroscopic mass from the fit is measured to be = 0.54 0.02 , in excellent agreement with our findings above.
Overall, from our spectroscopic study of white dwarfs in M4, we can conclude that the mass of population II remnants forming today is = 0.53 and the temperature of stars presently at the tip of the white dwarf cooling sequence is = 25,000 K.
5. Stellar Evolution Theory
5.1. The Initial-Final Mass Relation
The mass distribution of white dwarfs in nearby open star clusters has been mapped since 1977 when Volker Weidemann compared theoretical models of mass loss (e.g., Fusi-Pecci & Renzini 1976) to the observed masses of a few remnants in the Hyades and Pleiades clusters (Weidemann, 1977). Since this pioneering work, similar mass measurements have been made for over 100 stars in a dozen open star clusters. A review of the earlier work is provided in Weidemann (2000) and a compilation of some more recent results is presented in Ferrario et al. (2005), excluding very recent studies by Dobbie et al. (2006); Williams & Bolte (2007); Kalirai et al. (2007, 2008); Williams, Bolte, & Koester (2009); Dobbie et al. (2009). The mass distribution of the remnants varies as a function of the turnoff mass of their parent cluster, suggesting that more massive progenitors produce more massive white dwarfs (see Salaris et al. 2009 for a detailed analysis of the present relation). New measurements by our team in three older star clusters with ages of a few Gyrs have recently permitted, for the first time, a purely empirical fit to the data without the need for a theoretical anchor at low masses (see below).
With the present study, we can once again extend the initial-final mass relation to new bounds. As the initial mass function in most (all?) stellar populations is bottom heavy, the characterization of mass loss from these low mass stars affects our understanding of stellar evolution for the bulk of all stars today. In Figure 9, we present all of the constraints to date at the low mass end of the relation, corrected by 0.034 from our previous reporting to reflect the new Stark broadening calculations (see § 4.1). The data includes the two confirmed cluster members in the 1.4 Gyr cluster NGC 7789 (Kalirai et al., 2008), the two white dwarfs in the 2.5 Gyr cluster NGC 6819 (Kalirai et al., 2008), the single carbon-oxygen core white dwarf in the 8.5 Gyr cluster NGC 6791 (Kalirai et al., 2007), and the six white dwarfs in M4 from this study. For the latter, we have fixed the progenitor mass to the expected mass at the turnoff in an old, metal-poor population, = 0.80 , with an adopted error of 0.05 .444The exact turnoff mass depends on the metallicity and age of the cluster, and the choice of theoretical model assumed. For example, for alpha-enhanced models with [Fe/H] = 1.1 and = 12.0 Gyr, the VandenBerg, Bergbusch, & Dowler (2006) models yield a turnoff mass of 0.82 . The data points for individual white dwarfs in these clusters are shown as open circles and binned averages of the population in each cluster are illustrated with larger, filled circles. For older clusters, all of the white dwarfs at the top of the cooling sequence evolved from progenitors just above the present day turnoff, and therefore we expect a single mass at the cooling sequence in a given cluster. Of course, in younger clusters, our spectroscopic measurements can include stars along the entire cooling sequence of the cluster and therefore there can be a large dispersion in white dwarf masses in a single cluster (e.g., NGC 2099, Kalirai et al. 2005 and NGC 2168, Williams, Bolte, & Koester 2009).

The low mass end of the initial-final mass relation in Figure 9 now contains a total of eleven data points, and shows a roughly linear decrease in white dwarf mass with initial mass, anchored at the extreme left end by the new M4 measurement, = 0.80 0.05 and = 0.53 0.01 . Given that the oldest observable stellar populations in the Universe are the same age as M4, this relation is now complete at the lower limit and can not be observationally extended further to lower masses. As discussed earlier, several predictions of stellar evolution theory have long suggested that the masses of population II white dwarfs forming today should be 0.51 0.55 (Renzini & Fusi Pecci, 1988; Renzini et al., 1996), and therefore our first direct measurement is in perfect agreement with these predictions. Based on our measurements, the total integrated post main-sequence mass loss of low mass stars in old population II systems will be 34%.
Theoretically, there is an expected lower limit to the masses of carbon-oxygen core white dwarfs. This is given by the mass of the stellar core at the first thermal pulse on the asymptotic giant branch, an evolutionary point before the core has had a chance to grow on the branch. This core mass has a very small dependency on the stellar metallicity. In Figure 9, we illustrate this expected core mass as a dashed curve (Girardi et al., 2000). Over the range of initial masses on this plot, the core mass is expected to remain roughly the same at = 0.52 , showing a flat relation for 1 – 2 . At 0.8 , our first observational constraint from a half dozen white dwarfs in this single star cluster suggests the actual remnant masses are just slightly larger than the minimum core mass (with a slight extrapolation). This implies that the progenitors of such low mass stars had just enough mass to experience thermal pulses on the asymptotic giant branch and that the cores of these stars will not grow appreciably during this evolution. As M4 is a typical population II system in terms of its old age and low metallicity, it is reasonable to assume that these trends may extend to stars that are presently in similar phases of stellar evolution both in the general field halo population and in other globular clusters with similar properties to M4.
5.2. The Dependence of Mass Loss on Metallicity
In addition to extending the initial-final mass mapping to lower masses, M4 represents the first star cluster with a significantly sub-solar metallicity in which white dwarf masses have been measured. The mean metallicity of the cluster is [Fe/H] = 1.10 (Marino et al., 2008), 13 times more metal-poor than the bulk of the open clusters used to define the relation and 40 times more metal-poor than the metal-rich system NGC 6791 ([Fe/H] = 0.40, Peterson & Green 1998). For this cluster, after accounting for the new Stark broadening calculations discussed earlier, Kalirai et al. (2007) actually measured a mean mass for nine white dwarfs of = 0.46 0.06 , much lower than expected. As they show, the bulk of these white dwarfs contain helium-cores, after evolving through a channel involving intense mass loss on the red giant branch, likely driven by the high metallicity of the cluster. The single data point shown in Figure 9 is based on the only clearly non He-core white dwarf in that sample, and does not affect the discussion above. However, the results from NGC 6791 suggest strong dependencies of mass loss on metallicity, especially at super-solar metallicities.
To date, we lack a good theoretical understanding of the dependence of post main-sequence mass loss on metallicity. The general expectation in evolutionary models is for more efficient transport of material outward from the star if the metallicity is higher, and therefore higher rates of mass loss. However, the exact treatment depends on the modeling of winds on the red giant branch and thermal pulses on the asymptotic giant branch (e.g., see Weidemann 2000 and Habing 1996), phases of stellar evolution that are poorly understood. As Catelan (2008) summarizes, mass loss prescriptions along the red giant branch alone show very different behaviors with metallicity. For example, over a 1 dex metallicity change from [Fe/H] = 1.0 to 0.0, the Mullan (1978) and Schröder & Cuntz (2005) laws predict that should increase by 0.05 whereas the Goldberg (1979) and Judge & Stencel (1991) laws suggest increases by 0.15 – 0.25 .
To qualitatively compare the dependence of mass loss in post main-sequence evolution with metallicity to these estimates, we can first parameterize the initial-final mass relation. The solid line in Figure 9 is a linear fit to the entire sample of open cluster white dwarf – main-sequence progenitor mass pairs from Kalirai et al. (2008),
The zero point of this relation has been adjusted to reflect a global offset of 0.034 in the white dwarf mass measurements, although the slope may in fact also be affected if the offset is found to vary with mass (see Figure 11 and 12 in Tremblay & Bergeron 2009). The bounds on this relation range from the oldest open cluster white dwarf in NGC 6791 to the youngest white dwarfs in the Pleiades, and therefore are = 1.1 – 6.5 . A small extrapolation of the empirical relation to the mass of the present day turnoff in M4 (e.g., 0.8 ) yields = 0.52 0.02 , which is therefore consistent (at 1) with our measured value of the masses of M4’s white dwarf population. These data therefore hint that mass loss rates have a weak or no dependence on metallicity, at least over the range extending from metal-poor populations such as M4 to roughly solar metallicity. Interestingly, we know from our study of NGC 6791 that mass loss rates are strongly correlated with metallicity at extremely high [Fe/H], and therefore this may lead to an interesting shape for the empirical mass loss – metallicity relation from white dwarf spectroscopy. Of course, stronger conclusions will benefit greatly from additional observations of clusters spanning a wide range of metallicities, especially at the metal-poor end. For completion, if we add our new data point for M4 to the initial-final mass relation and recalculate the best fit ignoring any possible metallicity-related biasses, we find a slightly shallower relation with = (0.101 0.006) + 0.463 0.018 .
Finally, we note that the metallicity of M4, [Fe/H] = 1.10, is only slightly more metal-rich than the global metallicity of both the stellar halo of the Milky Way ([Fe/H] = 1.6, = 0.6; Morrison et al. 2003) and M31 ([Fe/H] = 1.5, = 0.7; Kalirai et al. 2006). Assuming the dominant population in these galactic components is old (e.g., 10 Gyr), the same 34% stellar mass loss fraction should be representative of stars evolving in these populations. By directly inputing this mass loss into general stellar evolution models of similar age and metallicity (e.g., Girardi et al. 2000), we can add an important observational constraint to the modeling of light from the stellar halos of spiral galaxies using population synthesis techniques (e.g., Bruzual & Charlot 2003).
6. The Ages and Distances of Globular Clusters
In Section 1 we introduced the extensive HST observations that have defined some of the deepest CMDs ever measured, with any instrument (e.g., the HST Cycle 13 observations of NGC 6397 in Richer et al. 2008). Although these data sets have led to a wide range of astrophysical studies, the primary goal of the observations has aimed to accurately establish turnoff-independent white dwarf cooling ages for population II star clusters. In this respect, the present study serves to establish several of the input ingredients that are needed to make this measurement. For example, knowledge of the masses and spectral types of white dwarfs, and the initial-final mass relation, are all required to fully model an observed white dwarf cooling sequence (e.g., Hansen et al. 2004; 2007).
6.1. Specific Ingredients for Accurate Age Measurements
For M4, two recent studies have modeled the white dwarf cooling sequence using independent data sets, and both have concluded with similar ages (however, see discussion below). First, Hansen et al. (2004) used a full 2-D treatment of the white dwarf cooling sequence in the observed HST WFPC2 CMD (i.e., luminosity and color information are used), and just recently, Bedin et al. (2009) have used a more simplified technique of age dating based solely on the luminosity function in newer and deeper ACS data. An analysis of these studies illuminates several interesting choices relative to the findings in this paper:
-
•
The present day mass of cluster white dwarfs forming today sets the normalization for the masses along the entire cooling sequence. In their modeling, Hansen et al. (2004) assume the mass at the tip to be 0.55 and Bedin et al. (2009) assume 0.54 . As we have shown, the actual mass of white dwarfs at the bright end of the cooling sequence is only slightly lower at 0.53 , and therefore the mass distribution (and hence cooling rates) along the entire cooling sequence are not very different from the assumptions in these studies.
-
•
Hydrogen (DA) and helium (DB) atmosphere white dwarfs have different cooling rates, and so the fraction of stars cooling with these spectral types leads to structure in the luminosity and color function that must be modeled correctly to infer the age of the population from white dwarf cooling theory. For M4, NGC 6397, and NGC 6752, spectroscopy of the white dwarf cooling sequence indicates that 100% of the stars at the bright end have hydrogen atmospheres (see Moehler et al. 2004 and Davis et al. 2009). Hansen et al. (2004) treated the fraction of DB white dwarfs as a free parameter and found the best fit to yield an upper limit of 40% (good fits were obtained as long as more than 60% of the white dwarfs are DA), whereas Bedin et al. (2009) choose an arbitrary value of 30% (e.g., the field disk ratio).
-
•
The initial-final mass relation is required to properly evolve the progenitor stars on to the white dwarf cooling sequence. The normalization and form of the initial-final mass relation adopted in both of these studies (e.g., Wood 1992), is based on empirical constraints from solar metallicity data points at higher masses, and a theoretical anchor at low masses. This can now be updated to our new result given earlier.
We encourage future theoretical modeling efforts to make full use of this new information in their analysis, preferably on the newer ACS imaging data of M4. Of course, the white dwarf models themselves should also be updated with new physical insights. For example, the contribution to the opacity of cool white dwarfs from the far red wing of the Ly line (Kowalski 2007) alone can yield ages of globular clusters (e.g., NGC 6397) that are higher by 0.5 Gyr (Kowalski 2007; B. Hansen 2009, private communication).
6.2. A Closer Look at M4’s White Dwarf Cooling Age:
Model and Distance Uncertainties
We noted above that the Hansen et al. (2004) and Bedin et al. (2009) studies concluded with similar white dwarf cooling ages for M4. Formally, Hansen et al. (2004) reported an age of 12.1 Gyr (2 lower limit of 10.3 Gyr) and Bedin et al. (2009) measured an age of 11.6 0.6 Gyr (internal errors). A deeper look at these two studies suggests they are, in fact, grossly inconsistent with one another given differences in white dwarf cooling models and uncertainties in the cluster distance modulus. As our present work is closely linked to obtaining very accurate absolute age measurements of globular clusters (through the study of white dwarfs), we briefly summarize these two studies below and highlight the respective assumptions and differences that are being made.
In the Hansen et al. (2004) study, the authors compare their data to three sets of models and adopt a distance to M4 based on the well established technique of subdwarf distance fitting. They find = 1.73 0.10 kpc for M4 (e.g., Richer et al. 1997), which is identical to independent distance measurements for the cluster from the Baade-Wesselink distance using the M4 RR Lyrae stars ( = 1.73 0.01 kpc, Liu & Janes 1990) and from astrometry ( = 1.72 0.14 kpc, Peterson et al. 1995). At present, it appears the latter estimate is the most secure. For the subdwarf measurement, the comparison was based on pre-Hipparcos parallaxes, and for some other clusters, a calculation with post-Hipparcos parallaxes indicates a longer distance by 0.2 mags than initially estimated (Gratton et al. 1997). Similarly, the Baade-Wesselink method yields luminosities for M4’s RR Lyrae stars that are fainter by 0.2 mags as compared to the –[Fe/H] relation derived by Gratton et al. (1997) for clusters with low extinction (using post-Hipparcos main-sequence fitting techniques). Unfortunately, re-deriving the distance to M4 using any photometric technique is problematic given the very high extinction along the line of sight ( 1), the variation in across the face of the cluster, and the non-standard shape of the extinction curve along this line of sight (which passes through the Scorpius-Ophiucus dark cloud complex – Vrba, Coyne, & Tapia 1993). Irrespective of the adopted distance (although see below), Hansen et al. (2004) find that the white dwarf cooling age they derive for M4 from their own models (e.g., Hansen 1999) is consistent with that measured using the Chabrier et al. (2000) models, however they rule out the Salaris et al. (2000) models which yield ages that are older than the Universe. Therefore, this suggests that, for the same distance modulus and data set, simply changing the white dwarf model yields an absolute age difference of 2 Gyr.
In the recent Bedin et al. (2009) study, the authors use only the Salaris et al. (2000) white dwarf models, and still conclude with an age similar to that derived by Hansen et al. (2004). The difference is actually reflected in the distance to M4; Bedin et al. (2009) use a much larger (i.e., 15%) value of = 1.98 kpc. This value is formally inconsistent with the three independent studies above. Bedin et al. (2009) measure the distance to M4 by simply fitting a single isochrone of approximately the correct metallicity to the turnoff and horizontal branch. In principle, this method can of course yield the distance to any stellar population with a measured turnoff, however it has almost always been avoided for a large number of reasons. First, and most importantly, there are uncertainties in both the microphysics built into the stellar evolution models (e.g., opacities, equation of state effects, and nuclear reaction rates) and in the treatment of processes that do not come from first principles (e.g., convection, core-rotation, diffusion, gravitational settling, etc.).555VandenBerg, Stetson, & Bolte (1996) present a detailed discussion of these effects on stellar evolution models. Because of these unknowns, simply adopting an isochrone from another groups’ models would lead to a different measured distance modulus for the cluster (e.g., different models predict different horizontal branch luminosities). Second, such comparisons of data and models to yield distances require transformation of the model from the theoretical to the observational plane, resulting in another source of error. Finally, in this specific case, this comparison does not alleviate any of the aforementioned uncertainties related to our lack of knowledge of the reddening and extinction along this line of sight. In the end, the application of the Salaris et al. (2000) models and the longer distance modulus derived by Bedin et al. (2009) effectively offset each other, yielding a derived age similar to that of Hansen et al. (2004).
Summarizing, there are clearly both intrinsic differences in white dwarf models calculated by different groups and there is a lack of consensus on the correct distance to M4. For the former, increased testing of the white dwarfs models on star clusters with well known fundamental parameters (e.g., distance, metallicity, and foreground reddening) are sure to resolve the correct prescriptions. For the latter, it appears that only the Peterson, Rees, & Cudworth (1995) astrometric measurement is free of the unknown reddening and extinction laws along this line of sight, and therefore should be preferred. Until these differences are unambiguously resolved (e.g., the Space Interferometry Mission could directly measure the distance to M4 to within a few percent), the error budget from these uncertainties will remain large and the new physical constraints on masses, spectral types, and the initial-final mass relation are secondary to the analysis. Of course, if the properties of bright white dwarfs in other population II systems are similar to M4, the new results can have immediate significance on those studies. This is especially exciting given the remarkable data set that has been presented for NGC 6397 by Richer et al. (2008) and will soon be available for 47 Tuc (H. Richer, Cycle 17 ACS/WFC3 Proposal GO-11677).
6.3. White Dwarfs as Standard Candles
The mass measurement of white dwarfs in a globular cluster provides important leverage to the use of these stars as distance calibrators. Although the white dwarf cooling sequence is fainter than the bright part of the main-sequence in a star cluster, uncovering the sequence can offer several advantages over canonical techniques involving main-sequence distance fitting. For example, the location of the bulk of the white dwarf cooling sequence in a CMD does not depend on the metallicity or age of the population, or on any of the other systematics that plague main-sequence evolution (e.g., convection theory). However, the location does depend on mass (e.g., Wood 1995), with a 0.1 difference translating to a (mag) = 0.25 shift (i.e., a 12% distance offset). So, first, a simple offset can now be calculated to correct the location of any local calibrating sample of white dwarfs with parallax measurements (usually 0.60 for field white dwarfs) to the expected location of 0.53 stars. Following this, a straightforward comparison with the apparent luminosity of the globular cluster white dwarf cooling sequence can yield the distance to the population (e.g., see Renzini et al. 1996). Unfortunately, it is difficult to actually make this measurement and independently derive the distance of M4 given the aforementioned uncertainties in the slope of the extinction curve along this line of sight. However, the true distances of other clusters with well constrained reddenings and extinctions can be easily calculated from their cooling sequences and the new mass measurements.
7. Summary
We have presented the first directly determined spectroscopic mass measurements of white dwarfs that are known to be population II members. Our measurements suggest that the final remnant mass at the tip of the white dwarf cooling sequence in the globular cluster M4 is = 0.53 0.01 , in nice agreement with expectations based on stellar evolution theory. These results suggest that low mass population II stars will lose 34% of their mass through post main-sequence stellar evolution. If, in fact, all Milky Way globular clusters have the same age, then this mass loss rate should be applicable to the evolution of stars in all but the most metal-rich Galactic globular clusters. We use this measurement to first extend the initial-final mass relation of stars to the lowest possible limit, given the age of the Universe. This single observation also hints that mass loss rates are not significantly different for metal poor stars when compared to solar metallicity stars of the same mass. Finally, we offer several pieces of new input that are required to measure more accurate white dwarf cooling ages of globular clusters in the Galactic halo.
Imaging observations of globular clusters with ground and space based telescopes have now uncovered thousands of white dwarfs in population II clusters (e.g., see Figure 1). The science that results from these purely photometric surveys is greatly enhanced with spectroscopic follow up, which we have shown can yield the spectral types of the remnants (Davis et al., 2009), the mapping of initial to final mass, and the mass at the tip of the observed cooling sequence (and therefore a calibration for the masses along the entire cooling sequence). All of the nearest globular clusters are in the southern hemisphere, and given their larger distances compared to M4, an extension of this work to these systems will require superior blue sensitivity and throughput, and much larger allocations of spectroscopic time on 8-meter class telescopes (e.g., see Moehler et al. 2004). Future white dwarf spectroscopy in these clusters will benefit greatly from a 30-m telescope with a multiobject spectrograph with the bluest sensitivity. Such a telescope would not only allow a direct measurement of the mass loss rates in an expanded set of open and globular clusters, but would permit the first initial-final mass relations to be built from observations of a set of white dwarfs in a single cluster. Deep spectroscopy of white dwarfs over a range in luminosity (and therefore mass) can be engaged in a given cluster, minimizing the systematics introduced by metallicity variations in samples of clusters. Fortunately, the nearest three globular clusters also sample a wide range in metallicity (e.g., a factor of 20 from NGC 6397 at [Fe/H] = 2.0 to 47 Tuc at [Fe/H] = 0.7), and therefore the dependence of mass loss on metallicity can be probed in detail with such observations.
Appendix A Snapshot Figures of All White Dwarf Candidates

References
- Barstow et al. (2005) Barstow, M. A., Bond, H. E., Holberg, J. B., Burleigh, M. R., Hubeny, I., & Koester, D. 2005, MNRAS, 362, 1134
- Bedin et al. (2009) Bedin, L. R., Salaris, M., Piotto, G., Anderson, J., King, I. R., & Cassisi, S. 2009, ApJ, in press, arXiv:0903.2839
- Bergeron, Saffer, & Liebert (1992) Bergeron, P., Saffer, R. A., & Liebert, J. 1992, ApJ, 394, 228
- Bergeron, Liebert, & Fulbright (1995) Bergeron, P., Liebert, J., & Fulbright, M. S. 1995, AJ, 444, 810
- Brodie & Strader (2006) Brodie, J. P., & Strader, J. 2006, ARA&A, 44, 193
- Bruzual & Charlot (1993) Bruzual, G. A., & Charlot, S. 1993, ApJ, 405, 538
- Calamida et al. (2008) Calamida, A. et al. 2008, ApJ, 673, L29
- Catelan (2008) Catelan, M. 2008, IAU Symposium 258, —, arXiv:08112947
- Chabrier et al. (2000) Chabrier, G., Brassard, P., Fontaine, G., & Saumon, D. 2000, ApJ, 543, 216
- Davis et al. (2008) Davis, D. S., Richer, H. B., Anderson, J., Brewer, J., Hurley, J., Kalirai, J. S., Rich, R. M., & Stetson, P. B. 2008, AJ, 135, 2155
- Davis et al. (2009) Davis, D. S., et al. 2009, ApJ, submitted
- Dobbie et al. (2006) Dobbie, P. D., Napiwotzki, R., Burleigh, M. R., Barstow, M. A., Boyce, D. D., Casewell, S. L., Jameson, R. F., Hubeny, I., & Fontaine, G. 2006, MNRAS, 369, 383
- Dobbie et al. (2009) Dobbie, P. D., Napiwotzki, R., Burleigh, M. R., Williams, K. A., Sharp, R., Barstow, M., Casewell, S. L., & Hubeny, I. 2009, MNRAS, in press, arXiv:0902.4259
- Eisenstein et al. (2006) Eisenstein, D. J., et al. 2006, ApJS, 167, 40
- Ferrario et al. (2005) Ferrario, L., Wickramasinghe, D., Liebert, J., & Williams, K. A. 2005, MNRAS, 361, 1131
- Fontaine, Brassard, & Bergeron (2001) Fontaine, G., Brassard, P., & Bergeron, P. 2001, PASP, 113, 409
- Fusi-Pecci & Renzini (1976) Fusi-Pecci, F., & Renzini, A. 1976, A&A, 46, 447
- Girardi et al. (2000) Girardi, L., Bressan, A., Bertelli, G., & Chiosi, C. 2000, A&AS, 141, 371
- Goldberg (1979) Goldberg, L. 1979, Royal Astronomical Society, Quarterly Journal, 20, 361
- Gratton et al. (1997) Gratton, R. G., Fusi Pecci, F., Carretta, E., Clementini, G., Corsi, C. E., & Lattanzi, M. 1997, ApJ, 491, 749
- Habing (1996) Habing, H. J. 1996, ARA&A, 7, 97
- Hansen (1999) Hansen, B. M. S. 1999, ApJ, 520, 680
- Hansen et al. (2002) Hansen, B. M. S., et al. 2002, ApJ, 574, L155
- Hansen et al. (2004) Hansen, B. M. S., et al. 2004, ApJS, 155, 551
- Hansen et al. (2007) Hansen, B. M. S., et al. 2007, ApJ, 671, 380
- Holberg, Bergeron, & Gianninas (2008) Holberg, J. B., Bergeron, P., & Gianninas, A. 2008, AJ, 135, 1239
- Judge & Stencel (1991) Judge, P. G., & Stencel, R. E. 1991, ApJ, 371, 357
- Kalirai et al. (2005) Kalirai, J. S., Richer, H. B., Reitzel, D., Hansen, B. M. S., Rich, R. M., Fahlman, G. G., Gibson, B. K., & von Hippel, T. 2005, ApJ, 618, L123
- Kalirai et al. (2006) Kalirai, J. S., et al. 2006, ApJ, 648, 389
- Kalirai et al. (2007) Kalirai, J. S., Bergeron, P., Hansen, B. M. S., Kelson, D. D., Reitzel, D. B., Rich, R. M., & Richer, H. B. 2007, ApJ, 671, 748
- Kalirai et al. (2008) Kalirai, J. S., Hansen, B. M. S., Kelson, D. D., Reitzel, D. B., Rich, R. M., & Richer, H. B. 2008, ApJ, 676, 594
- Kawaler (1991) Kawaler, S. D. 1991, in Confrontation between Stellar Pulsation and Evolution, ed. C. Cacciari & G. Clemintini (ASP Conf. Ser., 11), 494
- Kepler et al. (2007) Kepler, S. O., Kleinman, S. J., Nitta, A., Koester, D., Castanheira, B. G., Giovannini, O., Costa, A. F. M., & Althaus, L. 2007, MNRAS, 375, 1315
- Kowalski (2007) Kowalski, P. M. 2007, A&A, 474, 491
- Krauss & Chaboyer (2003) Krauss, L. M., & Chaboyer, B. 2003, Science, 299, 5603
- Liebert et al. (1991) Liebert, J., Bergeron, P., & Saffer, R. A. 1991, in Proceedings of the 7th European Workshop on White Dwarfs, NATO ASI Series, eds. G. Vauclair & E. M. Sion (Dordrecht: Kluwer), 409
- Liebert, Bergeron, & Holberg (2005) Liebert, J., Bergeron, P., & Holberg, J. B. 2005, ApJS, 156, 47
- Liu & Janes (1990) Liu, T., & Janes, K. A. 1990, ApJ, 360, 561
- Marino et al. (2008) Marino, A. F., Villanova, S., Piotto, G., Milone, A. P., Momany, Y., Bedin, L. R., & Medling, A. M. 2008, A&A, 490, 625
- Moehler et al. (2004) Moehler, S., Koester, D., Zoccali, M., Ferraro, F. R., Heber, U., Napiwotzki, R., % Renzini, A. 2004, A&A, 420, 515
- Monelli et al. (2005) Monelli, M., et al. 2005, ApJ, 621, L117
- Morrison et al. (2003) Morrison, H. L., et al. 2003, AJ, 125, 2502
- Mullan (1978) Mullan, D. J. 1978, ApJ, 226, 151
- Oke et al. (1995) Oke, J. B., et al. 1995, PASP, 107, 375
- Pauli et al. (2006) Pauli, E.-M., Napiwotzki, R., Heber, U., Altmann, M., & Odenkirchen, M. 2006, A&A, 447, 173
- Peterson & Green (1998) Peterson, R. C., & Green, E. M. 1998, ApJ, 502, L39
- Peterson, Rees, & Cudworth (1995) Peterson, R. C., Rees, R. F., & Cudworth, K. M. 1995, ApJ, 443, 124
- Reid (1996) Reid, I. N. 1996, AJ, 111, 2000
- Renzini & Fusi Pecci (1988) Renzini, A., & Fusi Pecci, F. 1988, ARA&A, 26, 199
- Renzini et al. (1996) Renzini, A., Bragaglia, A., Ferraro, F. R., Gilmozzi, R., Ortolani, S., Holberg, J. B., Liebert, J., Wesemael, F., & Bohlin, R. C. 1996, ApJ, 465, L23
- Richer et al. (1997) Richer, H. B. et al. 1997, ApJ, 484, 741
- Richer et al. (2004) Richer, H. B. et al. 2004, AJ, 127, 2771
- Richer et al. (2008) Richer, H. B. et al. 2008, AJ, 135, 2141
- Rubin et al. (2008) Rubin, K. H. R., Williams, K. A., Bolte, M., & Koester, D. 2008, AJ, 135, 2163
- Salaris et al. (2000) Salaris, M., Garcia-Berro, E., Hernanz, M., Isern, J., & Saumon, D. 2000, ApJ, 544, 1036
- Salaris et al. (2009) Salaris, M., Serenelli, A., Weiss, A., & Miller Bertolami, M. 2009, ApJ, 692, 1013
- Schröder & Cuntz (2005) Schröder, K.-P., & Cuntz, M. 2007, A&A, 465, 593
- Stetson (1994) Stetson, P. B. 1994, PASP, 106, 250
- Tremblay & Bergeron (2009) Tremblay, P.-E., & Bergeron, P. 2009, ApJ, 696, 1755
- VandenBerg, Stetson, & Bolte (1996) VandenBerg, D. A., Stetson, P. B., & Bolte, M. 1996, ARA&A, 34, 461
- VandenBerg, Bergbusch, & Dowler (2006) VandenBerg, D. A., Bergbusch, P. A., & Dowler, P. D. 2006, ApJS, 162, 375
- Vrba, Coyne, & Tapia (1993) Vrba, F. J., Coyne, G. V., & Tapia, S. 1993, AJ, 105, 1010
- Weidemann (1977) Weidemann, V. 1977, A&A, 59, 411
- Weidemann (2000) Weidemann, V. 2000, A&A, 363, 647
- Williams & Bolte (2007) Williams, K. A, & Bolte, M. 2007, AJ, 133, 1490
- Williams, Bolte, & Koester (2009) Williams, K. A., Bolte, M., & Koester, D. 2009, ApJ, 693, 355
- Wood (1992) Wood, M. A. 1992, ApJ, 386, 539
- Wood (1995) Wood, M. A. 1995, Proceedings of the 9th European Workshop on White Dwarfs Held at Kiel, Germany, 29 August - 1 September 1994. Lecture Notes in Physics, 443, edited by Detlev Koester and Klaus Werner. Springer-Verlag, Berlin Heidelberg New York, 41