High-energy excitonic effects in graphite and graphene
Abstract
We present ab initio many-body calculations of the optical absorption in bulk graphite, graphene and bilayer of graphene. Electron-hole interaction is included solving the Bethe-Salpeter equation on top of a GW quasiparticle electronic structure. For all three systems, we observe strong excitonic effects at high energy, well beyond the continuum of transitions. In graphite, these affect the onset of transitions. In graphene, we predict an excitonic resonance at 8.3 eV arising from a background continuum of dipole forbidden transitions. In the graphene bilayer, the resonance is shifted to 9.6 eV. Our results for graphite are in good agreement with experiments.
pacs:
71.35.-y, 71.35.Cc, 78.20.Bh, 78.40.-qGraphene, a recently discovered 2D hexagonal crystal carbon sheet Novoselov , has attracted much interest due to its exotic electronic properties. The comparison with ordinary 3D graphite, the ABA stacking of graphene layers with weak inter-layer interactions, gives further insights, as screening effects and effective 2D confinement are modified there. Both systems share a peculiar semi-metallic character together with a strong electronic anisotropy, giving rise to optical properties of particular interest, especially in view of technological applications in opto-electronics optoelectronics . More generally, also in astrophysics, accurate determination of optical absorption of carbon structures is fundamental Papoular .
The optical absorption of graphite was experimentally determined by reflectance TaftPhilipp ; KluckerSkibowski as well as by energy-loss via Kramers-Krönig Zeppenfeld ; TosattiBassani ; Venghaus ; Buchner , showing important anisotropy effects between measurements using polarizations parallel or perpendicular to the crystallographic c axis. Optical properties of graphene are under current experimental investigation graphene-opt ; Nair ; Mak . A first theoretical JDOS (joint density of states) calculation PastoriParra , based on an independent particle picture and usual selection rules, has shown, that the optical absorption spectrum of graphite can be divided in two regions: the visible range from 0 eV up to 5 eV originates from transitions among bands, whereas the region beyond 10 eV is made of band transitions. Ab initio calculations beyond JDOS and in the RPA approximation have been done on graphite AhujaAuluck and graphene, also including local-field effects Marinopoulos .
In this work, we extend previous theoretical results AhujaAuluck ; Marinopoulos beyond RPA by including electron-electron (e-e) and electron-hole (e-h) interactions. Our calculations are based on the many-body ab initio GW and Bethe-Salpeter equation (BSE) approach OnidaReining . We study bulk graphite, free-standing graphene, and a bilayer of graphene, considering both polarizations. With respect to Ref. Cohen&Louie which is restricted to the low-energy range, our work extends also to high energies.
We observe strong excitonic effects at unusual high energies, well beyond the continuum of - transitions. In graphite, excitonic effects strengthen the low energy part of the - structure and reshape it. Both, in the perpendicular and in the parallel polarization, our spectra are in very good agreement with experiment, in particular with Ref. Venghaus . In graphene, we predict an intense peak at 8.3 eV that we interpret as an excitonic resonance arising from a background single-particle continuum of dipole forbidden transitions. In the bilayer the resonance remains, but it is shifted to 9.6 eV due to reduced confinement and increased screening. Measuring optical spectra, this feature could thus be used as a fingerprint to discriminate between graphene and multi-layer graphene.
Our GW and BSE calculations OnidaReining are based on ground state calculations using density-functional theory in the local-density approximation (DFT-LDA). Starting from the Kohn-Sham DFT electronic structure, we calculate an ab initio GW quasiparticle electronic structure that takes into account e-e many-body interactions. In order to include e-h interactions in the response functions, we solve the Bethe-Salpeter equation for the two-particle correlation function ,
| (1) |
where is the GW Green’s function, and is the BSE kernel. We have used the approximation , where is the Coulomb and the screened interaction. As described in Ref. OnidaReining , we define , and remap the BSE, Eq. (1), into a 2-particle Schrödinger equation
| (2) |
where represent the excitation energies including the e-h interaction effects, and the excitonic wavefunctions. We diagonalize Eq. (2) working with a basis of Kohn-Sham bilinears, where () runs on valence (conduction) bands, and lies in the 1st Brillouin zone. The macroscopic dielectric function is then given by
The ground-state DFT-LDA and the GW corrections have been calculated using the ABINIT code. In the case of the bilayer and of graphene, the layers are isolated by 38 Bohr of vacuum, distance large enough to avoid spurious interactions between replicas. We used Martins-Trouiller pseudopotentials with s and p electrons in the valence. The BSE calculation was carried out by the EXC code. For graphite, the Brillouin zone was sampled with a (8 8 5) Monkhorst-Pack k-point grid shifted by (0.01, 0.02, 0.03), whereas a (16 16 1) shifted grid was used for both graphene and bilayer. Wavefunctions have been represented using 967 plane waves (39 Ry) for graphite and 1367 (24 Ry) for the bilayer and graphene, while the dimension of the kernel was 53 (graphite) and 287 (bilayer and graphene) plane waves (8 Ry). We included all and occupied bands, i.e. 8 in graphite and the bilayer, 4 in graphene. And 13 empty bands in graphite, 25 in the bilayer and 21 in graphene. We also used the DP code to obtain random-phase approximation (RPA) spectra. Local-field effects have been taken into account, both in RPA, and in BSE calculations. All theoretical curves have been convoluted by a Lorentzian with a quadratic width (Fermi liquid-like lifetime behavior) to introduce the intrinsic quantum broadening, together with a Gaussian broadening adapted for the presumed experimental energy resolution.
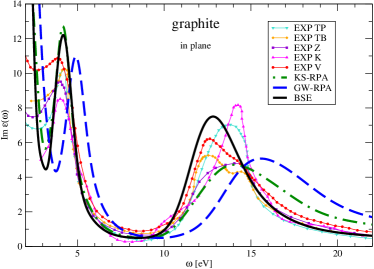
Graphite, in-plane polarization: The calculated imaginary part of the macroscopic dielectric function, directly associated with the absorption spectra, is shown in Fig. 1 for graphite in the polarization. The Kohn-Sham RPA (KS-RPA) spectra reproduces previous theoretical results Marinopoulos calculated using a denser grid of k-points. Local-field (LF) effects are expected to be small since the in-plane electronic density of graphene is almost homogeneous Marinopoulos . Indeed, spectra with and without LF coincide for this polarization. The position of the lowest energy 4.2 eV peak of the KS-RPA spectra is exactly the same as in all the considered experiments. On the other hand, the position of the highest energy structure due to is compatible with only some of the experiments.
The inclusion of e-e GW effects globaly shifts the spectrum to higher energies. The shift however is not rigid. GW corrections are less effective on bands closer to the Fermi energy around K, but they increase with energy, and correct the band-gap underestimation of the DFT-LDA electronic structure, for example at and L, resulting in an increased agreement with photoemission experiments. However, concerning optical absorption, the agreement with the experiment (see Fig. 1) gets worse when passing from KS-RPA to GW. For example, the KS-RPA main structure at 14 eV has been shifted to 15.3 eV by GW corrections, at least 1.3 eV off from the experimental position, and, similar, also the lowest energy structure around 4 eV, shifted by 0.7 eV.
The inclusion of e-h interaction effects via BSE seems to compensate e-e effects, restoring a good agreement with experiment, similar to the KS-RPA result. The low energy peak position agrees with all five considered experiments, although the height and the shape differ somehow. The position of the high energy peak recovers a position at smaller energy than the KS-RPA peak. Its profile is slightly reshaped, with a strengthening of the peak, particulary on the low-energy side. With respect to KS or GW-RPA, the peak position appears now to be at 12.8 eV. A fine analysis reveals a main excitonic energy at 12.6 eV, together with two other main excitation energies at 13.3 and at 13.7 eV. The latter should conjure an asymmetric, slower drop on the right shoulder of the peak. Unfortunatly, there is some disagreement between experimental spectra in this high energy region measured by different techniques TaftPhilipp ; KluckerSkibowski ; Zeppenfeld ; TosattiBassani ; Venghaus , mostly energy-loss and reflectivity measurements, and the position of the high-energy peak varies between 12.6 and 14.3 eV. The position of the peak of our BSE calculation is more in agreement with the results of Venghaus Venghaus and also Tosatti and Bassani TosattiBassani , both at 12.6 eV and both measured by energy-loss, which do not suffer from surface effects that tamper the bulk result for reflection experiments. The shoulder observed at eV could correspond to our excitation at 13.7 eV, although the imposed broadening (linear Gaussian with ) makes it less evident in the figure. The agreement of our result with the optical experiment of Taft and Philipp TaftPhilipp is still acceptable, but worsens when comparing with Zeppenfeld Zeppenfeld (peak at 14 eV) and in particular with Klucker et al. KluckerSkibowski (peak at 14.3 eV), measured via X-ray absorption. Comparing BSE with GW, it is remarkable that excitonic effects are stronger in the high-energy range of the spectrum rather than in the lower one, in contrast to ordinary semiconductors or insulators where excitonic effects mainly affect the lowest energy part of optical spectra, or to metals, where excitonic effects are in general negligible.
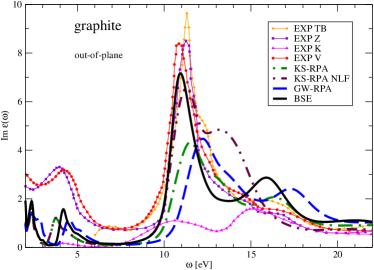
Graphite, out-of-plane polarization: Previous conclusions are further confirmed by the results for the polarization (Fig. 2). As already found in Ref. Marinopoulos , LF effects are stronger in the out-of-plane case, as it is evident comparing Kohn-Sham RPA with and without LF. Both curves are in agreement with previous theoretical results AhujaAuluck ; Marinopoulos . The KS-RPA with LF curve is again in fair agreement with the experiment. The position of the eV low energy peak is quite accurate, the main peak at eV not far from the experiment, the last peak at eV and a shoulder at eV in correspondence with experimental features. Again, the inclusion of e-e GW interaction effects causes a blue shift of up to 1 eV and worsens the agreement with the experiment. The improvement appears only when including also e-h interaction effects (BSE). The peak at low energy is now between the KS-RPA and the GW-RPA peaks, at exactly 4.2 eV, in agreement with experiment, especially with Venghaus Venghaus . The main peak instead red-shifts beyond the KS-RPA by 0.6 eV and is placed at 10.9 eV, again in good agreement with Venghaus (10.8 eV) and at lower energy with respect to Zeppenfeld Zeppenfeld and Tosatti and Bassani TosattiBassani (both at 11.3 eV). With respect to KS-RPA and GW, e-h effects also enhance the peak, and improve the agreement with the experiment on the magnitude. The higher energy peak gets restored at the KS-RPA position with a slight improvement on the position, but a worsening in intensity. The eV shoulder, still evident in KS-RPA, has been washed out by the strengthening of the neighbor main peak and is no longer visible. Our actual BSE calculation supports the scenario supposed for many-body effects by Ref. Marinopoulos .
With respect to experiment, in the case of out-of-plane polarization, the situation is similar to the in-plane polarization. The BSE result is in particular in good agreement with Venghaus Venghaus , but also with Tosatti and Bassani TosattiBassani and Zeppenfeld Zeppenfeld , but disagrees with Klucker et al. KluckerSkibowski . However, apart from the peak positions, the agreement with the experiment can be improved concerning peak intensities. In particular the low-energy part of the spectrum, due to interlayer interactions, still seems to be underestimated. There is also a slight underestimation on the main peak, although for this polarization we used less broadening () than in the in-plane polarization.
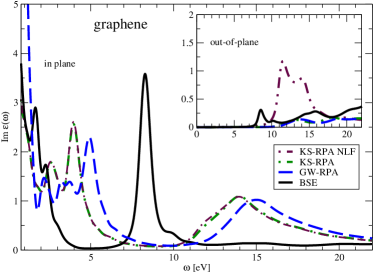
Graphene: In graphene (Fig. 3), due to its effective 2D dimensionality, LF effects become the most important effects for the out-of-plane polarization. As already found in Ref. Marinopoulos , for , LF effects produce a complete suppression of spectra due to a depolarization effect (compare KS-RPA with and without LF curves in the inset of Fig. 3). The 2D selection rules PastoriParra forbid transitions (10 eV), allowing ones instead. Nevertheless, the strong anisotropy increases the LF effects suppressing the latter transitions as well. On the other hand, LF effects are negligible in-plane (Fig. 3). In graphene as in graphite, GW e-e interaction effects produce a eV blue shift of the KS spectrum. Both the peak at 4 eV and the peak at 14 eV are shifted around eV. In graphene, however, the inclusion of e-h interaction turns out to cause a much more spectacular effect. The spectrum is completely reshaped. Surprisingly, at eV, as well as at eV, there is not anymore any oscillator strength. The RPA peaks disappear completely. Most of the spectral weight is pushed to very low energies, eV. However, unexpectedly, a strong peak rises up at 8.3 eV in the region where single-particle oscillator strengths were vanishing. This excitonic resonance arises from a background single-particle continuum of dipole forbidden transitions. An analysis over the excitonic oscillator strengths relative to the most intense excitonic eigenvalue indicates that the strong excitonic resonance is conjured by an extended mixing of transitions over a large energy range, from 12.5 to 17 eV. An excitonic effect at so large distance in energy (8.3 vs 12.5-17 eV) is caused by the increased e-h interaction due to reduced screening in graphene. Since we do not have any absorption spectrum experiments in graphene for comparison, we maintained the broadening at the minimum level to highlight these effects. Depending on the experimental energy resolution, this peak could appear more broadened, but does not affect the peak position at eV, and a slight right asymmetry. We note that inclusion of band 2 in the BSE is the only crucial ingredient to start to conjure the high energy excitonic resonance, whereas the eV Cohen&Louie energy region is very sensitive to the total number of bands, the dimension of the BSE kernel, and the vacuum distance between graphene layers.
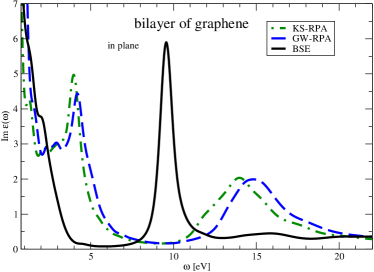
Bilayer: Similar to graphene, an excitonic resonance also occurs for the graphene bilayer (Fig. 4), however, at larger energy, 9.6 eV. The difference is due to the increased screening with respect to graphene, which reduces e-h interaction strength. With respect to graphene, RPA spectra appear different at low energy due to interlayer effects. However, also here, e-h interaction effects sweep the region at 5 eV, and push the oscillator strength towards lower energies eV, or towards the excitonic resonance.
In conclusions, we have presented ab initio GW-BSE calculations of the optical absorption spectra in graphite, graphene, and the bilayer, taking into account e-e, e-h, and LF effects. For the three systems, we have found strong excitonic effects in a high-energy range eV, well beyond the range of transitions. In graphene and bilayer, these give rise to an excitonic resonance on a background continuum of dipole forbidden transitions. The excitonic resonance has a main character. Our BSE spectra on graphite are in good agreement with experiment.
We thank L. Reining, G. Martinez and M. Ladisa for useful discussions. P.E.T. was supported by ANR ETSF France. Computer time was granted by Ciment and we acknowledge the Fondation Nanoscience for support via the RTRA NanoSTAR, Dispograph and Muscade projects. We have used EXC, ABINIT and DP codes.
References
- (1) S. Novoselov et al. Nature 438, 197 (2005).
- (2) Ph. Avouris, Z. Chen, and V. Perebeinos, Nature Nanotechnology 2, 605 (2007).
- (3) R. J. Papoular and R. Papoular, Mon. Not. R. Astron. Soc. 394, 2175 (2009).
- (4) E. A. Taft and H. R. Philipp, Phys. Rev. 138, A197 (1965).
- (5) R. Klucker, M. Skibowski and W. Steinmann, Phys. Stat. Sol. (B) 66, 703 (1974).
- (6) K. Zeppenfeld, Z. Phys. 211, 391 (1968).
- (7) E. Tosatti and F. Bassani, Nuovo Cimento B 65, 161 (1970).
- (8) H. Venghaus, Phys. Stat. Sol. (B) 71, 609 (1975).
- (9) U. Büchner, Phys. Stat. Sol. (B) 81, 227 (1977).
- (10) S. Roddaro et al., NanoLetters, 7 2707 (2007).
- (11) R. R. Nair et al., Science 320, 1308 (2008).
- (12) K. F. Mak et al.,101, 196405 (2008).
- (13) F. Bassani and G. Pastori Parravicini, Nuovo Cimento B 50, 95 (1967).
- (14) R. Ahuja et al., Phys. Rev. B 55, 4999 (1997).
- (15) A. G. Marinopoulos, L. Reining, A. Rubio and V. Olevano, Phys. Rev. B 69, 245419 (2004).
- (16) L. Yang et al., Phys. Rev. Lett 103, 186802 (2009).
- (17) G. Onida, L. Reining and A. Rubio, Rev. Mod. Phys. 74, 601 (2002) and references therein.