58 Radio Sources Near Bright Natural Guide Stars111 Based on observations obtained at the Canada-France-Hawaii Telescope (CFHT) which is operated by the National Research Council of Canada, the Institut National des Sciences de l’Univers of the Centre National de la Recherche Scientifique of France, and the University of Hawai‘i. ,222Based on observations obtained at the Gemini Observatory, which is operated by the Association of Universities for Research in Astronomy, Inc., under a cooperative agreement with the NSF on behalf of the Gemini partnership: the National Science Foundation (United States), the Science and Technology Facilities Council (United Kingdom), the National Research Council (Canada), CONICYT (Chile), the Australian Research Council (Australia), CNPq (Brazil) and SECYT (Argentina)
Abstract
We present a preliminary survey of 58 radio sources within the isoplanatic patches () of bright () stars suitable for use as natural guide stars with high-order adaptive optics (AO). An optical and near-infrared imaging survey was conducted utilizing tip-tilt corrections in the optical and AO in the near-infrared. Spectral Energy Distributions (SEDs) were fit to the multi-band data for the purpose of obtaining photometric redshifts using the Hyperz code (Bolzonella et al., 2000). Several of these photometric redshifts were confirmed with spectroscopy, a result that gives more confidence to the redshift distribution for the whole sample. Additional long-wavelength data from Spitzer, SCUBA, SHARC2, and VLA supplement the optical and near-infrared data. We find the sample generally follows and extends the magnitude-redshift relation found for more powerful local radio galaxies. The survey has identified several reasonably bright () objects at significant redshifts () that are now within the capabilities of the current generation of AO-fed integral-field spectrographs. These objects constitute a unique sample that can be used for detailed ground-based AO studies of galactic structure, evolution, and AGN formation at high redshift.
Subject headings:
galaxies: high-redshift — galaxies: fundamental parameters — galaxies: evolution — galaxies: formation1. Introduction
One of the most active debates in extragalactic astronomy is on the nature of spheroid formation at high redshifts. The hierarchical galaxy formation scenario is based on the conclusions of semi-analytic CDM models (Thomas & Kauffmann, 1999; Kauffmann et al., 1999; Kauffmann & Haehnelt, 2000) as well as observations of galaxies (Miyazaki et al., 2003; Dickinson et al., 2003; van Dokkum et al., 2008). It is typically described as a building up of a large stellar system from smaller ones, and predicts that massive early-type galaxies should have undergone final assembly at relatively late epochs (). Conversely, the monolithic formation scenario models, supported by other observations (Thomas et al., 2002; Brodie & Strader, 2006; McGrath et al., 2008), require that massive spheroids form at much higher redshifts directly from primordial density fluctuations (see Peebles (2002) for a review and discussion) and evolve passively to the present epoch.
In order to test the predictions of these scenarios, and thereby determine which provides the more accurate model of galaxy formation, we have attempted to study massive galaxies at high redshift by observing the host galaxies of radio sources. Though these objects are not classified as normal galaxies, this technique has certain advantages over other high redshift galaxy search methods (e.g. Lyman-break, and NIR-selection). High redshift radio galaxies (HzRGs) tend to have large stellar masses and high near-infrared luminosities making them accessible to ground-based observations. Furthermore, radio galaxies follow a magnitude-redshift relation (the near-IR Hubble diagram, see van Breugel et al. (1998)), which allows a selection of high redshift objects based on their apparent brightnesses. Lilly & Longair (1984) also found that the K-band magnitude-redshift (K-z) relation of the 3CR catalog of powerful radio galaxies could be well fit by a passively evolving old stellar population, similar to present-day elliptical galaxies. The tendency for HzRGs to reside in over-dense regions in the early universe, makes them likely progenitors of the brightest cluster galaxies in the present epoch (Best et al., 1998).
There are a few disadvantages to observing HzRGs. First, the “alignment effect” (Chambers et al., 1987; McCarthy et al., 1987; Chambers & Miley, 1990; Pentericci et al., 2001) was identified when it was discovered that these objects’ optical morphologies at high redshift were aligned with structures in the radio, and therefore their optical/infrared magnitudes could not be treated as independent of their radio properties. Several mechanisms have been proposed to explain the alignment effect (e.g., anisotropic interactions between cluster members, jet-triggered star formation, optical synchrotron emission, inverse Compton scattering of the CMB photons, and thermal continuum emission from the plasma ionized by the AGN, see McCarthy (1993)). Each of these mechanisms has been shown to be present in certain objects, but because no single explanation is satisfactory for all cases, it is generally thought that two or more may be the source of the alignment effect. Regardless of the causes of the alignment effect, in order to obtain the fundamental parameters of the underlying host galaxy, the contributions from the AGN and the host galaxy must be disentangled.
Studies of the relative contribution of evolved stellar population and flat-spectrum (and presumably aligned) components in optical and infrared images of 3CR radio galaxies revealed that the components responsible for the alignment effect contribute only about to the total SED of the host galaxy (Best et al., 1998) affecting both continuum and emission-line morphologies (McCarthy et al., 1987). The alignment effect also generally diminishes at wavelengths longward of the 4000Å break (Rigler et al., 1992), although there are some exceptions (Eisenhardt & Chokshi, 1990; Chambers et al., 1988). When the alignment effect is examined in detail, only one-fourth to one-third of low redshift radio galaxies have any detectable morphological peculiarities (at the mag/arcsecond2 level), and this fraction becomes smaller in less powerful radio galaxies (Heckman et al., 1986; Dunlop & Peacock, 1993), as a weaker radio source has less of an impact on the rest of the galaxy. This suggests the millijansky-level radio source population predominantly consists of sources with radio fluxes sufficiently low that the optical/near-IR morphologies and SEDs of host galaxies are probably completely dominated by the stellar population of the host galaxy.
An additional disadvantage of observing high redshift galaxies results from the loss of angular and spatial resolution when using traditional ground-based observational techniques, which is needed to accurately determine the galaxy’s fundamental properties. This can easily be achieved from space using HST, though in the near-infrared (where these objects’ SEDs are less-contaminated by their AGNs) HST is limited by both the diffraction size (about 0.2”in K-band) and light-collecting aperture. This makes a survey of these sources extremely time-consuming on a highly competitive telescope and spectroscopy on these faint sources is almost impossible. However, with the advent of ground-based AO techniques, a large imaging survey can be conducted with a comparable spatial resolution and exposure time on a 3-4 meter class telescope, with the limitation that most AO systems require a bright guide star in proximity to the galaxy on the sky. Luckily radio sources are common enough that a significant number meet this criteria in wide-area radio survey data sets.
The Faint Images of the Radio Sky at Twenty-centimeters (FIRST) Survey (White et al., 1997) at the Very Large Array (VLA) has 80 completeness down to 1 mJy and better than 1′′ astrometry that can be used to search for HzRGs. The catalog is only minimally contaminated (about 10 by number, see Jackson (2005)) by low redshift star forming galaxies which quickly become more numerous at levels fainter than 0.1 mJy. More importantly, the VLA’s astrometry allows for mostly straightforward optical counterpart identifications. And lastly, the density of sources (about 90 sources per square degree over the survey’s 10,000 square degrees) is sufficiently high that a sizable sample of sources are within the isoplanatic patch (about 25′′ in the NIR) of a V12 star. With these criteria, this survey provides a highly efficient means to preselect likely candidates for high redshift galaxies with undisturbed stellar populations and light profiles that can be observed at high spatial resolution from the ground initially using natural guide star AO. As laser guide star and multi-conjugate AO (which also require nearby natural guide stars) become more mature, this sample would also be well-suited for these instruments and as an initial target list for JWST as it relates to several of its key science objectives.
In this paper, we present the first phase of a project, involving an imaging survey plus a supplemental spectroscopic survey of the FIRST-BNGS sample. The imaging survey consists of optical, NIR, FIR, submillimeter, and radio observations. However, the focus of the imaging survey was on the optical and NIR wavelength regions (since we are mainly interested in the stellar populations of these objects). The goal of this survey was to obtain multi-wavelength photometry to provide identifications and probable redshifts for candidates for high precision diagnostics of galaxies at high redshift to study galactic structure, evolution, and AGN formation at high redshift. Supplemental spectroscopic observations were also obtained to refine redshifts or remove ambiguities in the photometric redshift solutions. In section 2, we introduce the sample we compiled to search for high redshift radio galaxies. Section 3 describes our observations and reduction process for the imaging survey. In section 4, we present our photometric measurement and redshift fitting procedures and results. Section 5 discusses the spectroscopic observations, reduction process, and results, while section 6 briefly summarizes the VLA radio data. Finally, in section 7, we summarize our findings and discuss the potential of this sample.
For this paper we adopt (unless otherwise stated) the Friedmann-Lemaitre world cosmological model with =0.3, =0.7, and =70km/s/Mpc, giving the present age of the Universe as 13.47 Gyr. Also, the spectral index, , will be defined such that the flux of a source, , is proportional to .
2. Sample Selection
A cross-correlation of the VLA FIRST survey and the USNO-A2.0 Catalog (Monet & et al., 1998) yields 58 sources with 1-mJy, galactic latitude located within an annulus arcseconds around a star. These criteria ensure that the FIRST source lies within the isoplanatic patch of a sufficiently bright guide star for the NIR AO observations under most seeing conditions without introducing additional observing or photometric complications (e.g., PSF wings of the guide star contaminating the sky background if the source is too close to the star or the core of the guide star saturating significant sections of the detectors if the star is too bright). We expect near diffraction-limited performance longward of 1.2 (Roddier, 1999) for a typical high-order AO system at Mauna Kea. In the optical, where only tip-tilt correction is available, the point-source sensitivity is increased by up to a factor of four over non-compensated images. Since we are probably not resolving the high redshift (z1) FIRST sources, we would expect similar performance.
Table 1 lists the coordinates of each radio source and corresponding USNO star corrected for proper motion to 2005.0. These 58 objects comprise the FIRST-BNGS sample used in this paper. About 90% are expected to be FRI or FRII galaxies (Jackson, 2005), and based on scaling the 151MHz local radio luminosity function to 1.4 GHz, probably half will be at significant redshift ().
3. Observations
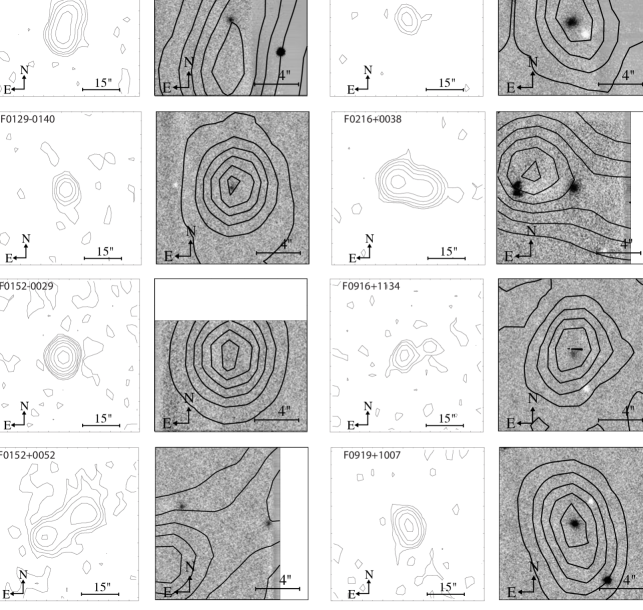
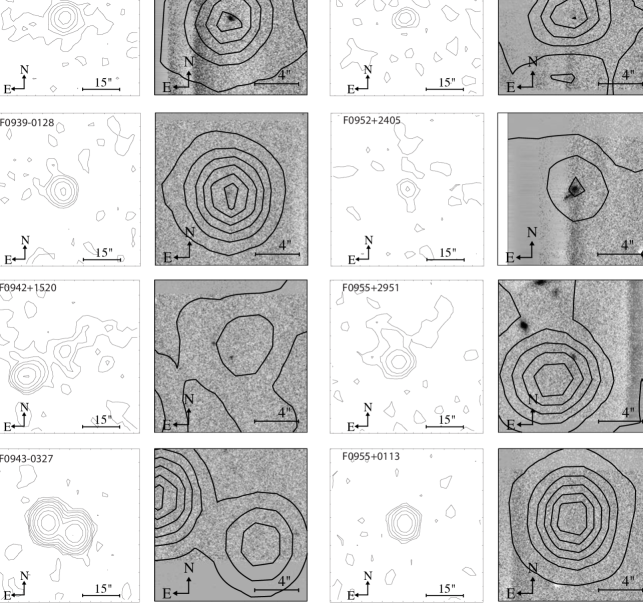
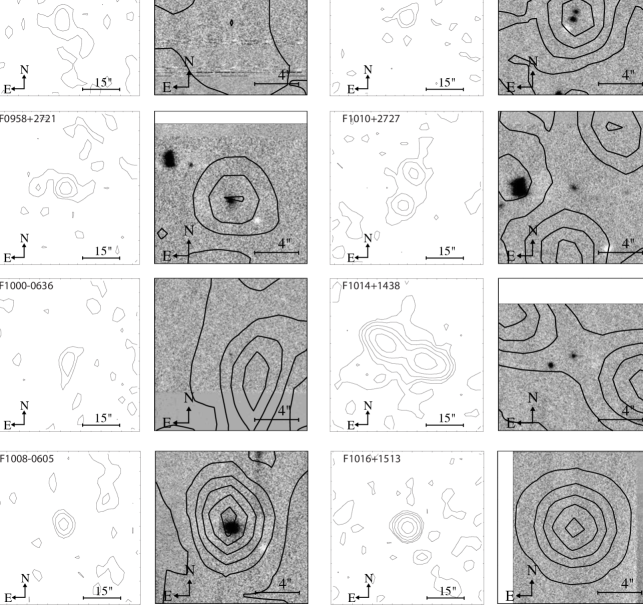
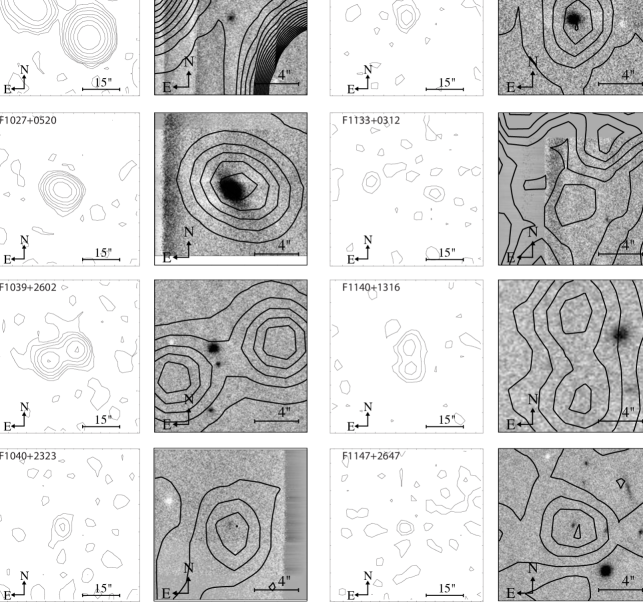
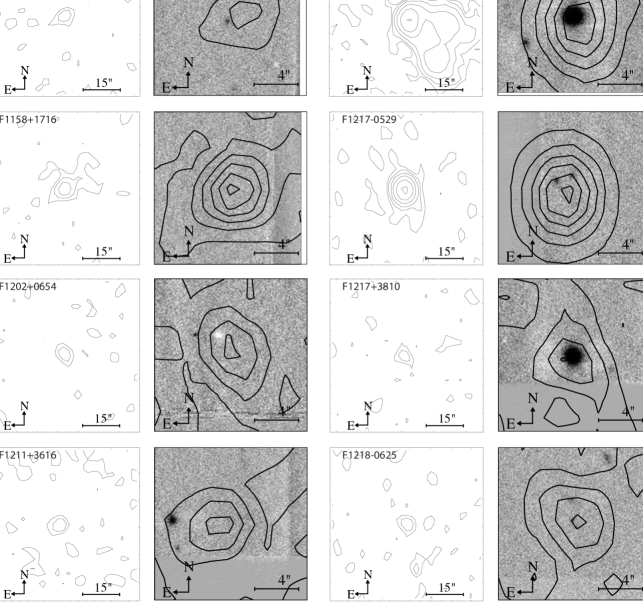
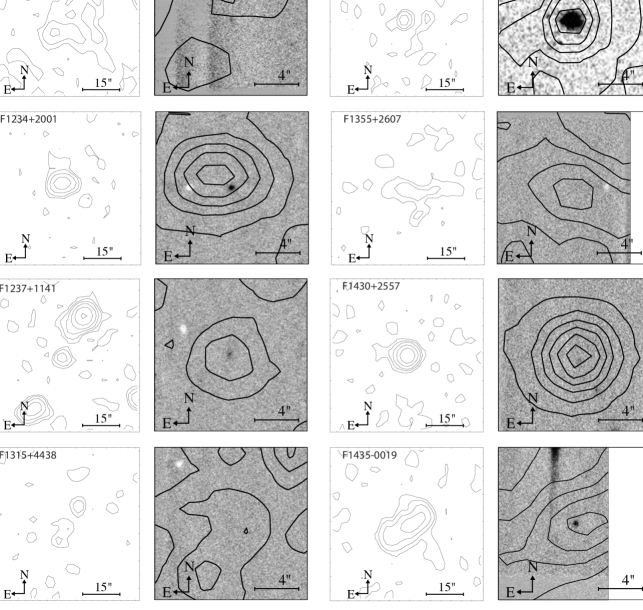
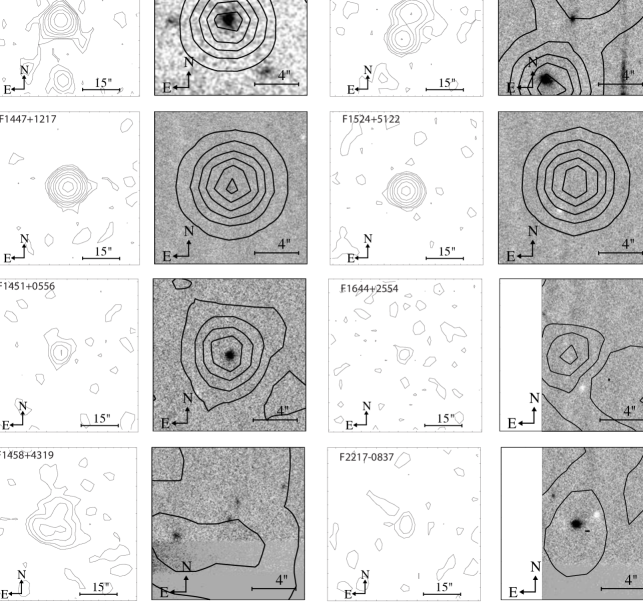
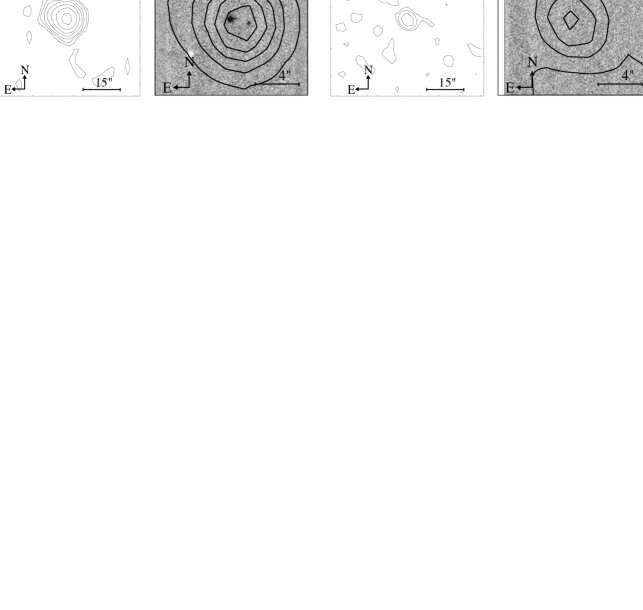
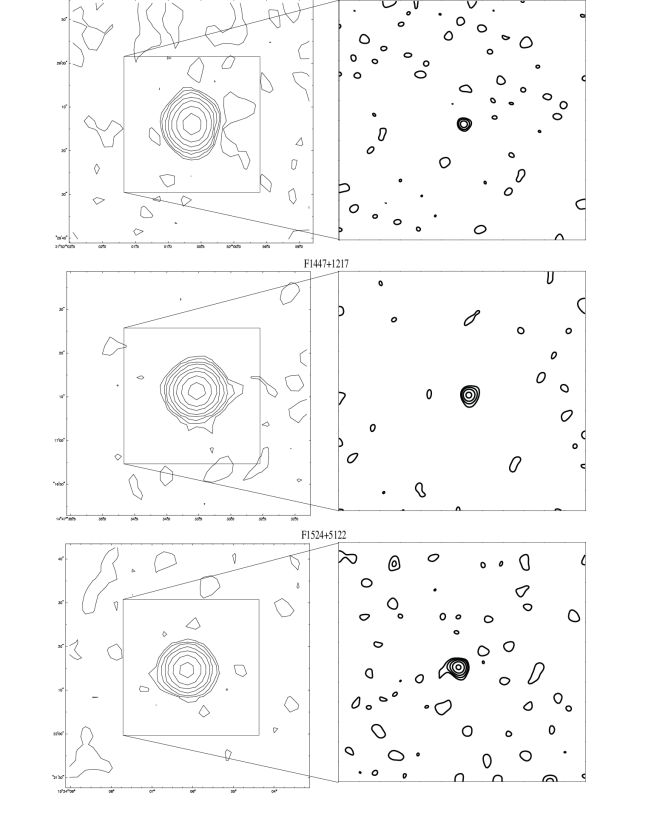
Here we describe our optical and near-infrared imaging data. Figures 1-8 show 54′′x54′′ FIRST radio contour maps and 14′′x14′′ thumbnail NIR images for each source overlaid with FIRST radio contours.
3.1. Optical Imaging
The broadband optical imaging data of the FIRST-BNGS sample were obtained with the Orthogonal Parallel Transfer Imaging Camera (OPTIC; Tonry et al. (2002)) mounted at the f/10 focus of the University of Hawai‘i 2.2-meter (UH2.2m) telescope and at the Nasmyth focus of the Wisconsin, Indiana, Yale, NOAO (WIYN) 3-meter telescope at Kitt Peak National Observatory. This camera utilizes an effective “tip-tilt” correction feature of a specialized CCD, called an orthogonal transfer array, with no physically moving parts. This technique moves the accumulated charge from an astronomical source around on the CCD based on the centroid of a guide star read out at short intervals (20-100ms) in a nearby region of the chip. All of our sources are well within a BNGS isoplanatic patch for tip-tilt correction (about 10′ for a 2 meter telescope). The tip-tilt usually improves the point-source sensitivity by nearly a factor of four in most seeing conditions and slightly increases the achieved spatial resolution. Our best measured FWHM was 0.3′′ for a 300 second exposure. Since we expect the angular size of these high redshift sources to be about this scale, tip-tilt correction only provides an increase in efficiency for flux measurements.
Our observations consisted of several sequential orthogonally transferred (OT) 300-second exposures in various broadband filters (B, V, R, I, and z′). Data were taken on about 50 nights between 2002 December and 2005 April (Table 2) under photometric conditions. The 6′ field of view was oriented strategically with the bright guide star in the guiding region of the chip and the object in the imaging region. Due to the proximity of the science target to the guide star, diffraction spikes and PSF wings were sometimes a problem. In addition, those objects that were particularly close to the guide star were at the edge of the detector’s science region. As the guiding regions are at the top and bottom of the detector, the instrument was occasionally rotated 90 degrees in order to accommodate target objects to the east and west of the guide star. Supplemental rough guiding was also accomplished by OPTIC communicating frequent guide offsets to the telescope control system.
With the exception of the generation of flat-field frames (“flats”), standard IRAF procedures were for the data reduction. The flats were constructed using a special program, kindly provided by John Tonry, called “conflat”, which constructs a flat field from any normal flat image (in this case, the flat was created from the median of several high-signal dome flat images) by convolving it with the sequence of OT shifts executed by OPTIC during the science exposure. A separate convolved flat is therefore needed for each exposure. Each set of images was flat-fielded, background subtracted, aligned using bright stars, then averaged together. An absolute position was derived from the location of the bright guide star using the USNO-A2.0 catalog (Monet & et al., 1998). A similar procedure was used for sequences of short exposure on photometric standard Landolt (1992) fields, but the frames were not stacked so that the individual exposures could be used to estimate uncertainties in the calibration. Photometric zeropoints were derived based on these Landolt standards in the Vega magnitude system.
3.2. NIR Imaging
For the NIR survey of 58 FIRST-BNGS sources, our strategy was to obtain at least H-band photometry for the entire sample. Because the HzRGs in the sample are relatively compact, this was most efficiently accomplished using the 3.6-meter Canada-France-Hawai‘i Telescope (CFHT) with the the Pueo AO bonnette and KIR infrared detector (Rigaut et al., 1998). Pueo-KIR incorporates a wavefront curvature sensor (Roddier et al., 1991) and a 19-electrode deformable mirror. This provides near diffraction-limited imaging in good conditions using guide stars similar to those in the FIRST-BNGS sample. Since the diffraction limit of CFHT is around 0.2′′ in H-band, most the high redshift sources are barely resolved or unresolved, and therefore we are presenting only flux measurement from these observations. However, the increase in point-source sensitivity over non-AO NIR observations allowed us to rapidly observe all sources in the sample in a handful of nights. Some additional non-AO J, H, and K photometric data were taken with the Quick Infrared Camera (QUIRC; Hodapp et al. (1995)) on the UH 2.2m telescope and the SpeX imager (Rayner et al., 2003) on the IRTF to supplement the CFHT H-band data. A subsequent K-band AO imaging campaign to measure morphologies of these sources was carried out on a subsample of 18 FIRST-BNGS high redshift candidates (Stalder & Chambers, in prep.). These observations were made using the Subaru 8-meter telescope and the Infrared Camera and Spectrograph (IRCS) (Kobayashi et al., 2000) mounted behind the 36-element curvature-sensing AO system and the photometry is included in this data set.
| Name | ID RA | ID Dec | USNO-A2.0 | R | B-R | RA offset | Dec offset | Tot offset | |||
|---|---|---|---|---|---|---|---|---|---|---|---|
| 1 | F0023-0904 | 00:23:57.043 | -09:04:43.02 | 0750-00092600 | 11.6 | 1.1 | -9.01 | 25.44 | 26.99 | -53 | 15.28 |
| 2 | F0129-0140 | 01:29:42.917 | -01:40:40.03 | 0825-00339308 | 12.0 | 1.0 | 13.66 | 16.92 | 21.75 | -59 | 3.70 |
| 3 | F0152-0029 | 01:52:00.671 | -00:29:13.53 | 0825-00426996 | 11.5 | 1.2 | 15.30 | 8.59 | 17.55 | -58 | 24.69 |
| 4 | F0152+0052 | 01:52:16.147 | +00:52:16.35 | 0900-00437561 | 11.1 | 0.8 | -29.71 | -3.29 | 29.89 | -57 | 16.85 |
| 5 | F0202-0021 | 02:02:37.247 | -00:21:00.82 | 0825-00472596 | 11.0 | 1.5 | -15.66 | 19.85 | 25.28 | -57 | 2.79 |
| 6 | F0216+0038 | 02:16:46.186 | +00:39:00.90 | 0900-00529744 | 12.0 | 1.6 | -14.83 | 6.41 | 16.16 | -54 | 29.94 |
| 7 | F0916+1134 | 09:16:08.084 | +11:34:23.04 | 0975-06196986 | 11.0 | 0.7 | 19.04 | 2.09 | 19.16 | 35 | 4.54 |
| 8 | F0919+1007 | 09:19:34.330 | +10:07:22.55 | 0975-06212600 | 11.6 | 0.7 | -16.44 | -1.12 | 16.47 | 36 | 8.97 |
| 9 | F0938+2326 | 09:38:39.209 | +23:26:43.90 | 1125-05944823 | 11.4 | 1.9 | 22.97 | 9.92 | 25.02 | 36 | 8.09 |
| 10 | F0939-0128 | 09:39:43.995 | -01:28:03.09 | 0825-06948720 | 11.6 | 0.9 | -20.20 | 11.81 | 23.40 | 37 | 5.06 |
| 11 | F0942+1520 | 09:42:58.821 | +15:20:28.01 | 1050-06112221 | 11.8 | 1.4 | 11.44 | 12.18 | 16.71 | 40 | 15.70 |
| 12 | F0943-0327 | 09:43:15.625 | -03:27:03.82 | 0825-06969818 | 11.0 | 1.1 | 7.82 | -17.95 | 19.58 | 39 | 99.49 |
| 13 | F0950+1619 | 09:50:36.928 | +16:19:53.27 | 1050-06140249 | 11.0 | 1.4 | 8.21 | -19.06 | 20.75 | 42 | 1.69 |
| 14 | F0952+2405 | 09:52:20.644 | +24:05:53.87 | 1125-05996595 | 11.2 | 1.1 | 24.17 | 4.27 | 24.54 | 38 | 1.27 |
| 15 | F0955+2951 | 09:55:12.289 | +29:51:30.83 | 1125-06008285 | 11.5 | 0.7 | -21.52 | -9.50 | 23.52 | 35 | 6.65 |
| 16 | F0955+0113 | 09:55:18.949 | +01:13:37.24 | 0900-06543413 | 11.5 | 0.9 | 16.53 | 4.55 | 17.14 | 40 | 8.58 |
| 17 | F0956-0533 | 09:56:12.923 | -05:33:20.54 | 0825-07043060 | 11.5 | 1.7 | 6.61 | -18.81 | 19.94 | 42 | 2.40 |
| 18 | F0958+2721 | 09:58:46.919 | +27:21:17.78 | 1125-06020281 | 11.7 | 0.9 | -15.25 | 2.71 | 15.49 | 37 | 2.62 |
| 19 | F1000-0636 | 10:00:03.474 | -06:36:38.53 | 0825-07062955 | 11.9 | 1.0 | -10.58 | -17.47 | 20.42 | 44 | 1.41 |
| 20 | F1008-0605 | 10:08:34.084 | -06:05:29.94 | 0825-07106082 | 11.7 | 2.3 | 2.07 | -16.13 | 16.26 | 45 | 1.52 |
| 21a | F1010+2527N | 10:10:09.833 | +25:27:58.94 | 1125-06057690 | 11.3 | 1.7 | -19.57 | -15.23 | 24.80 | 41 | 1.31 |
| 21b | F1010+2527S | 10:10:09.854 | +25:27:58.26 | 1125-06057690 | 11.3 | 1.7 | -19.28 | -15.91 | 25.00 | 41 | 1.31 |
| 22 | F1010+2727 | 10:10:17.095 | +27:27:39.14 | 1125-06058003 | 11.4 | 1.0 | -14.40 | 6.47 | 15.79 | 39 | 5.94 |
| 23 | F1014+1438 | 10:14:30.351 | +14:38:55.90 | 0975-06445830 | 11.5 | 1.1 | 8.74 | 22.55 | 24.18 | 47 | 32.74 |
| 24 | F1016+1513 | 10:16:53.648 | +15:13:02.45 | 1050-06244113 | 11.2 | 1.0 | -4.26 | 16.41 | 16.95 | 47 | 6.88 |
| 25 | F1024-0031 | 10:24:23.499 | -00:31:21.86 | 0825-07189101 | 12.0 | 1.0 | 21.04 | -13.22 | 24.85 | 46 | 158.37 |
| 26 | F1027+0520 | 10:27:51.341 | +05:20:51.45 | 0900-06695802 | 11.9 | 0.9 | 22.22 | 1.86 | 22.30 | 49 | 22.64 |
| 27 | F1039+2602 | 10:39:57.545 | +26:02:12.17 | 1125-06156471 | 12.0 | 1.0 | -21.27 | 17.16 | 27.33 | 46 | 11.53 |
| 28 | F1040+2323 | 10:40:53.550 | +23:23:31.69 | 1125-06159536 | 11.6 | 0.7 | -23.65 | -0.74 | 23.66 | 49 | 1.65 |
| 29 | F1116+0235 | 11:16:10.460 | +02:35:46.26 | 0900-06888400 | 11.0 | 0.7 | 5.41 | 17.89 | 18.69 | 56 | 2.00 |
| 30 | F1133+0312 | 11:33:01.502 | +03:12:20.78 | 0900-06953454 | 11.8 | 0.3 | 21.64 | 23.57 | 32.00 | 59 | 0.78 |
| 31 | F1140+1316 | 11:40:48.122 | +13:16:19.10 | 0975-06779562 | 11.7 | 1.0 | 11.49 | 26.40 | 28.79 | 65 | 5.21 |
| 32 | F1147+2647 | 11:47:47.329 | +26:47:46.69 | 1125-06384622 | 11.9 | 0.6 | -19.52 | 12.69 | 23.28 | 59 | 0.66 |
| 33 | F1155+2620 | 11:55:18.857 | +26:20:04.88 | 1125-06409314 | 11.6 | 1.0 | 5.57 | 21.69 | 22.39 | 61 | 0.99 |
| 34 | F1158+1716 | 11:58:45.785 | +17:16:53.16 | 1050-06622092 | 11.9 | 1.0 | -23.17 | 6.09 | 23.96 | 68 | 2.64 |
| 35 | F1202+0654 | 12:02:35.855 | +06:54:58.22 | 0900-07060106 | 11.1 | 0.9 | -0.73 | -19.62 | 19.63 | 66 | 0.99 |
| 36 | F1211+3616 | 12:11:36.405 | +36:16:31.00 | 1200-06860134 | 11.9 | 0.7 | -9.01 | -15.11 | 17.59 | 51 | 1.14 |
| 37 | F1215+3242 | 12:15:51.397 | +32:43:14.57 | 1200-06870734 | 11.3 | 0.7 | -9.83 | 27.33 | 29.04 | 57 | 45.07 |
| 38a | F1217-0529E | 12:17:19.755 | -05:29:18.87 | 0825-07696891 | 11.5 | 0.9 | 17.66 | 9.33 | 19.98 | 66 | 10.23 |
| 38b | F1217-0529W | 12:17:19.657 | -05:29:18.36 | 0825-07696891 | 11.5 | 0.9 | 16.20 | 9.84 | 18.95 | 66 | 10.23 |
| 39 | F1217+3810 | 12:17:35.870 | +38:10:51.30 | 1275-08065221 | 11.7 | 1.0 | -7.45 | -18.79 | 20.21 | 49 | 0.84 |
| 40 | F1218-0625 | 12:18:44.115 | -06:25:36.97 | 0825-07703320 | 12.0 | 0.3 | -14.79 | -4.57 | 15.48 | 67 | 4.29 |
| 41 | F1218-0716 | 12:18:53.524 | -07:16:18.85 | 0825-07703926 | 11.3 | 0.7 | 15.94 | -9.57 | 18.59 | 68 | 0.79 |
| 42 | F1234+2001 | 12:34:32.770 | +20:01:33.04 | 1050-06743069 | 11.2 | 1.0 | 13.95 | -0.82 | 13.98 | 74 | 4.80 |
| 43 | F1237+1141 | 12:37:17.118 | +11:41:15.10 | 0975-06997522 | 11.5 | 0.8 | -21.43 | 16.90 | 27.29 | 73 | 17.83 |
| 44 | F1315+4438 | 13:15:41.557 | +44:38:21.80 | 1275-08221253 | 11.4 | 0.9 | 13.79 | 11.53 | 17.98 | 46 | 0.89 |
| 45 | F1329+1748 | 13:29:10.570 | +17:48:10.35 | 1050-06936553 | 11.7 | 0.5 | -2.30 | -23.79 | 23.90 | 80 | 1.34 |
| 46 | F1355+3607 | 13:55:29.855 | +36:07:12.61 | 1200-07189476 | 11.5 | 1.0 | 4.24 | 17.59 | 18.09 | 68 | 3.48 |
| 47 | F1430+3557 | 14:30:08.889 | +35:57:19.20 | 1200-07317559 | 11.7 | 0.5 | 15.69 | 9.84 | 18.52 | 73 | 8.54 |
| 48 | F1435-0019 | 14:35:28.042 | -00:19:51.33 | 0825-08378453 | 11.1 | 0.5 | -2.28 | -10.36 | 10.61 | 52 | 10.00 |
| 49 | F1445+2702 | 14:45:36.895 | +27:02:27.19 | 1125-07063557 | 11.9 | 0.8 | 0.88 | 21.41 | 21.43 | 85 | 34.22 |
| 50 | F1447+1217 | 14:47:33.593 | +12:17:11.51 | 0975-07595012 | 12.0 | 0.7 | 25.05 | -5.40 | 25.62 | 62 | 48.90 |
| 51 | F1451+0556 | 14:51:15.153 | +05:56:43.97 | 0900-07812705 | 11.4 | 0.7 | 14.16 | -15.23 | 20.79 | 54 | 2.35 |
| 52a | F1458+4319NW | 14:58:50.327 | +43:19:46.79 | 1275-08563676 | 11.9 | 0.9 | -11.33 | -14.85 | 18.68 | 61 | 11.11 |
| 52b | F1458+4319SE | 14:58:50.410 | +43:19:44.66 | 1275-08563676 | 11.9 | 0.9 | -10.42 | -16.98 | 19.92 | 61 | 11.11 |
| 52c | F1458+4319E | 14:58:50.823 | +43:19:43.44 | 1275-08563676 | 11.9 | 0.9 | -5.91 | -18.20 | 19.14 | 61 | 11.11 |
| 53 | F1505+4457 | 15:05:11.548 | +44:57:31.91 | 1275-08584140 | 11.3 | 0.8 | 4.97 | 12.34 | 13.30 | 59 | 17.08 |
| 54 | F1524+5122 | 15:24:06.270 | +51:22:15.02 | 1350-08618364 | 11.6 | 0.8 | 1.41 | 20.85 | 20.90 | 46 | 22.45 |
| 55 | F1644+2554 | 16:44:34.831 | +25:54:37.12 | 1125-07786245 | 11.9 | 0.7 | 1.97 | 20.59 | 20.68 | 59 | 0.66 |
| 56 | F2217-0837 | 22:17:18.793 | -08:37:41.25 | 0750-21161298 | 11.4 | 0.2 | 0.56 | -18.77 | 18.78 | -35 | 0.99 |
| 57a | F2217-0138E | 22:17:47.228 | -01:38:45.55 | 0825-19614577 | 11.9 | 0.9 | -2.52 | 21.16 | 21.31 | -43 | 26.37 |
| 57b | F2217-0138W | 22:17:47.112 | -01:38:45.78 | 0825-19614577 | 11.9 | 0.9 | -4.26 | 20.93 | 21.36 | -43 | 26.37 |
| 58 | F2354-0055 | 23:54:42.286 | -00:55:29.38 | 0825-20052970 | 11.1 | 1.2 | 9.76 | 19.49 | 21.80 | -58 | 1.38 |
| Telescope | Instrument | Filters | Dates (UT) | FWHMaaCorrected FWHM range in observed band. |
|---|---|---|---|---|
| UH 2.2-meter | OPTIC | B,V,R,I,z′ | 2002 April 23-27 | 1.0′′-1.5′′ |
| 2002 December 7-10 | 0.7′′-1.2′′ | |||
| 2003 January 24-27 | 0.5′′-0.9′′ | |||
| 2003 March 20-25 | 0.6′′-1.2′′ | |||
| 2003 May 20 | 1.0′′-1.2′′ | |||
| 2003 August 1-5 | 0.7′′-1.0′′ | |||
| 2004 February 27 | 0.8′′-1.0′′ | |||
| 2004 July 28 | 0.5′′ | |||
| 2004 August 21-24 | 0.8′′-2.0′′ | |||
| 2005 February 10-17 | 0.7′′-2.5′′ | |||
| WIYN | OPTIC | B,V,R,I,z′ | 2003 October 14 | 0.6′′-1.2′′ |
| 2004 June 4 | 1.0′′-1.2′′ | |||
| 2004 November 9-10 | 1.2′′-1.5′′ | |||
| 2005 April 26-28 | 1.0′′-1.2′′ | |||
| 2006 January 1 | 1.0′′ | |||
| 2006 June 29-31 | 0.5′′-2.0′′ | |||
| UH 2.2-meter | QUIRC | K’ | 2003 August 10-11 | 1.0′′ |
| IRTF | SPEX | J,H,K | 2006 August 14-15 | 0.7′′-0.9′′ |
| CFHT | Pueo-KIR | J,H | 2003 March 14-16 | 0.5′′-0.7′′ |
| 2003 October 11-14 | 0.2′′-0.3′′ | |||
| 2004 April 3-4 | 0.3′′-0.4′′ | |||
| 2004 October 1-3 | 0.2′′-0.4′′ | |||
| 2005 April 17-23 | 0.2′′-0.3′′ | |||
| Subaru | IRCS | K’ | 2004 February 2-3 | 0.2′′-0.5′′ |
| 2004 November 29 | 0.5′′ | |||
| 2005 January 16 | 0.4′′ | |||
| 2005 February 18-19 | 0.3′′-0.6′′ |
The J and H AO data were collected under excellent seeing and photometric conditions over the course of 19 nights (Table 2). The K-band AO data were obtained during photometric conditions, but seeing conditions were below average (1.5-2.0′′ natural seeing in V-band) on several of the nights, unfortunately giving a mediocre corrected K-band FWHM (0.2-0.5′′). The non-AO data were under photometric and varying seeing conditions.
Calculated Strehl ratios (the ratio of the maximum of the on-axis PSF to the maximum of a theoretical diffraction-limited PSF) for Pueo-KIR were around 10 in J and consistently above 40 and reached as high as 80-90 in H, and remained stable throughout these nights. The IRCS K-band Strehls were around 20-25. These are typical Subaru Strehl ratios because the system has only 36 subapertures on an 8-meter diameter, whereas Pueo has 19 subapertures over the 3.6-meter diameter that more finely samples the isoplanatic regions over the aperture. Both AO systems resulted in near diffraction-limited performance in average to good natural seeing (0.15′′ on-axis corrected FWHM for CFHT in H and 0.08′′ for Subaru in K). Unfortunately, due to worse than average seeing conditions, little of the IRCS data achieved this. The exposure times were 180-seconds in J, 120-seconds in H, and 90 in K. A custom dithering pattern was used that kept the bright guide star on the field for aligning the images, but did not allow the regions saturated by the guide star to overlap with the object, to avoid persistence problems in photometric measurements and in flat frame construction. For the Subaru AO data, an off-axis PSF star at the same distance to the guide star and similar brightness to our science targets was observed each night to represent the PSF in our fitting process for the K-band data.
The Pueo-KIR detector suffers from additional amplifier related artifacts from the saturated guide star reflected in each quadrant, plus a “ghost” guide star due to internal reflections within the instrument. These were easily identified because of their consistency, but are remarked on here because of the effect on the overall quality of the data. The amplifier artifacts can be seen as negative (white) signals in most H-band thumbnail images, for example, just southwest of the F0202-0021 object at H-band in Figure 2. The “ghost” image can plainly be seen as an hourglass shaped object to the east of F0216+0038 in Figure 2 and also in the H-band image of F1010+2727 in Figure 3. Some objects were also near the edge of the detector FOV, as seen in several images (a consequence of keeping both guide star and science object on the chip).
The non-AO data was taken over 5 nights in 2003 August using QUIRC on the UH2.2m and 2006 August using SpeX on IRTF with similar exposure times and dithering patterns as the CFHT Pueo-KIR and Subaru IRCS data.
Standard IRAF procedures were used to reduce the near-infrared data. Median sky flats were constructed from all of the exposures of each field then normalized by the mode of the sky values. For each exposure, the data was divided by the normalized flat and sky subtracted based on the mode. Finally, the science frames were stacked, using the bright guide star for registration. World coordinate system data was also entered into the file header based on the position of the guide star. The same procedure was used for short exposure photometric standard fields (by using the science object’s median sky frame closest in time to when the sequence was taken), but the fields were not stacked in order to obtain multiple measurements. Photometric zeropoints were derived from the magnitudes in the UKIRT Faint Standard catalog (Leggett et al., 2006) for the Mauna Kea filter set (Simons & Tokunaga, 2002; Tokunaga et al., 2002) on the Vega magnitude system.
3.3. Spitzer Archive Data
A search of all 58 FIRST-BNGS sources in the Spitzer Archives resulted in serendipitous observations of 2 objects (F1237+1141 and F1430+3557). The Spitzer IRAC 3.6/5.8m and MIPS 24m, 70m, and 160m mosaiced images were produced from basic calibrated data (BCD) images using the Mosaicking and Point Source Extraction tool, MOPEX (Makovoz & Khan, 2005). Some cleaning was done for the MIPS 70 and 160m data also using MOPEX. Aperture photometry was accomplished using the IRAF “phot” routines with an appropriate aperture correction from the respective IRAC and MIPS websites. Sensitivity was measured through fitting the background assuming Poisson statistics. For F1237+1141 at 3.6m, the guide star has some diffraction spikes near the object, but was mitigated by measuring the flux with a smaller aperture and separately at two observed rotation angles (with different spike orientations). For 5.8m and the MIPS channels, the nearby guide star was much dimmer at these wavelengths so the flux measurements were not affected by gradients or artifacts.
| Name | instrument | dates(UT) | (mJy) | (mJy) | |
|---|---|---|---|---|---|
| F0152-0029 | SHARC2 | Nov16-19,2005 | 350 | 24.6 | |
| F1116+0235 | SCUBA | Nov22,2003 | 450 | 39.0 | |
| F1116+0235 | SCUBA | Nov22,2003 | 850 | 4.1 | 2.1 |
| F1237+1141 | IRAC | May27,2004Jun09,2004 | 3.6 | 0.0673 | 0.0013 |
| F1237+1141 | IRAC | May27,2004Jun09,2004 | 5.8 | 0.1928 | 0.0017 |
| F1237+1141 | MIPS | Jun22,2004Jun23,2004 | 24.0 | 0.725 | 0.073 |
| F1237+1141 | MIPS | Jun22,2004Jun23,2004 | 70.0 | 3.21 | 0.64 |
| F1237+1141 | MIPS | Jun22,2004Jun23,2004 | 160.0 | 12.5 | 2.5 |
| F1430+3557 | MIPS | Feb01,2004 | 24.0 | 0.374 | 0.037 |
| F1430+3557 | MIPS | Feb01,2004 | 160.0 | 33 | |
| F1644+2554 | SCUBA | Aug27,2003 | 450 | 90 | |
| F1644+2554 | SCUBA | Aug27,2003 | 850 | 6.6 | |
| F2217-0138 | SHARC2 | Nov19,2005 | 350 | 195 |
3.4. Submillimeter Bolometer Observations
In an attempt to detect submillimeter emission from the objects in the sample, we obtained time on CSO and JCMT. We were able to observe 2 objects in the sample using the CSO bolometer array, SHARC2 over the course of several nights. SHARC2 data were reduced using the CRUSH pipeline (with faint and compact flags enabled), and aperture photometry was measured with IRAF routines. Though no detections were made, the background noise was measured to get sensitivity for each field. Several hours of JCMT SCUBA queue time was also awarded, though only a few observations were actually executed on 2 sources. The photometric data were reduced and extracted using the ORAC-DR pipeline using the nearest calibrators. A weak detection was made of F1116+0235, which is a low-redshift source. Table 3 shows the measurements from these data.
3.5. Identification
The reduced and registered optical and near-IR images were compared to the FIRST survey cutouts at the coordinates of the radio source in the catalog. Optical identifications of single radio sources were straightforward. We required the counterpart to be within 3′′ of the peak of the radio source. This allowed for the FIRST positional accuracy (about 1′′) and for slightly elongated radio structures where the central source positions are not well measured. For double-lobed radio sources to be matched, detections had to be along the radio axis and near the center of the two lobes. For irregular radio morphologies, many objects in the corresponding area were marked as possible matches (i.e., N, S, E, W, etc.). The objects nearest to the radio source peak were usually selected as the most probable counterparts.
3.6. Photometry
Calibrated flux measurements were made using the -minimization surface-brightness fitting routine GALFIT (Peng et al., 2002) for each object for all optical and NIR bands observed. GALFIT was chosen due to the density of sources and presence of artifacts in the data as it fits multiple objects simultaneously and is better able to deal with artifacts than aperture photometry. For the B, V, R, I, z′, J, H and non-AO K no PSF-convolution was used (the Pueo-KIR J and H data have relatively low S/N and do not have an observed off-axis PSF star), so each object was fitted to a pure Sersic () profile which spans the possible profiles of unresolved Gaussian (), exponential disk (), and de Vaucouleurs () . For the K-band Subaru AO data, the objects were fit as Sersic profiles convolved with a normalized PSF derived from an off-axis 17th magnitude star imaged the same night and if necessary, smoothed to the FWHM measured in the science frame. These stars were selected to be at the same distance to its guide star as the science objects, and at a similar airmass, so should capture the long temporal scale off-axis PSF as long as conditions did not change much throughout the night. This was verified with other point sources in our science fields. Because the background is of critical importance in these fits, tests were run using different background fitting algorithms, using both aperture fitting and using the GALFIT integrated algorithm. The aperture-measured background was found to be more accurate and reproducible; the same conclusion was reached by Häussler et al. (2007) using both real and simulated data. Residuals were checked to verify that the final fit was good. Only total magnitudes were used from these fits. The magnitude errors reported by GALFIT were larger than the 0.03 mag intrinsic scatter for S/N 2.5 found by Häussler et al. (2007), so the GALFIT photometric errors added in quadrature to this was used as an estimate of the error. The result for each object was total flux in each observed filter. These measurements are aperture and atmospheric-seeing independent as they are derived from a model fit. This was confirmed by smoothing sample data and GALFIT recovering essentially the same flux (within measurement errors). These photometry measurements were also robust against gradients and artifacts caused by the nearby bright guide star, this was verified by repeatability of the measurements of the same object at various position angles and with the guide star on and off the detector. In cases where an artifact is particularly close to the science object, they are modeled in the GALFIT fit along with the science object, producing excellent residuals. Table 4 shows the best-fit magnitudes from GALFIT or 3-sigma upper-limits based on background noise in the data and assuming Poisson statistics.
4. SED fitting
4.1. Optical-NIR Photometric Redshifts
The initial redshift determinations for each object with 4 or more bands of photometric data (plus 1 object with a large break between 2 bands, F0942+1520) were derived using the public SED fitting code, Hyperz (Bolzonella et al., 2000). The library of the Mannucci et al. (2001) near-infrared extensions to the Kinney et al. (1996) templates for E, S0, Sa, Sb, Sc, and SB1 to SB6 (starburst models over a range of reddening) were used as the range of possible SEDs for this sample of radio sources (see Appendix A for a more detailed description and comparison plots of the templates). Extensions in the UV and mid to far IR wavelength regions were also added (see Appendix).
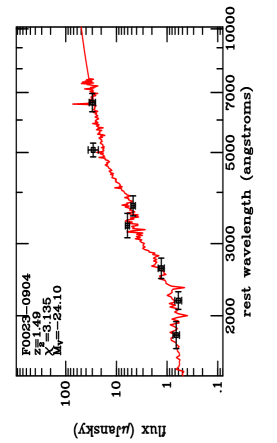
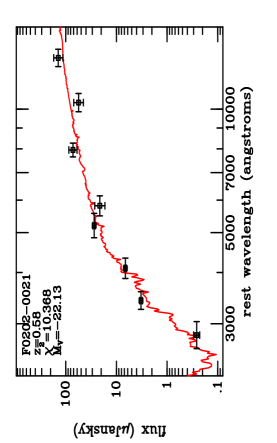
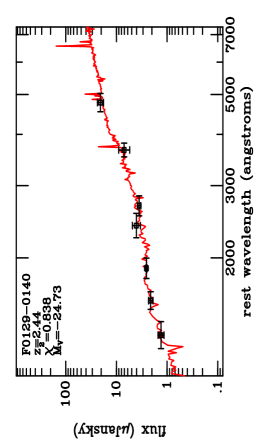
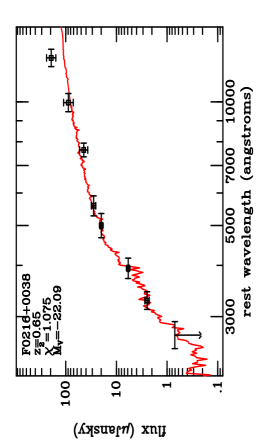
Hyperz uses a -minimization procedure to determine the best-fit SED and redshift after applying a correction for Lyman forest absorption from Madau (1995). Within the limitations of the code, the redshift range was set to between in steps of 0.05, and the extinction in the rest-frame V-band () was allowed to vary from 0 to 10 magnitudes. Reddening was calculated using the Calzetti et al. (2000) extinction law. Figures 9-17 shows the best-fit SEDs for these objects with the parameters listed in Table 5.
Since only low redshift templates were used, reddening, which is fit for by Hyperz, was relied on to find most likely solution for a given object at each redshift. This is reasonable given the degeneracies between star formation history, age, metallicity and reddening. It should be pointed out that therefore no detailed information beyond redshift, absolute magnitude, and general SED-type (early, late, star-burst) about these parameters should be considered certain, so were not given in our analysis.
All fits were confirmed using our own software that carries out a procedure similar to that of Hyperz. The code performs a -minimization to fit the SED which first converts magnitudes to flux, then creates a library of every SED template at every redshift step in the given redshift range, applies the Madau (1995) absorption curve to them, integrates each redshifted model over the filter bandpasses, computes the least squares fit between the observed fluxes and the model fluxes, and finally finds the minimum among all the redshifts for each model and among all the models. The output includes the best template, redshift, and scale factor to convert to absolute flux. These fits were only used to confirm the Hyperz results because reddening was not taken into account in our code.
| Name | B | V | R | I | z′ | J | H | K | |||||||||
|---|---|---|---|---|---|---|---|---|---|---|---|---|---|---|---|---|---|
| 1 | F0023-0904 | 24.44 | .16 | 24.45 | .17 | 23.41 | .15 | 21.49 | .10 | 21.69 | .11 | 19.31 | .25 | 18.83 | .16 | ||
| 2 | F0129-0140 | 23.69 | .15 | 23.09 | .11 | 22.68 | .04 | 21.93 | .21 | 21.99 | .08 | 20.84 | .27 | 19.23 | .15 | ||
| 3 | F0152-0029 | 25.25 | 24.75 | 24.17 | 23.51 | 23.73 | 20.05 | 19.34 | .12 | ||||||||
| 4 | F0152+0052 | 25.07 | 24.87 | 25.11 | 24.99 | 24.84 | 18.47 | 19.00 | |||||||||
| 5 | F0202-0021 | 25.45 | .15 | 22.61 | .07 | 21.64 | .06 | 19.85 | .07 | 20.05 | .25 | 18.31 | .20 | 18.15 | .24 | 16.72 | .23 |
| 6 | F0216+0038 | 24.73 | 22.91 | .11 | 21.78 | .06 | 20.20 | .07 | 19.74 | .11 | 18.84 | .20 | 17.65 | .24 | 16.37 | .23 | |
| 7 | F0916+1134 | 22.65 | .11 | 22.50 | .06 | 21.84 | .07 | 21.33 | .23 | 19.69 | .15 | ||||||
| 8 | F0919+1007 | 25.11 | 23.61 | .11 | 22.66 | .06 | 20.48 | .07 | 19.54 | .25 | 17.85 | .15 | 17.17 | .09 | |||
| 9 | F0938+2326 | 21.73 | .11 | 20.88 | .06 | 20.56 | .08 | 20.05 | .02 | 19.19 | .15 | ||||||
| 10 | F0939-0128 | 24.91 | 25.15 | 24.54 | 20.98 | .20 | |||||||||||
| 11 | F0942+1520 | 24.56 | 24.31 | 25.08 | 24.26 | 20.83 | .17 | 18.13 | .15 | ||||||||
| 12 | F0943-0327 | 25.05 | 24.89 | 25.14 | 23.57 | .21 | 20.07 | ||||||||||
| 13 | F0950+1619 | 23.74 | .10 | 22.49 | .09 | 24.55 | 20.00 | ||||||||||
| 14 | F0952+2405 | 20.72 | .07 | 17.26 | .23 | ||||||||||||
| 15 | F0955+2951 | 24.13 | .13 | 23.07 | .07 | 21.91 | .08 | 21.43 | .10 | 20.31 | .14 | ||||||
| 16 | F0955+0113 | 24.88 | 25.16 | 25.02 | 24.54 | 20.02 | |||||||||||
| 17 | F0956-0533 | 24.91 | 25.15 | 24.97 | 19.06 | ||||||||||||
| 18 | F0958+2721 | 18.96 | .07 | 17.85 | .14 | ||||||||||||
| 19 | F1000-0636 | 25.00 | 20.02 | ||||||||||||||
| 20 | F1008-0605 | 21.71 | .16 | 20.08 | .12 | 18.94 | .20 | 17.98 | .18 | 16.32 | .14 | ||||||
| 21a | F1010+2527NaaMultiple source, possibly an interacting system. | 23.78 | 23.15 | 23.73 | .16 | 22.23 | .16 | 22.08 | .18 | 20.49 | .17 | 18.55 | .22 | ||||
| 21b | F1010+2527SaaMultiple source, possibly an interacting system. | 23.78 | .23 | 23.15 | .11 | 22.48 | .06 | 21.00 | .07 | 21.02 | .08 | 20.02 | .14 | 17.61 | .25 | ||
| 22 | F1010+2727 | 24.22 | 24.47 | 22.44 | .25 | 21.74 | .07 | 22.27 | .17 | 19.00 | .18 | 18.08 | .15 | ||||
| 23 | F1014+1438 | 25.18 | 25.63 | 24.46 | .11 | 22.81 | .07 | 22.46 | .08 | 19.88 | .17 | 18.89 | .13 | ||||
| 24 | F1016+1513 | 25.28 | 25.14 | 24.58 | 20.11 | ||||||||||||
| 25 | F1024-0031 | 17.49 | .33 | ||||||||||||||
| 26 | F1027+0520 | 18.17 | .11 | 17.33 | .06 | 16.67 | .07 | 16.78 | .08 | 15.14 | .14 | ||||||
| 27 | F1039+2602 | 25.14 | 24.61 | .34 | 23.85 | .45 | 22.33 | .28 | 22.29 | .44 | 20.24 | .15 | 18.33 | .04 | |||
| 28 | F1040+2323 | 25.20 | 25.09 | 23.27 | .13 | 20.66 | .17 | ||||||||||
| 29 | F1116+0235 | 21.06 | .15 | 20.50 | .12 | 19.52 | .06 | 18.68 | .07 | 18.83 | .08 | 16.58 | .14 | ||||
| 30 | F1133+0312 | 25.20 | 25.07 | 24.55 | 20.12 | ||||||||||||
| 31 | F1140+1316 | 25.14 | 25.74 | 25.20 | 25.04 | 24.55 | |||||||||||
| 32 | F1147+2647 | 24.99 | 24.89 | 25.24 | .10 | 22.50 | .20 | 22.82 | .12 | 20.66 | .16 | ||||||
| 33 | F1155+2620 | 25.00 | 24.91 | 23.88 | .19 | 22.30 | .08 | 21.98 | .09 | 19.80 | .17 | ||||||
| 34 | F1158+1716 | 19.06 | |||||||||||||||
| 35 | F1202+0654 | 19.02 | |||||||||||||||
| 36 | F1211+3616 | 25.72 | 25.98 | 25.60 | 20.13 | ||||||||||||
| 37 | F1215+3242 | 20.36 | .25 | 18.86 | .21 | 17.98 | .26 | 17.23 | .27 | 16.33 | .19 | 15.83 | .14 | ||||
| 38a | F1217-0529EaaMultiple source, possibly an interacting system. | 24.88 | 24.66 | .09 | 22.34 | .11 | 22.82 | .09 | 18.90 | .26 | |||||||
| 38b | F1217-0529WaaMultiple source, possibly an interacting system. | 24.88 | 24.83 | .17 | 22.98 | .09 | 22.95 | .14 | 20.73 | .17 | |||||||
| 38 | F1217-0529SaaMultiple source, possibly an interacting system. | 24.88 | 25.47 | .19 | 23.58 | .21 | 24.05 | 20.93 | |||||||||
| 39 | F1217+3810 | 15.52 | .14 | ||||||||||||||
| 40 | F1218-0625 | 24.13 | .20 | 23.27 | .20 | 21.91 | .28 | 22.14 | .42 | 19.48 | .18 | ||||||
| 41 | F1218-0716 | 23.82 | .14 | 21.54 | .20 | ||||||||||||
| 42 | F1234+2001 | 24.88 | 23.20 | 19.85 | .28 | 19.58 | .20 | 18.63 | .16 | ||||||||
| 43 | F1237+1141 | 24.02 | 23.99 | .07 | 23.27 | .06 | 22.47 | .07 | 22.38 | .04 | 19.64 | .29 | 18.68 | .14 | |||
| 44 | F1315+4438 | 23.41 | .30 | 23.37 | .20 | 22.66 | .66 | 22.83 | .48 | 20.04 | 21.32 | .15 | |||||
| 45 | F1329+1748 | 20.78 | .11 | 20.32 | .06 | 19.68 | .07 | ||||||||||
| 46 | F1355+3607 | 23.42 | 23.87 | 23.68 | 21.07 | 20.86 | |||||||||||
| 47 | F1430+3557 | 25.18 | 24.14 | 23.52 | 23.14 | 23.59 | 19.89 | 18.86 | .13 | ||||||||
| 48 | F1435-0029 | 25.47 | 25.86 | 26.11 | 25.00 | 22.91 | .12 | 19.87 | .15 | ||||||||
| 49 | F1445+2702 | 20.69 | .07 | ||||||||||||||
| 50 | F1447+1217 | 24.89 | 24.70 | 24.00 | .11 | 22.60 | .09 | 22.16 | .11 | 20.25 | 20.20 | .07 | |||||
| 51 | F1451+0556 | 19.80 | .15 | 19.59 | .11 | 19.01 | .06 | 18.81 | .07 | 19.07 | .15 | 17.80 | .14 | 17.06 | .20 | ||
| 52a | F1458+4319NWbbID unclear | 25.03 | 24.91 | 24.73 | .14 | 22.30 | .09 | 21.99 | .12 | 21.45 | .18 | ||||||
| 52b | F1458+4319SEbbID unclear | 25.03 | 24.91 | 24.41 | .09 | 21.38 | .10 | 21.77 | .09 | 20.19 | .16 | ||||||
| 52c | F1458+4319EbbID unclear | 25.03 | 21.17 | .08 | 21.28 | .09 | 19.29 | .33 | |||||||||
| 53 | F1505+4457 | 25.33 | .15 | 23.98 | .07 | 21.90 | .11 | 21.18 | .07 | 20.94 | .08 | 18.46 | .16 | 18.24 | .28 | ||
| 54 | F1524+5122 | 23.87 | 23.17 | 23.55 | 20.31 | 20.96 | |||||||||||
| 55 | F1644+2554 | 25.20 | 25.13 | 24.55 | 19.89 | ||||||||||||
| 56 | F2217-0837 | 23.14 | .20 | 20.30 | .13 | 20.10 | .07 | 19.03 | .07 | 19.16 | .08 | 17.77 | .24 | 17.31 | .14 | 16.59 | .03 |
| 57a | F2217-0138EaaMultiple source, possibly an interacting system. | 24.98 | 24.48 | .16 | 22.42 | .08 | 20.59 | .07 | 20.88 | .09 | 20.75 | .28 | 18.64 | .15 | 17.48 | .10 | |
| 57b | F2217-0138WaaMultiple source, possibly an interacting system. | 24.98 | 24.89 | 24.60 | .15 | 22.32 | .09 | 22.01 | .14 | 22.00 | .50 | 20.39 | .16 | 19.29 | .34 | ||
| 58 | F2354-0055 | 24.99 | 24.89 | 25.16 | 25.00 | 24.45 | 19.93 |
| Name | SED | |||
|---|---|---|---|---|
| F0023-0904 | 1.49 | -24.10 | Sc | |
| F0129-0140 | 2.44 | -24.73 | SB4 | |
| F0202-0021 | 0.58 | -22.13 | E | |
| F0216+0038 | 0.65 | -22.09 | S0 | |
| F0916+1134 | 1.12 | -22.00 | SB3 | |
| F0919+1007 | 0.78 | -23.08 | S0 | |
| F0938+2326 | 3.88 | -26.42 | SB3 | |
| F0942+1520aaOnly 2 bands detected, Lyman break between H and K. | 3.36 | -26.45 | S0 | |
| F0955+2951 | 4.39 | -25.77 | SB4 | |
| F1008-0605 | 0.27 | -21.32 | E | |
| F1010+2527N | 4.41 | -26.57 | SB4 | |
| F1010+2527S | 4.63 | -27.32 | SB2 | |
| F1010+2727 | 4.53 | -27.87 | Sb | |
| F1014+1438 | 4.47 | -26.58 | SB5 | |
| F1027+0520 | 0.60 | -25.18 | SB1 | |
| F1039+2602 | 3.62 | -26.18 | SB3 | |
| F1116+0235 | 0.62 | -23.20 | SB2 | |
| F1147+2647 | 4.75 | -25.98 | SB1 | |
| F1155+2620 | 4.54 | -26.79 | SB3 | |
| F1215+3242 | 0.11 | -19.86 | S0 | |
| F1217-0529E | 4.95 | -29.93 | S0 | |
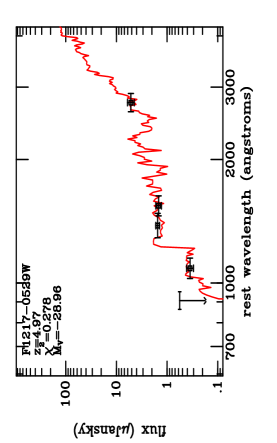
| F1217-0529W | 4.97 | -28.96 | E | |
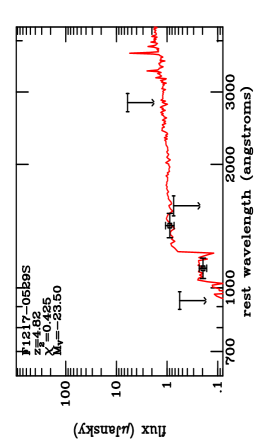
| F1217-0529S | 4.82 | -23.50 | SB2 | |
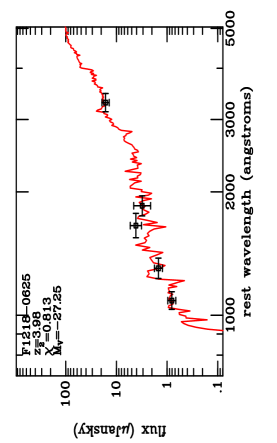
| F1218-0625 | 3.98 | -27.25 | Sb | |
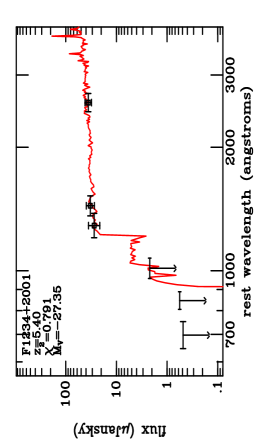
| F1234+2001 | 5.40 | -27.35 | SB4 | |
| F1237+1141 | 2.38 | -24.34 | SB2 | |
| F1315+4438 | 2.77 | -22.49 | SB2 | |
| F1447+1217 | 4.70 | -25.11 | SB3 | |
| F1451+0556 | 2.71 | -26.70 | SB2 | |
| F1458+4319NW | 5.05 | -24.40 | SB2 | |
| F1458+4319SE | 5.03 | -26.06 | SB2 | |
| F1505+4457 | 0.55 | -20.52 | Sa | |
| F2217-0837 | 0.26 | -20.16 | E | |
| F2217-0138E | 4.55 | -27.81 | SB2 | |
| F2217-0138W | 4.99 | -26.35 | SB2 |


4.2. FIR-Submillimeter
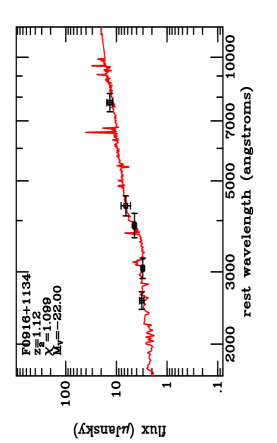
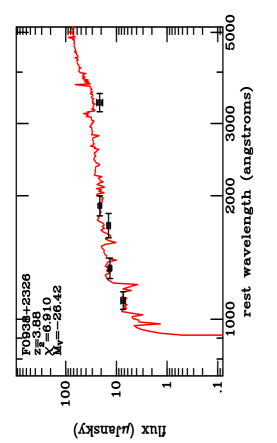
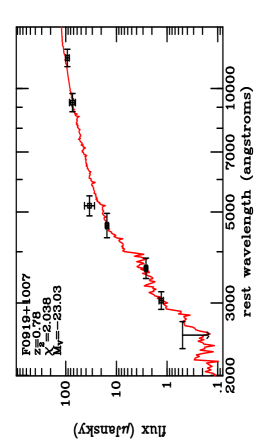
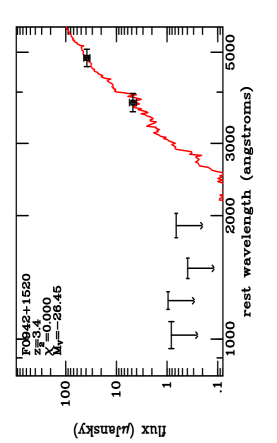
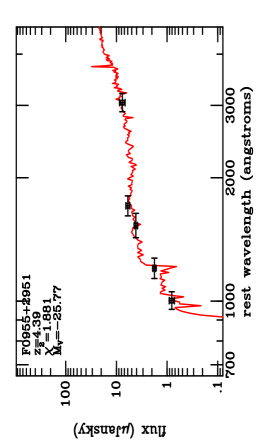
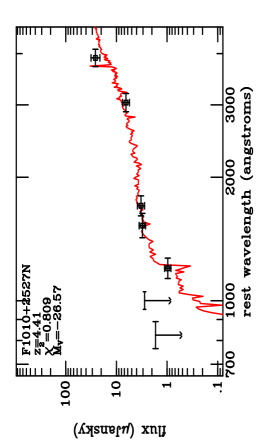
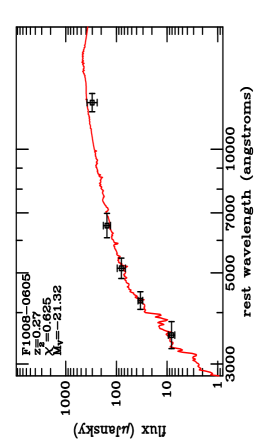
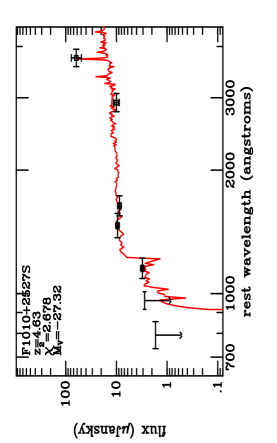
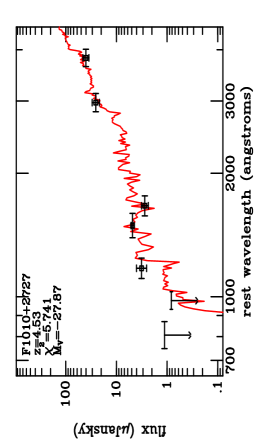
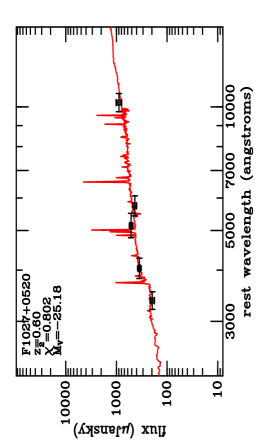
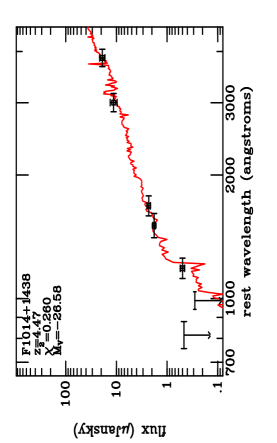
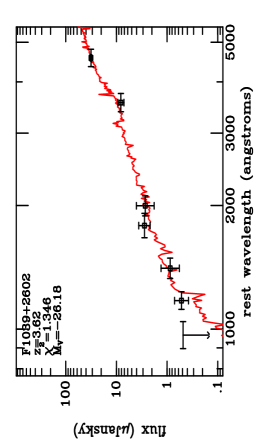
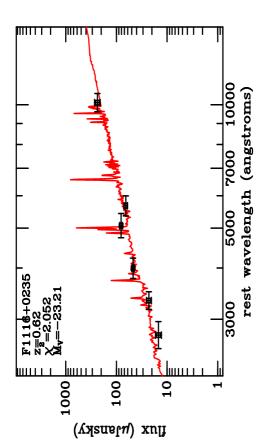
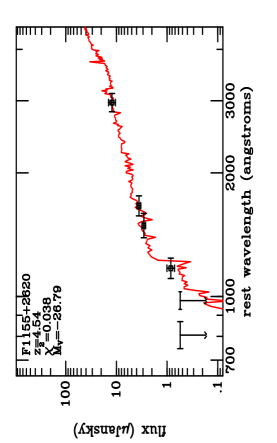
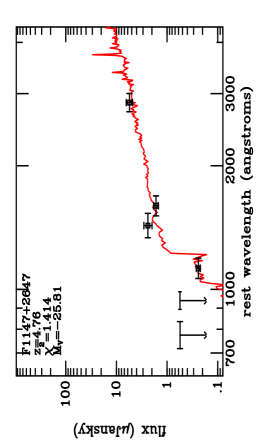
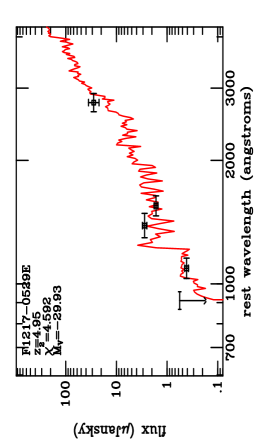
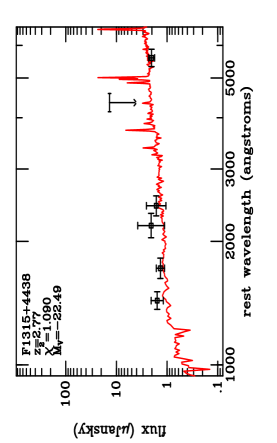
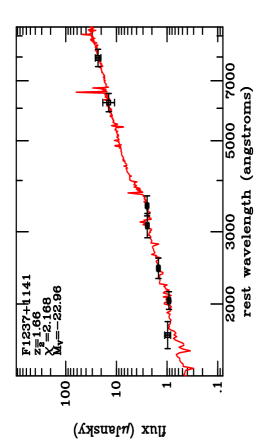
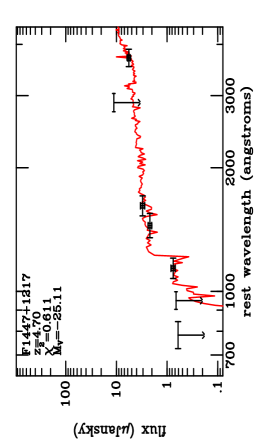
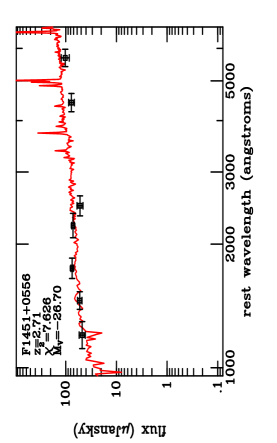
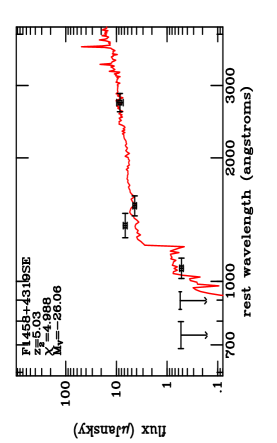
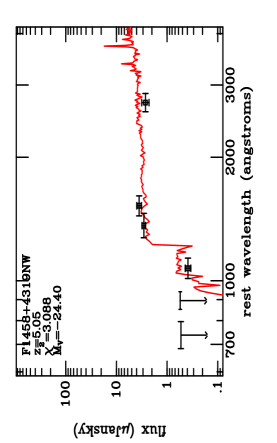
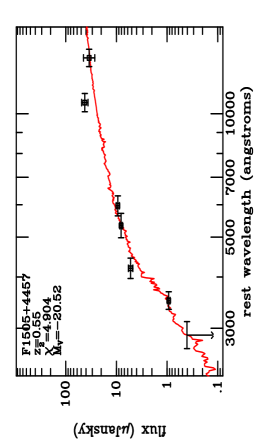
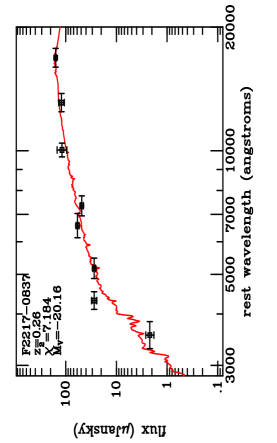
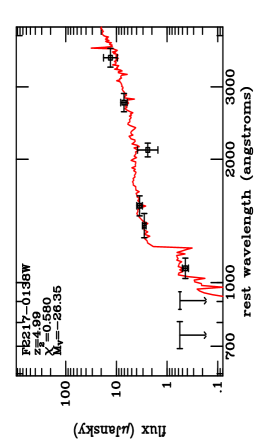
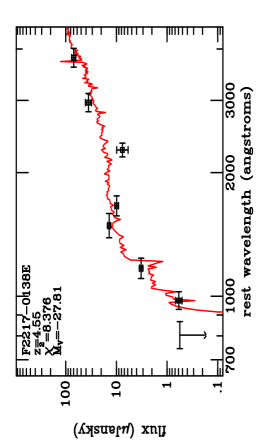
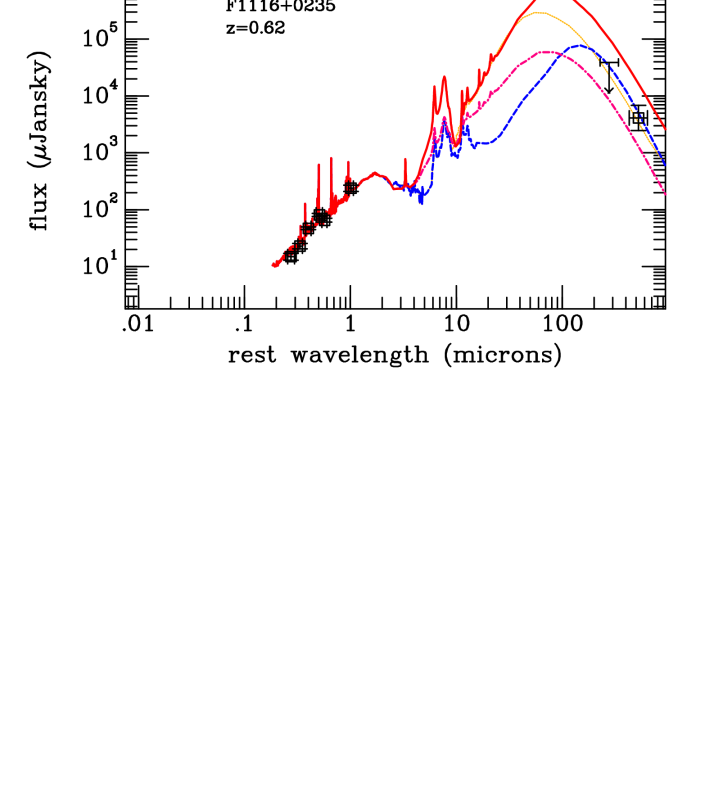
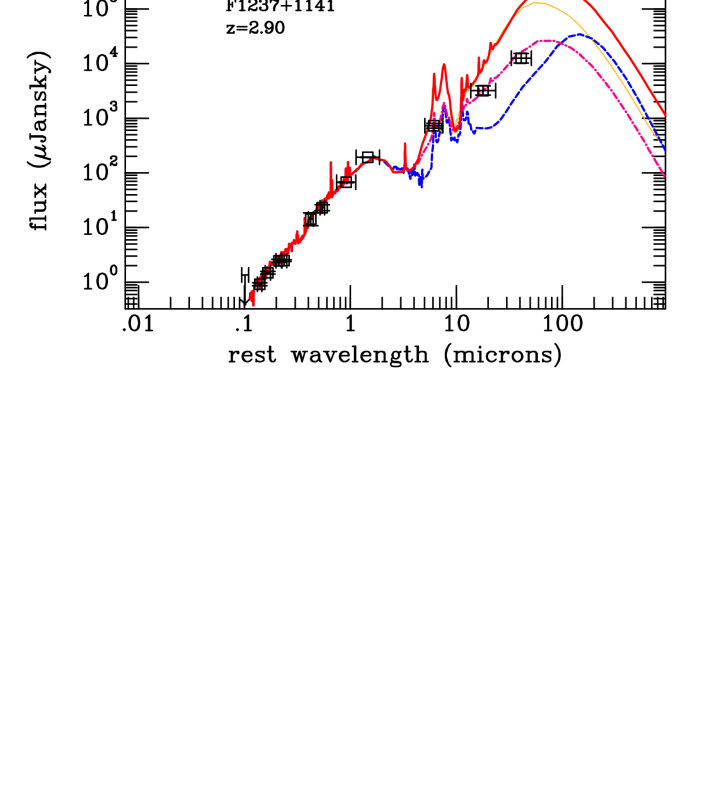
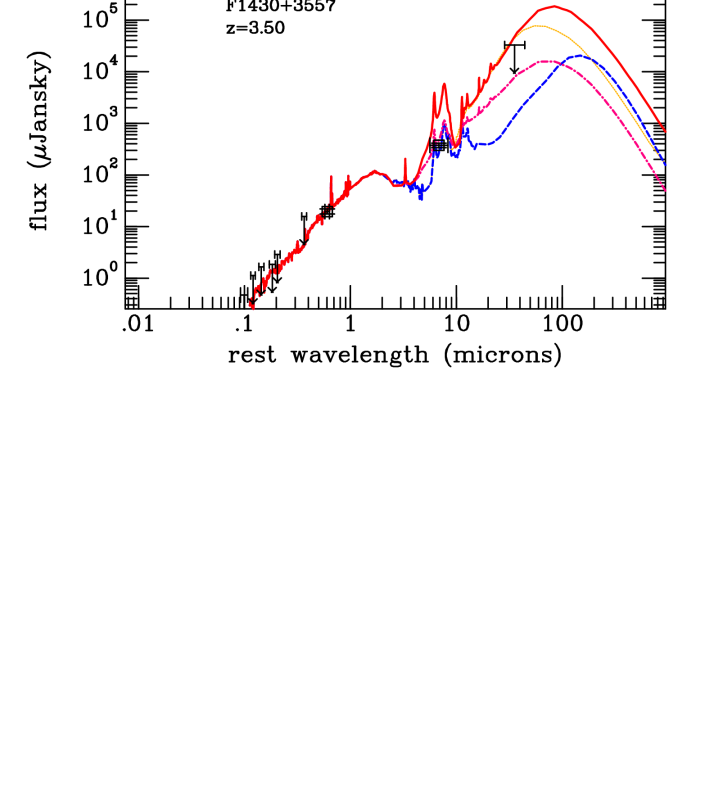
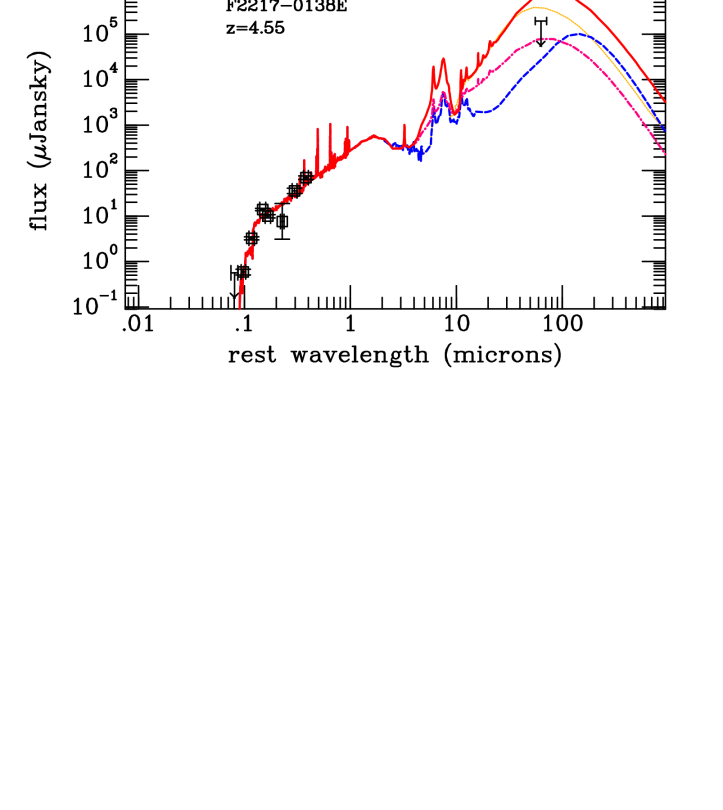
The photometric measurements from the long-wavelength data were added to the previous optical and NIR photometry. The SED templates used previously cover the rest-frame wavelengths from 100Å to 3m, so were further extended to the submillimeter with 4 long-wavelength templates (see Appendix A for a more detailed description of the procedure). The templates used were Arp 220 (Bressan et al., 2002) representing a ULIRG SED, M82 (Bressan et al., 2002) representing a starburst SED, and 2 templates in the synthetic library from Dale et al. (2001) representing LIRGs (=1.06) and quiescent (=2.5) SEDs. The best fit SEDs with each long-wavelength SED template is shown in Figures 18-21.
For the four objects with FIR flux measurements, all seem to exclude an Arp-220 (ULIRG). Also the three at high redshift () seem to exclude a LIRG-type SED. The only constrained model (from multiple Spitzer detections) at z2.90 quite definitely shows a M-82 (starburst) type SED.


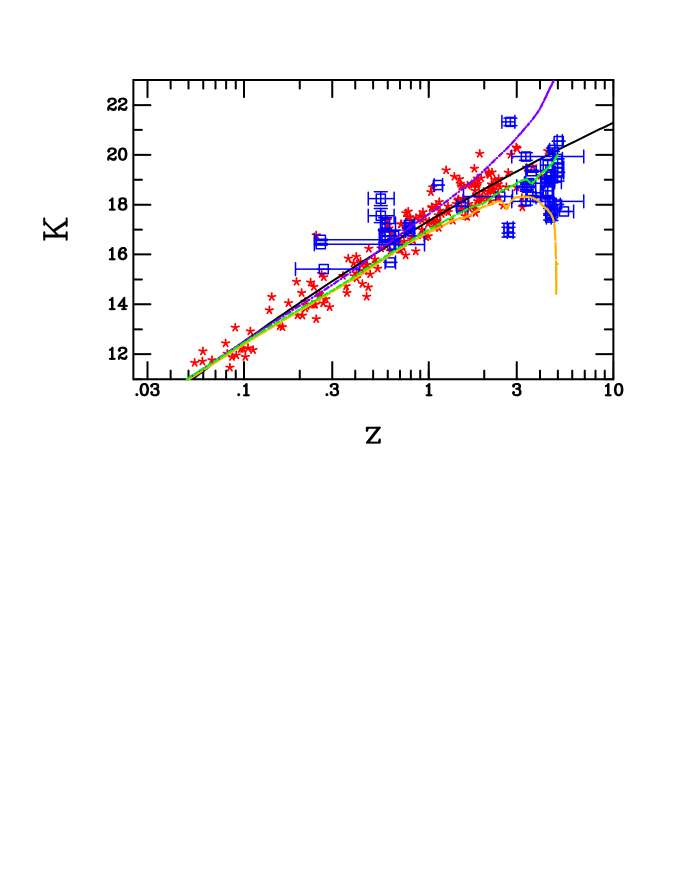
4.3. The IR Hubble Diagram
In Figure 22 we plot the K-band Hubble Diagram, with literature data compiled by Willott et al. (2003). These data sets include more powerful radio galaxies and quasars with spectroscopic redshifts compared to the FIRST-BNGS sample with photometric redshifts (including the long wavelength SED solutions from section 4.2 and H-band fluxes converted to K-band when necessary according to the best-fit SED). The literature magnitudes have been corrected to a common physical aperture (63.9 kpc) and also accounted for expected strong emission line flux according to a prescription by Jarvis et al. (2001). Our K-band fluxes were corrected to the same physical aperture according to the GALFIT models. The best-fit second-order polynomial of the literature data traces closely a passively evolving stellar population that formed at z10 from Bruzual & Charlot (2003) as noted by Willott et al. (2003). The agreement between the literature and the FIRST-BNGS sample is reasonable considering the accuracy of photometric redshifts relative to the spectroscopic redshifts of the literature. Also it is probable that our data is incomplete at faint flux levels (there are about 20 FIRST-BNGS sources not detected in H or K) since we were only surveying in H-band to a particular depth (H21). The FIRST-BNGS sample seems to follow the passively evolving population out to at least .
5. Spectroscopy
Throughout the initial and follow-up phases of this project, we had the opportunity to observe these objects with various spectrographs on Mauna Kea to confirm the photometric redshifts. These observations were challenging because of the faintness of the science targets, particularly for slit alignment and guiding over long integration times. However, the acquisition problems were largely solved because of the accurate offsets (from the Pueo-KIR AO observations) from the nearby bright AO guide star. This also helped with tracking using the AO star on the guider. Table 7 lists the observed targets, dates, and observing mode used.
Several of the brightest NIR sources in the sample were observed with SpeX (Rayner et al., 2003) on IRTF for several hours each in low-resolution prism mode to get the widest spectral coverage (0.8-2.5 m) and best sensitivity. Reductions were done with Spextool (Cushing et al., 2004; Vacca et al., 2003) including wavelength, flux, and telluric calibrations.
Some of the optically brightest objects were observed with the Gemini-North Multiobject Spectrograph (GMOS; Hook et al. (2003)) in long-slit, nod and shuffle mode. Reductions were done using the GMOS IRAF reduction package with the nod and shuffle routines to carry out wavelength and flux calibrations. No telluric correction was done.
A few of the most interesting sources were observed with the OH-suppressing IR Imaging Spectrograph (OSIRIS; Larkin et al. (2006)) on Keck II. This AO-fed integral field spectrograph utilizes a lenslet array to obtain full near-IR broadband spectral coverage (z, J, H or K) at R4000 resolution at approximately 1000 well-sampled spatial locations. It is more efficient than a traditional longslit spectrograph as no light from extended objects is blocked out by the slit. In addition, the high resolution enables observations between the bright OH sky lines, resulting in lower background noise. The data reductions were done with the OSIRIS data reduction pipeline written in IDL, which provided a wavelength rectified data cube for each object observed. Flux calibration, telluric correction, and spectral extraction were accomplished with our own IDL scripts.
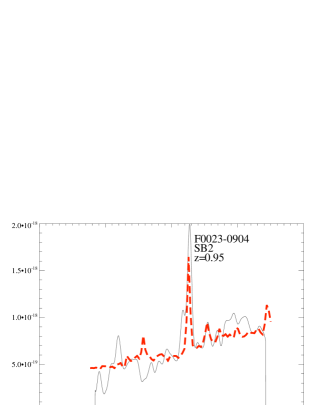
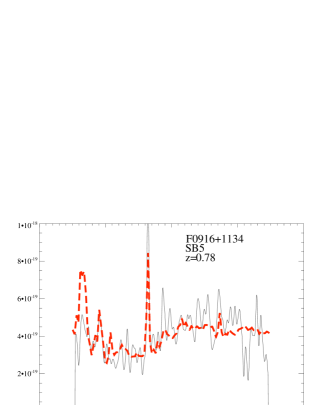
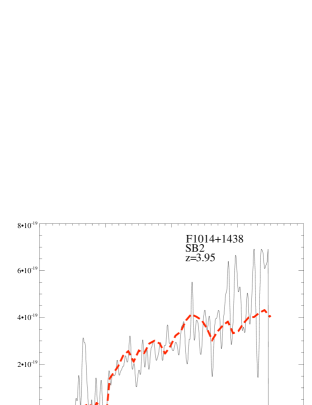
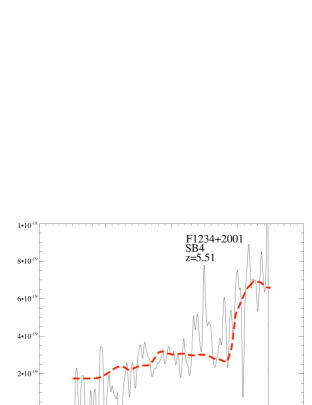
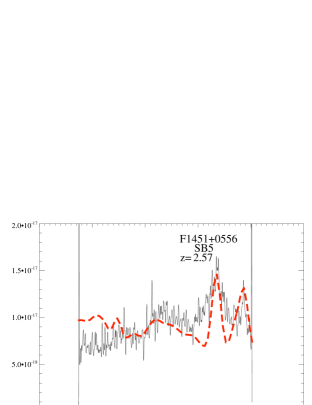
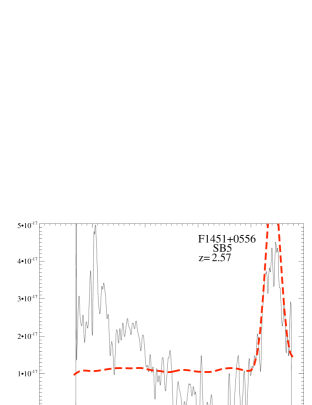
For each object observed with each instrument, we fit the flux and wavelength calibrated 1-D spectra to the same SED library of 7 templates we used for the photometric redshifts, allowing redshift and luminosity to vary, and matching the spectral resolution to the data via convolution. We used IDL-based routines to perform a least-squares fit of the templates to each spectrum. Figure 23 shows examples of the best fits of template models with the data and Table 8 lists the results from these fits. A number of real and spurious features were found by examining the individual beam exposures. We discuss each object briefly below.
F0023-0904 with GMOS has a confirmed [OII] 3727 detection at 7280Å and forbidden [NeIII] 3869 at 7550Å.
F0916+1134 with GMOS has a confirmed [OII] 3727 detection at 6640Å , and contamination from a nearby source is present at 8160Å.
F1014+1438 with GMOS shows a steep break at about 6100Å which was well fit to the Lyman break of a SB2 SED.This is consistent with the Hyperz fit.
F1234+2001 with GMOS has a steep break at 7900Å. This was successfully fit to the Lyman break, but with no other features is not conclusive. The two OSIRIS spectra show faint continuum with no large features, and the SpeX data shows a faint continuum and possibly the Lyman break just at the edge of sensitivity. All four fits roughly agree are also consistent with the photometric Hyperz fit of a z5.5 starburst.
F1237+1141 with GMOS is featureless and flat except some bad sky subtraction at 7900Å to 8000Å. The OSIRIS data shows a break at 1.6m and perhaps [OII] 3727 at 1.5m.
F1451+0556 with GMOS shows the edge of [CIV] 1550 at 5400Å and [CIII] 1909 at 6800Å. SpeX shows [MgII] 2798 at 1.0m, [OII] 3727 at 1.35m, H/[OIII] 5007 at 1.73m, and H at 2.32m. The bad fit to H is probably because in the templates there is a sharp transition in H flux between SB2 and SB3 templates. OSIRIS also shows H at 1.73m, [OIII] at 1.79m, and H at 2.32m. The equivalent widths of H and H were measured by Gaussian fitting and given in Table 9. If we adopt the best S/N (SpeX) measurements, the derived reddening is E(B-V)=1.73.
F1505+4457 with GMOS shows the Balmer break fit at about 8000Å. The SpeX data is consistent with the Balmer break and a smooth continuum.
F2217-0138 with GMOS shows a break which was fit to the Lyman break.
The rest of the spectroscopy did not produce any well-constrained redshifts. A few objects were detected in continuum at relatively low S/N, but without a definitive spectral break or emission lines, the fits could only confirm that the photometric redshifts were consistent with the spectra. We present these less-constrained spectroscopic results in Table 10.

The well-constrained spectroscopic redshifts may be compared to the photometric redshifts derived in the previous section. Figure 24 shows the comparison between the two.
The photometric redshifts match the spectroscopic ones well with a RMS of z/(1+z)=0.146. This confirms that the photometric redshifts, though less accurate than spectroscopic ones, are still valid overall. Historically, Monte Carlo simulations for photometric redshifts from optical+NIR surveys have determined a typical error of z/(1+z)=0.08 (Labbé et al., 2003), but more conservatively estimate 0.1. This is an encouraging result considering our spectral template library may not be an accurate representation of the high redshift stellar populations we observed. It also adds confidence to our photometry measurements that were made in difficult regions (near a bright star with diffraction spikes and near the edge of the detector).
| Name | Instruments | SED | |||
|---|---|---|---|---|---|
| F0023-0904aa []3727 detected | GMOS | 0.95 | 0.01 | -19.41 | SB2 |
| F0916+1134aa []3727 detected | GMOS | 0.78 | 0.01 | -20.53 | SB5 |
| F1014+1438bb break detected | GMOS | 3.95 | 0.15 | -23.80 | SB2 |
| F1234+2001bb break detected | GMOS,SpeX,OSIRIS | 5.56 | 0.07 | -27.59 | SB4 |
| F1237+1141bb break detected | GMOS,OSIRIS | 3.01 | 0.04 | -23.42 | SB3 |
| F1451+0556cc []2799, []3727, , []5009, and detected (possibly [1909) | GMOS,SpeX,OSIRIS | 2.57 | 0.01 | -26.76 | SB5 |
| F1505+4457bb break detected | GMOS,SpeX | 1.02 | 0.03 | -20.45 | Sa |
| F2217-0138Ebb break detected | GMOS | 4.66 | 0.26 | -27.99 | SB2 |
6. VLA observations
VLA observations were carried out on Nov 28th, 2004, Feb 28th, 2006, and April 20th, 2006 with the VLA in A-array configuration at 3.6cm. In addition, a VLA archive search resulted in 2 observations of F1445+2702 (known as IRAS14434+2714) on April 13th 1998 and January 14th, 2001 with the same VLA configuration. We used calibrators 0016-002, 0137+331, 0219+013, 0954+177, 0956+252, 1331+305, 1335+457, 1415+133, 1436+233, 1500+478, 2229-085 for flux and phase calibration. All data were reduced using standard packages within the Astronomical Image Processing System (AIPS). Some sources were observed multiple times and were coadded to produce the final map.
| Instrument | EW | EW | ||
|---|---|---|---|---|
| SpeX | 1515Å | 519Å | 74.9Å | 53.6Å |
| OSIRIS | 2266Å | 3374Å | 150Å | 36Å |
| Name | Instruments | SED | |||
|---|---|---|---|---|---|
| F0129-0140 | GMOS | 1.71 | 0.40 | -22.80 | SB5 |
| F0202-0021 | GMOS,SpeX | 0.60 | 0.30 | -22.15 | E |
| F0216+0038 | GMOS,SpeX,OSIRIS | 0.56 | 0.30 | -21.49 | S0 |
| F0919+1007 | OSIRIS | 0.79 | 0.30 | -23.08 | SB5 |
| F1116+0235 | SpeX | 0.31 | 0.20 | -20.65 | Sc |
| F1447+1217 | GMOS | 4.60 | 0.50 | -24.79 | SB5 |
| F2217-0837 | SpeX | 0.31 | 0.20 | -20.16 | E |
With the VLA A-array at 3.6cm, the largest angular scale detectable is 7.0 arcseconds and the primary beam is about 0.24 arcseconds. Flux densities were measured using the IRAF “phot” package and converted to flux units. Background noise was also measured to derive flux errors and upper-limits for non-detection. For multiple sources (double, triple, distorted morphologies), the fluxes were added together. Figure 25 shows example radio maps from FIRST and from our VLA A-array observations. Table 11 shows our measurements along with the best-fit photometric or spectroscopic redshifts plus spectral indices. The spectral index, , where , was calculated for each discrete radio source in the field as well as the total flux of all the sources coadded.
| Name | SED | morpha | ||||||||
|---|---|---|---|---|---|---|---|---|---|---|
| F0023-0904 | 0.946 | -19.41 | SB2 | 2.56 | 0.09 | 15.28 | 0.13 | -1.04 | elong | |
| F0129-0140 | 2.76 | -25.07 | SB6 | 0.83 | 0.08 | 3.70 | 0.14 | -0.87 | elong | |
| F0152-0029 | 3.79 | 0.09 | 24.69 | 0.17 | -1.09 | unres | ||||
| F0152+0052E | 2.17 | 0.09 | 9.88 | 0.17 | -0.88 | tpl | ||||
| F0152+0052W | 1.92 | 0.09 | 6.97 | 0.17 | -0.75 | tpl | ||||
| F0152+0052C | 0.73 | 0.09 | 0.6 | 0.11 | tpl | |||||
| F0152+0052tot | 4.83 | 0.09 | 16.85 | 0.17 | -0.73 | tpl | ||||
| F0202-0021 | 0.58 | -22.13 | E | 0.27 | 2.79 | 0.11 | -1.36 | elong | ||
| F0216+0038E | 0.65 | -22.09 | S0 | 2.32 | 0.08 | 17.84 | 0.10 | -1.19 | dbl | |
| F0216+0038W | 0.65 | -22.09 | S0 | 0.42 | 0.08 | 12.10 | 0.10 | -1.96 | dbl | |
| F0216+0038tot | 0.65 | -22.09 | S0 | 2.74 | 0.08 | 29.94 | 0.10 | -1.39 | dbl | |
| F0916+1134E | 0.78 | -20.53 | SB5 | 1.38 | 0.20 | 3.45 | 0.15 | -0.53 | elong | |
| F0916+1134W | 0.78 | -20.53 | SB5 | 0.6 | 1.09 | 0.15 | -0.35 | elong | ||
| F0916+1134tot | 0.78 | -20.53 | SB5 | 1.38 | 0.20 | 4.54 | 0.15 | -0.69 | elong | |
| F0919+1007 | 0.79 | -23.08 | SB5 | 9.71 | 0.25 | 8.97 | 0.15 | 0.05 | elong | |
| F0942+1520E | 3.36 | 6.17 | 0.16 | 11.70 | 0.17 | -0.37 | dbl | |||
| F0942+1520W | 3.36 | 0.72 | 0.16 | 4.00 | 0.17 | -1.00 | dbl | |||
| F0942+1520tot | 3.36 | 6.89 | 0.16 | 15.70 | 0.17 | -0.48 | dbl | |||
| F1010+2527 | 4.63 | -27.32 | SB2 | 0.33 | 1.31 | 0.15 | -0.80 | unres | ||
| F1010+2727N | 4.53 | -27.87 | Sb | 0.33 | 2.36 | 0.15 | -1.15 | dbl | ||
| F1010+2727S | 4.53 | -27.87 | Sb | 0.33 | 3.58 | 0.15 | -1.39 | dbl | ||
| F1010+2727tot | 4.53 | -27.87 | Sb | 0.33 | 5.94 | 0.15 | -1.69 | dbl | ||
| F1014+1438E | 3.95 | -23.80 | SB2 | 0.33 | 17.14 | 0.17 | -2.30 | tpl | ||
| F1014+1438W | 3.95 | -23.80 | SB2 | 0.33 | 15.60 | 0.17 | -2.25 | tpl | ||
| F1014+1438C | 3.95 | -23.80 | SB2 | 4.11 | 0.11 | 0.6 | 1.12 | tpl | ||
| F1014+1438tot | 3.95 | -23.80 | SB2 | 4.11 | 0.11 | 32.74 | 0.17 | -1.21 | tpl | |
| F1237+1141N | 3.01 | -23.42 | SB3 | 3.92 | 0.05 | 11.91 | 0.17 | -0.65 | tpl | |
| F1237+1141S | 3.01 | -23.42 | SB3 | 0.45 | 0.05 | 4.56 | 0.17 | -1.35 | tpl | |
| F1237+1141C | 3.01 | -23.42 | SB3 | 1.06 | 0.05 | 1.36 | 0.17 | -0.15 | tpl | |
| F1237+1141tot | 3.01 | -23.42 | SB3 | 5.43 | 0.05 | 17.83 | 0.17 | -0.69 | tpl | |
| F1315+4438 | 2.77 | -22.49 | SB2 | 0.08 | 0.89 | 0.17 | -1.40 | dist | ||
| F1355+3607 | 0.23 | 3.48 | 0.17 | -1.58 | dist | |||||
| F1430+3557 | 3.5 | -24.82 | SB3 | 2.13 | 0.08 | 8.54 | 0.17 | -0.81 | unres | |
| F1445+2702 | 13.14 | 0.04 | 31.07 | 0.17 | -0.50 | unres | ||||
| F1447+1217 | 4.70 | -25.11 | SB3 | 9.15 | 0.14 | 48.90 | 0.17 | -0.98 | unres | |
| F1451+0556 | 2.567 | -26.76 | SB5 | 2.57 | 0.10 | 2.35 | 0.17 | 0.05 | unres | |
| F1505+4457N | 1.02 | -20.45 | Sa | 1.76 | 0.14 | 7.84 | 0.17 | -0.87 | dbl | |
| F1505+4457S | 1.02 | -20.45 | Sa | 8.04 | 0.14 | 9.24 | 0.17 | -0.08 | dbl | |
| F1505+4457tot | 1.02 | -20.45 | Sa | 9.80 | 0.14 | 17.08 | 0.17 | -0.32 | dbl | |
| F1524+5122 | 8.23 | 0.14 | 22.45 | 0.17 | -0.59 | unres | ||||
| F2217-0138E | 0.48 | -20.78 | S0 | 25.2 | 0.15 | 26.37 | 0.17 | -0.03 | unres | |
| F2354-0055 | 0.31 | 0.04 | 1.38 | 0.17 | -0.87 | unres |
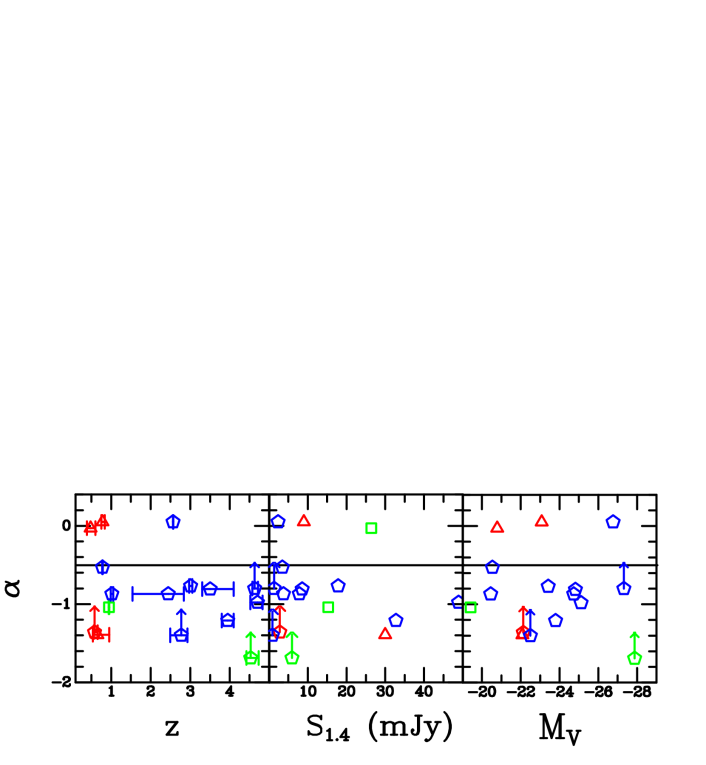
Plotting spectral index of each object’s total fluxes, versus 20-cm flux, redshift, absolute magnitude, there is no clear indication of any trends with in this data set (Figure 26) though there are more steep-spectrum () sources observed than flat-spectrum () sources (9 vs. 3).
7. Discussion of Individual Objects
Below is a discussion the properties of the 58 individual sources in the FIRST-BNGS sample.
F0023-0904 was detected in all bands, giving a photometric redshift of 1.49 with an Sc SED. Spectroscopy revised the redshift to 0.946 with an [OII] emission detection. The FIRST radio peak is offset about 3′′ from the galaxy, but the outer contours are elongated in the direction of the galaxy, suggesting a jet structure. VLA X-band morphology was inconclusive, but provided a spectral slope of -1.04.
F0129-0140 had 2 solutions for photometric redshifts at 0.65 with an SB2 SED and 2.44 with an SB4 SED. Without any discernible break, it was not obvious which is the better solution. Additionally, spectroscopy gives a rough redshift of 1.7 from the spectral slope in the 5500-8000 Angstrom range which does not break the degeneracy. A compact moderate radio flux with faint optical flux suggests a higher redshift as the low redshift would give such a low luminosity (), it would be difficult to reconcile with an AGN host. We will use the high photometric redshift solution because it was more constrained than the spectroscopic fit.
F0152-0029 was undetected in all bands except K. It does not have a constrained redshift so is either at z8.0 where the Lyman break is redshifted out of z-band (see figure 20) or a highly reddened object. The radio source is compact with a relatively high radio 20cm luminosity (25mJy) and steep spectral index (-1.09), suggesting an AGN source.
F0152+0052 was not detected in any band (B, V, R, I, z′, J, and H). A triple morphology in X-band, and high 20cm flux (18mJy) and steep spectral index (-0.73) suggests an high redshift AGN.
F0202-0021 appears to be well fit by a low redshift elliptical SED (), but also has a secondary solution at . The brightness and redshift inferred from the K-z relation derived in section 2.4 () supported the first solution and was roughly confirmed with spectroscopy (). An elongated radio morphology and lower radio 20cm flux (3mJy) with a steep spectrum also is consistent with a giant elliptical with an AGN at low redshift.
F0216+0038 has a SED consistent with the S0 template at which is lower than that inferred from the K-z relation derived in section 2.4 (), but was roughly confirmed with spectroscopy. A moderate 20cm flux (12mJy) and double radio lobe morphology with steep spectral index (-1.39) suggests a relatively powerful AGN, perhaps near the end of an active accretion stage.
F0916+1134 appears to be a barred-spiral from the residuals in surface brightness fitting (Stalder & Chambers, in prep.). K-band photometry was excluded from photo-z fitting (due to the poor residuals in the profile fit), which found a best redshift of 1.12 with a starburst SED. A confirmed [OIII] 3727Å detection with spectroscopy gives a final redshift of 0.78.
F0919+1007 appears to have a low redshift () S0 SED. Moderate radio 20cm flux (9mJy) with elongated morphology is also consistent with a low-redshift giant elliptical with an AGN.
F0938+2326 has 2 solutions for photometric redshifts at 0.8 with a SB2 SED and 3.88 with SB3 SED. The moderate to high 20-cm flux (8.1mJy) with compact morphology, along with the relatively faint optical flux, favors the higher redshift solution.
F0939-0128 was not detected in V, R, z′, or H bands.
F0942+1520 was undetected in all bands except H and K. Because of the large H-K color, Hyperz could fit the break with a redshift of 3 to 6.5. The high radio 20cm flux (12mJy) and double-lobe morphology is consistent with a high-redshift AGN.
F0943-0327 was undetected in B, V, R, and H, but barely detected in I () and has a very high radio 20cm flux (99mJy) and double-lobe morphology.
F0950+1619 was detected in R and I though the ID is slightly offset (about 5′′) from the radio peak so it is possibly another blank field. There were also no detections in z and H bands.
F0952+2405 was detected in both I and H bands. It is bright in H band, and a faint radio source (1.3mJy). It is probably not at high redshift (the K-z relation gives likely redshift of z=0.76).
F0955+2951 has a distorted radio morphology with the radio peak offset from the optical ID by about 5′′. The optical and IR morphologies appeared extended. The best fit photometric redshift is a z=4.4 starburst. Since it is not likely the true optical ID for this radio source, we will not use it in the subsequent analysis.
F0955+0113 was not detected in any observed filter (V, R, I, z′ and H).
F0956-0533 was not detected in V, R, I, or H bands.
F0958+2721 similar to F0952+2405, detected in I and H and relatively bright with faint 20cm radio source (2.4mJy), so probably not at high redshift.
F1000-0636 was not detected in I or H filters.
F1008-0605 was detected and relatively bright in all observed filters (B, V, R, I, and H). A break was found and fit by Hyperz to either a elliptical SED or SB4 SED with little extinction. If the high redshift solution were correct, it would be hard to reconcile this particular object with a hierarchical merging scenario especially since it would have an extremely luminous stellar population () dominating its rest frame UV light, which has to be assembled in less than 2.3Gyr (age of the universe at that redshift). We therefore adopt the low redshift solution.
F1010+2527 has a close double morphology in most bands. There was not any observed evidence of interaction, but the photometric redshifts of the two galaxies were similar (,), which suggests they are associated. Both are consistent with starburst SEDs. The south source’s parameters were used in the subsequent analyses because the fit was better constrained. The unresolved, low 20cm flux (1mJy) radio source also supports that this is not an aligned object.
F1010+2727 has an SED consistent with a high redshift Sb model (). A moderate 20cm radio source (6mJy total) and double-lobe morphology also suggests a high redshift.
F1014+1438 appears to be a starburst at high redshift (), but a low redshift () solution was also found. Because of the faintness of the source and the presence of a steep break observed with spectroscopy, we chose the high redshift solution. Double-lobe moderate 20cm flux (33mJy integrated) radio source is also consistent with a high redshift AGN.
F1016+1513 was undetected in R, I, z′, and H bands.
F1024-0031 was detected in H, and with the most powerful radio 20cm flux (158mJy) in the sample, is almost certainly an AGN. Based on the H-band brightness, it is probably at a redshift around 0.8.
F1027+0520 was fit to a z=0.6 starburst SED template. It is a bright galaxy, so is potentially at lower redshift due to our low confidence in our photometric measurements for bright extended objects and determining a good sky level around them. It has a compact radio source with relatively high 20cm flux (23mJy).
F1039+2602 has an SED best fit by a young starburst SB3. Its moderate radio 20cm flux (12mJy) and double morphology is also consistent with high redshift.
F1040+2323 has a weak (1.6mJy) radio source blank in R and I, but faintly detected in z′ and H.
F1116+0235 has a best-fit photometric redshift at 0.62 which is consistent with a continuum fit from spectroscopy. It also has a 2 detection at 850m from SCUBA, which can only exclude a Arp 220-type (ULIRG) SED at the same redshift as the optical/NIR photometric redshift.
F1133+0312 was undetected at R, I, z, and H bands and is at the lower threshold of the FIRST survey (0.8mJy).
F1140+1316 was not detected at B, V, R, I, and z′. A double-lobed morphology suggests an AGN.
F1147+2647 has a possible faint optical ID about 6 arcseconds to the west of the weak radio peak (0.7mJy), so it is probably not the proper ID and will not be used in later analyses, though the best fit SED is a z=4.75 SB1 type SED.
F1155+2620 has a 1mJy radio source with an optical counterpart about 3 arcseconds to the southeast of the radio peak. Hyperz gives the best-fit photometric redshift at 4.5 with a starburst SED.
F1158+1716 undetected in H.
F1202+0654 undetected in H.
F1211+3616 undetected in V, R, I, and H.
F1215+4342 appears to be a bright S0 type galaxy at z=0.1 with a relatively high 20cm flux (45mJy) radio source. Although there was a solution at high redshift, the extreme optical luminosity () estimated for that redshift and extended radio morphology suggest the low redshift solution is more likely.
F1217-0529 is another optical double (possibly triple) source which also has similar photometric redshifts (z=4.95 and z=4.97 for the east and west sources respectively). However, the radio peak is offset slightly (about 3′′) to the south, closer to the faint (R=25.5) south optical source.
F1217+3810 was detected at H-band and is relatively bright, so it is probably at low redshift () with a weak (0.8mJy) radio source.
F1218-0625 was detected in V, R, I, z′ and H. Two photometric redshift solutions were found though any redshift between 0 and 4.5 gives reasonable fits. The compact moderate 20-cm flux (4.3mJy) and faint optical flux suggest the higher redshift is more likely, but with a large possible range.
F1218-0716 was barely detected in V and H bands. It also is a weak (0.8mJy) and distorted radio source.
F1234+2001 was identified about 4′′ to the southwest from the moderate radio peak (5mJy) of the FIRST source J123432.9+200134. This seems a bit far given the position accuracy of FIRST (about 1′′) and our imaging data (about 0.3′′) derived from the USNO-A2.0 catalog. Since the only optical/IR source in the field around the radio source is F1234+2001 there are 3 possibilities: 1) The source we have identified is unrelated or a companion to the radio source J123432.9+200134 in which case the radio source host is below the detection threshold of H=19.74 (3); 2) The optical emission is offset from the center of the host galaxy due to the alignment effect (Chambers et al., 1987) though the radio source is too weak to be regarded as a powerful radio source at any epoch which makes this scenario unlikely; or 3) The radio source is intrinsically asymmetric due to relativistic beaming, so the radio centroid of J123432.9+200134 is not centered on the host galaxy F1234+2001. For the remainder of the paper we accept that optical/IR source, F1234+2001, to be the host of J123432.9+200134. The confidence in this ID is strengthened from the subsequently derived redshifts.
It should be noted that a diffraction spike passes through the optical ID in V, R, I, and z′. GALFIT successfully modeled this and the good residuals raise our confidence in the photometric measurements. The best fit SED to the broadband photometry is a starburst mainly from fitting the Lyman break between R and I bands. Though the R-band image is relatively shallow, the V-band imaging is deeper which did confirm that this object was at least . At , the imaging data spans the UV wavelength range in the galaxy’s rest-frame from 800Å (V-band) to 2800Å (H-band). The galaxy is unresolved in all bands, including the AO H-band (0.29′′ FWHM) making its physical extent on order or less than 1.7 kpc (1.0′′ corresponds to 6.0 kpc at ).
Unfortunately if the observed spectral break is the Lyman break, there are few powerful emission lines to observe spectrally in this wavelength range. The Lyman break would be observed at about 8000Å which will make it the primary spectroscopic feature for our fitting routine. Because it is so bright (I19.85), absorption features may be also detectable with a 8-10 meter class red-sensitive spectrograph.
The GMOS spectroscopy does show a strong break around 7900Å and confirms our photometric redshift fit that the Lyman break is between R and I bands. The signal to noise ratio of the spectrum was insufficient to identify any absorption features.
The SpeX spectroscopy also shows the Lyman break though just at the edge of sensitivity. Both spectra are also consistent with the photometric data, give similar redshifts and are within the error of the photometry-derived redshift (Tables 5 and 8). A weighted average of the three redshifts gives a best estimate at . These three independent measures suggest that if the optical ID, F1234+2001, is associated with the radio source, J123432.9+200134, it would make it the most distant known radio galaxy. However, this redshift should be confirmed with deeper spectroscopy.
F1237+1141 is consistent with a moderately high redshift () starburst SED. The radio morphology is a triple system at low radio 20cm flux (1mJy) with the ID corresponding with the center source consistent with this redshift. It was also observed with both IRAC and MIPS, which changed the best fit redshift to 2.9 to reflect the 5.8m data point, but with large error bars. The SED beautifully fits a starburst with a long wavelength starburst SED (M82) from a rest wavelength of 110 nm to 40 microns. This is a superb illustration of the potential of Spitzer for both photometric redshifts and studies of the stellar environment of these objects. Spectroscopy better constrained the redshift to 3.01.
F1315+4438 is the faintest detected object in the HzRG candidate sample (). Hyperz found 2 photometric redshifts, a SB1 SED at and a SB2 SED at . The extremely faint optical flux favors the high redshift solution though a low radio 20cm flux (0.9mJy) with a slightly distorted morphology may indicate that the radio emission is from star formation. However, this interpretation would support an even lower redshift than .
F1329+1748 is bright in V, R, and I with a weak (1.3mJy) radio source.
F1355+3607 is undetected with limit at . A distorted, faint (3mJy) radio source is consistent with a low redshift starburst, perhaps highly reddened.
F1430+3557 was undetected in all bands except K so it does not have a photometric redshift until adding the MIPS 24m and 160m Spitzer archive data, the best-fit SED is a starburst at with starburst or quiescent long wavelength SED (not LIRG or ULIRG). The radio source 20cm flux is moderate (9mJy), together with the lack of resolution of the radio source is also consistent with an AGN at high redshift.
F1435-0029 was undetected in B, V, R, and I, but detected in z′ and H. It has a moderate radio source (10mJy), and an apparent significant break between I and z′, so probably at high redshift ().
F1447+1217 is probably at very high redshift (). It is one of the most powerful radio source (49mJy) in the sample, but a good SED fit, suggests little QSO contamination, so we might consider objects at lower radio 20cm flux also safe from contamination.
F1451+0556 is unresolved and has a peculiar color (), which most resembles a young starburst SB2 SED at z=2.71, though not a very good fit. Spectroscopy confirms a redshift of 2.567 with several emission lines. This suggests significant AGN influence on the SED of this galaxy explaining the peculiar color and compactness.
F1458+4319 has a distorted radio source making it difficult to identify an optical counterpart. The brighter two sources have photometric redshifts at z=5.1 and 5.0 with starburst SEDs. The extreme I-R break seems consistent with the SED fit.
F1505+4457 has an SED consistent with an Sa galaxy at low redshift () though spectroscopy data suggests a higher redshift (z=1.02). The optical ID lies between the 2 sources (which are at different fluxes. This seems to suggest a radio jet with the axis almost perpendicular to the plane of the sky with the north lobe pointed away. With a total 20-cm radio of about 17mJy, with double-lobe morphology, it is consistent with this moderate redshift.
F1524+5122 is undetected with limit at . The relatively high radio luminosity (22mJy) suggests an AGN. It is potentially a very high redshift object, possibly the host galaxy could be highly reddened.
F1644+2554 was undetected at R, I, z′, and H also was not detected with SCUBA so is not constrained as it has not been detected in any band.
F2217-0837 has 2 Hyperz solutions, a elliptical and SB2 SED. The low redshift solution seems more likely as it is would otherwise be an extremely bright () galaxy at high redshift. A weak (1mJy), elongated radio source also supports the low redshift solution.
F2217-0138 has two possible optical IDs, a brighter source about 1” to the east of the radio peak with a photometric redshift of (confirmed with spectroscopy), and a fainter source 1” to the west with a photometric redshift . An upper limit from SHARC2 does not help the optical ID nor constrain any of SED fitting. A powerful (26mJy) radio source suggests an AGN.
F2354-0055 was undetected in B, V, R, I, z′ and H filters, and a compact, faint, steep spectrum radio source is probably from an AGN, perhaps at high redshift.
8. Summary
A set of 58 VLA FIRST survey sources that lie within the isoplanatic patch of a bright natural guide star (BNGS) was constructed to search for high redshift radio galaxies able to be used with NIR adaptive optics. These 58 objects were observed in B, V, R, I, z′, J, H, and K bands and their redshifts were estimated using SED fitting and generally confirmed as accurate with spectroscopy.
It was found that the FIRST-BNGS sample objects generally follow the IR Hubble diagram for radio galaxies. El Bouchefry & Cress (2007) did a study with FIRST galaxies in the NOAO Deep-Wide Field Survey Boötes field and found similar results. They had a large spread at low redshift () that we did not observe probably due to our selection preference for high redshift objects. The low redshift sources in our sample would be the brightest; we chose not to complete these in all bands in favor of fainter objects and as a result we would not have photometric redshifts for them. Several objects at high redshift (z1) have best-fit SEDs consistent with young stellar populations (SB1-6). The few long-wavelength observations tend to favor either a quiescent or M82-like star-forming SED (rather than LIRG or ULIRG type SEDs). This may suggest that at least some of these high redshift galaxies may be in an active star-forming phase which is not what is seen in the K-z Hubble diagram which shows something like a passively evolving population from very high redshift (z5). No trend with radio spectral index was found though there were more steep-spectrum sources observed than flat-spectrum.
Many of these objects are at significant redshift, and this sample provides a unique tool to study galaxies at high redshift. Today’s ground-based instrumentation even allows sufficient resolution to measure the fundamental parameters of the host galaxies; imaging provides resolved morphology and color gradients and spectroscopy allows the dynamics of each galaxy to be studied. A recently completed study of the morphologies of 11 FIRST-BNGS galaxies from a subsample observed with the Subaru Telescope suggests that these objects tend to be compact, blue, dynamically-relaxed galaxies (Stalder & Chambers, in prep.). These intriguing objects provide a glimpse of the detailed picture of the first few Gyr of the history of the universe that future projects such as TMT and JWST will provide. They also hold great potential in studying the high redshift universe and deserve further attention.
We thank Michael Connelley, Steve Howell, Elizabeth McGrath, and Barry Rothberg for assisting in some of the imaging and spectroscopy observations for this huge data set. We also acknowledge the telescope support staffs at the University of Hawai‘i 2.2-meter as well as the Infrared Telescope Facility, which is operated by the University of Hawai‘i under Cooperative Agreement no. NCC 5-538 with the National Aeronautics and Space Administration, Science Mission Directorate, Planetary Astronomy Program. This research was partially supported by the Extragalactic and Cosmology division of NSF under grant AST 0098349 and also partially supported by the Pan-STARRS Camera Group. This research has made use of the NASA/IPAC Extragalactic Database (NED), which is operated by the Jet Propulsion Laboratory, California Institute of Technology, under contract to the National Aeronautics and Space Administration. This work is partly based on observations made with the Spitzer Space Telescope, which is operated by the Jet Propulsion Laboratory, California Institute of Technology under a contract with NASA.
Appendix A SED Template Library
For objects with more than 4 bands of photometric data, photometric redshifts were derived using the public SED fitting code, Hyperz (Bolzonella et al., 2000) which requires a set of templates to fit to the photometric data. See section 4 for a detailed descriptions of the overall procedure.
The SED template library used were originally from Kinney et al. (1996), E, S0, Sa, Sb, Sc and SB1 to SB6 (starburst models over a range of reddening) built using IUE and optical data with a range of wavelength from 1200Å to 1.0m. This library was later extended by Mannucci et al. (2001) into the NIR (2.4m) using averaged ground-based NIR spectra of local prototypical galaxies which closely matched the templates from Kinney et al. (1996).
Our high redshift SED fitting procedure requires even shorter wavelength data, and the Spitzer and submillimeter data require longer wavelength data than provided by these libraries. Therefore further UV and mid-IR extensions were accomplished using a procedure similar to that used by Bolzonella et al. (2000) to extend Coleman et al. (1980) templates. An appropriate GISSEL98 (Bruzual & Charlot, 1993) synthetic blue spectrum (constant SFR, and age=0.1Gyr) was chosen for Sa, Sb, Sc and SB1-6 or a red spectrum (with delta-function starburst, age=19Gyr) for E and S0. These models were chosen to match the overall slope of the continuum where it overlaps with the template. These spectra were then grafted onto the Kinney/Mannucci templates by matching the average continuum levels. The matching wavelength ranges were chosen to be relatively smooth (few spectral lines) and flat in (1230 to 1500Å in the UV and 2.30 to 2.36m in the Near-IR). Figures A.1 and A.2 show the full wavelength-range SEDs.
In order to fit SEDs to Spitzer or submillimeter data, a further extension was applied to these templates using 4 additional FIR-submm template SEDs chosen to reflect an assortment of possible prototypical spectra. The templates used were Arp 220 (Bressan et al., 2002) representing a ULIRG SED, M82 (Bressan et al., 2002) representing a starburst SED, and 2 templates in the synthetic library from Dale et al. (2001) representing LIRGs () and quiescent () SEDs. The extension was done almost identically to the UV/IR extensions except using the continuum levels from 1.95 m to 2.05 m to scale the spectra. All 4 templates were applied to each of the SED templates so it is possible to fit the SEDs continuously from 100 Å to 1 mm. Figure A.3 shows the 4 FIR-submm extensions to the SB3 optical-IR template.
![[Uncaptioned image]](/html/0909.1566/assets/x102.png)
![[Uncaptioned image]](/html/0909.1566/assets/x103.png)
![[Uncaptioned image]](/html/0909.1566/assets/x104.png)
FIG. A.3— Example template spectra used in fitting long wavelength data. The templates are ULIRG (solid), LIRG (dotted), starburst (dot-dashed), and quiescent (dashed) long wavelength templates with a Kinney SB3 short wavelength template.
References
- Best et al. (1998) Best, P. N., Longair, M. S., & Roettgering, H. J. A. 1998, MNRAS, 295, 549
- Bolzonella et al. (2000) Bolzonella, M., Miralles, J.-M., & Pelló, R. 2000, A&A, 363, 476
- Bressan et al. (2002) Bressan, A., Silva, L., & Granato, G. L. 2002, A&A, 392, 377
- Brodie & Strader (2006) Brodie, J. P., & Strader, J. 2006, ARA&A, 44, 193
- Bruzual & Charlot (1993) Bruzual, A. G., & Charlot, S. 1993, ApJ, 405, 538
- Bruzual & Charlot (2003) Bruzual, G., & Charlot, S. 2003, MNRAS, 344, 1000
- Calzetti et al. (2000) Calzetti, D., Armus, L., Bohlin, R. C., Kinney, A. L., Koornneef, J., & Storchi-Bergmann, T. 2000, ApJ, 533, 682
- Chambers & Miley (1990) Chambers, K. C., & Miley, G. K. 1990, in ASP Conf. Ser. 10: Evolution of the Universe of Galaxies, ed. R. G. Kron, 373
- Chambers et al. (1988) Chambers, K. C., Miley, G. K., & Joyce, R. R. 1988, ApJ, 329, L75
- Chambers et al. (1987) Chambers, K. C., Miley, G. K., & van Breugel, W. 1987, Nature, 329, 604
- Coleman et al. (1980) Coleman, G. D., Wu, C.-C., & Weedman, D. W. 1980, ApJS, 43, 393
- Cushing et al. (2004) Cushing, M. C., Vacca, W. D., & Rayner, J. T. 2004, PASP, 116, 362
- Dale et al. (2001) Dale, D. A., Helou, G., Contursi, A., Silbermann, N. A., & Kolhatkar, S. 2001, ApJ, 549, 215
- Dickinson et al. (2003) Dickinson, M., Papovich, C., Ferguson, H. C., & Budavári, T. 2003, ApJ, 587, 25
- Dunlop & Peacock (1993) Dunlop, J. S., & Peacock, J. A. 1993, MNRAS, 263, 936
- Eisenhardt & Chokshi (1990) Eisenhardt, P., & Chokshi, A. 1990, ApJ, 351, L9
- El Bouchefry & Cress (2007) El Bouchefry, K., & Cress, C. M. 2007, Astronomische Nachrichten, 328, 577
- Häussler et al. (2007) Häussler, B., et al. 2007, ApJS, 172, 615
- Heckman et al. (1986) Heckman, T. M., Smith, E. P., Baum, S. A., van Breugel, W. J. M., Miley, G. K., Illingworth, G. D., Bothun, G. D., & Balick, B. 1986, ApJ, 311, 526
- Hodapp et al. (1995) Hodapp, K.-W., et al. 1995, in Proc. SPIE Vol. 2475, p. 8-14, Infrared Detectors and Instrumentation for Astronomy, Albert M. Fowler; Ed., ed. A. M. Fowler, 8
- Hook et al. (2003) Hook, I., Allington-Smith, J. R., Beard, S. M., Crampton, D., Davies, R. L., et al. 2003, in Proc. SPIE 4841: Instrument Design and Performance for Optical/Infrared Ground-based Telescopes, eds. Iye, M. and Moorwood, A. F. M., 1645
- Jackson (2005) Jackson, C. 2005, Publications of the Astronomical Society of Australia, 22, 36
- Jarvis et al. (2001) Jarvis, M. J., Rawlings, S., Eales, S., Blundell, K. M., Bunker, A. J., Croft, S., McLure, R. J., & Willott, C. J. 2001, MNRAS, 326, 1585
- Kauffmann et al. (1999) Kauffmann, G., Colberg, J. M., Diaferio, A., & White, S. D. M. 1999, MNRAS, 307, 529
- Kauffmann & Haehnelt (2000) Kauffmann, G., & Haehnelt, M. 2000, MNRAS, 311, 576
- Kinney et al. (1996) Kinney, A. L., Calzetti, D., Bohlin, R. C., McQuade, K., Storchi-Bergmann, T., & Schmitt, H. R. 1996, ApJ, 467, 38
- Kobayashi et al. (2000) Kobayashi, N., et al. 2000, in Proc. SPIE Vol. 4008, p. 1056-1066, Optical and IR Telescope Instrumentation and Detectors, Masanori Iye; Alan F. Moorwood; Eds., ed. M. Iye & A. F. Moorwood, 1056
- Labbé et al. (2003) Labbé, I., et al. 2003, AJ, 125, 1107
- Landolt (1992) Landolt, A. U. 1992, AJ, 104, 340
- Larkin et al. (2006) Larkin, J., et al. 2006, in Presented at the Society of Photo-Optical Instrumentation Engineers (SPIE) Conference, Vol. 6269, Ground-based and Airborne Instrumentation for Astronomy. Edited by McLean, Ian S.; Iye, Masanori. Proceedings of the SPIE, Volume 6269, pp. 62691A (2006).
- Leggett et al. (2006) Leggett, S. K., et al. 2006, MNRAS, 373, 781
- Lilly & Longair (1984) Lilly, S. J., & Longair, M. S. 1984, MNRAS, 211, 833
- Madau (1995) Madau, P. 1995, ApJ, 441, 18
- Makovoz & Khan (2005) Makovoz, D., & Khan, I. 2005, in Astronomical Society of the Pacific Conference Series, Vol. 347, Astronomical Data Analysis Software and Systems XIV, ed. P. Shopbell, M. Britton, & R. Ebert, 81
- Mannucci et al. (2001) Mannucci, F., Basile, F., Poggianti, B. M., Cimatti, A., Daddi, E., Pozzetti, L., & Vanzi, L. 2001, MNRAS, 326, 745
- McCarthy (1993) McCarthy, P. J. 1993, ARA&A, 31, 639
- McCarthy et al. (1987) McCarthy, P. J., van Breugel, W., Spinrad, H., & Djorgovski, S. 1987, ApJ, 321, L29
- McGrath et al. (2008) McGrath, E. J., Stockton, A., Canalizo, G., Iye, M., & Maihara, T. 2008, ApJ, 682, 303
- Miyazaki et al. (2003) Miyazaki, M., et al. 2003, PASJ, 55, 1079
- Monet & et al. (1998) Monet, D., & et al. 1998, VizieR Online Data Catalog, 1252
- Peebles (2002) Peebles, P. J. E. 2002, in ASP Conf. Ser. 283: A New Era in Cosmology, ed. N. Metcalfe & T. Shanks, 351
- Peng et al. (2002) Peng, C. Y., Ho, L. C., Impey, C. D., & Rix, H.-W. 2002, AJ, 124, 266
- Pentericci et al. (2001) Pentericci, L., McCarthy, P. J., Röttgering, H. J. A., Miley, G. K., van Breugel, W. J. M., & Fosbury, R. 2001, ApJS, 135, 63
- Rayner et al. (2003) Rayner, J. T., Toomey, D. W., Onaka, P. M., Denault, A. J., Stahlberger, W. E., Vacca, W. D., Cushing, M. C., & Wang, S. 2003, PASP, 115, 362
- Rigaut et al. (1998) Rigaut, F., et al. 1998, PASP, 110, 152
- Rigler et al. (1992) Rigler, M. A., Stockton, A., Lilly, S. J., Hammer, F., & Le Fevre, O. 1992, ApJ, 385, 61
- Roddier (1999) Roddier, F. 1999, Adaptive optics in astronomy (Adaptive Optics in Astronomy)
- Roddier et al. (1991) Roddier, F., Northcott, M., & Graves, J. E. 1991, PASP, 103, 131
- Simons & Tokunaga (2002) Simons, D. A., & Tokunaga, A. 2002, PASP, 114, 169
- Stalder & Chambers (2009) Stalder, B., & Chambers, K. C. 2009, in prep.
- Thomas & Kauffmann (1999) Thomas, D., & Kauffmann, G. 1999, in ASP Conf. Ser. 192: Spectrophotometric Dating of Stars and Galaxies, ed. I. Hubeny, S. Heap, & R. Cornett, 261
- Thomas et al. (2002) Thomas, D., Maraston, C., & Bender, R. 2002, Ap&SS, 281, 371
- Tokunaga et al. (2002) Tokunaga, A. T., Simons, D. A., & Vacca, W. D. 2002, PASP, 114, 180
- Tonry et al. (2002) Tonry, J. L., Luppino, G. A., Kaiser, N., Burke, B. E., & Jacoby, G. H. 2002, in Proc. SPIE 4836: Survey and Other Telescope Technologies and Discoveries, eds. Tyson, J. A. and Wolff, S., 206
- Vacca et al. (2003) Vacca, W. D., Cushing, M. C., & Rayner, J. T. 2003, PASP, 115, 389
- van Breugel et al. (1998) van Breugel, W. J. M., Stanford, S. A., Spinrad, H., Stern, D., & Graham, J. R. 1998, ApJ, 502, 614
- van Dokkum et al. (2008) van Dokkum, P. G., et al. 2008, ApJ, 677, L5
- White et al. (1997) White, R. L., Becker, R. H., Helfand, D. J., & Gregg, M. D. 1997, ApJ, 475, 479
- Willott et al. (2003) Willott, C. J., Rawlings, S., Jarvis, M. J., & Blundell, K. M. 2003, MNRAS, 339, 173