Galaxies at High Redshift and Reionization
Abstract
The quest to discover the most distant galaxies has developed rapidly in the last decade. We are now exploring redshifts of 6 and beyond, when the Universe was less than a billion years old, an epoch when the previously-neutral intergalactic medium was reionized. The continuing discovery of galaxies at progressively higher and higher redshifts has been driven by the availability of large telescopes on the ground and in space, improvements in detector technology, and new search strategies. Over the past 4 years, the Lyman break technique has been shown to be effective in isolating star-forming -drop galaxies through spectroscopic confirmation with large ground-based telescopes (Keck, Gemini and the ESO VLTs). Narrow-band imaging, notably with the wide field of the Subaru telescope, has also produced samples of Lyman- emitters at these redshifts. Analysis of the Hubble Ultra Deep Field (HUDF – the deepest images obtained so far, and likely to remain so until the James Webb Space Telescope, JWST), has enabled us to explore the faint end of the luminosity function, which may contribute the bulk of the total star formation. The discovery of this -drop galaxy population has been used to infer the global star formation rate density at this epoch (), and we are now begining to constrain the contribution to reionization of the UV flux from these galaxies. Infrared data from the Spitzer Space Telescope has been used to determine the spectral energy distributions (SEDs) from the rest-frame UV to the optical of some -drops, and constrain the previous star formation histories, masses and age of these sources. The indications are that much of the stellar mass of these galaxies might have formed in vigorous bursts at . The next big advances would be to test the population synthesis modelling of these galaxies through spectroscopy of the rest-frame optical (rather than crude broad-band SEDs), and also to push the observational horizon for galaxies further to directly explore star formation during the reionization epoch. JWST is likely to have a profound impact on realising these goals.
1University of Exeter, School of Physics, Stocker Road, Exeter,
EX4 4QL, U.K.
2 Anglo-Australian Observatory, P.O. Box 296, Epping, NSW 1710, Australia
3 Department of Physics, Denys Wilkinson Building, Oxford, OX1 3RH, U.K.
4H. H. Wills Physics Laboratory, Tyndall Ave., Bristol, BS8 1TL, U.K.
5California Institute of Technology, Pasadena, CA 91125, U.S.A.
6Institute of Astronomy, Madingley Road, Cambridge CB3 0HA,
U.K.
E-mail: a.bunker1@physics.ox.ac.uk, E.R.Stanway@bristol.ac.uk, rse@astro.caltech.edu, mlacy@ipac.caltech.edu,
rgm@ast.cam.ac.uk, eyles@astro.ex.ac.uk,dps@ast.cam.ac.uk, chiu@astro.caltech.edu
1. Introduction
There has been enormous progress over the past decade in discovering galaxies and QSOs at increasingly high redshifts. We are now probing far enough back in time that the Universe at these early epochs was fundamentally different from its predominantly ionized state today. Observations of QSOs (Becker et al. 2001, Fan et al. 2002) show near-complete absorption of flux at wavelengths short-ward of Lyman- (Gunn & Peterson 1965), indicating that the Universe is optically thick to this line, and that the neutral fraction of hydrogen is much greater than at lower redshifts. WMAP results from the cosmic microwave background indicate that the Universe was completely neutral at redshifts of (Spergel et al. 2007). There is an ongoing debate as to what reionized the Universe at : is it AGN or ionizing photons (produced in hot, massive, short-lived stars) escaping from star forming galaxies? AGN appear to be very under-abundant at these epochs (e.g., Dijkstra, Haiman & Loeb 2004), so to address the reionization issue it is crucial to know the global star formation rate at high redshifts, along with the escape fraction for these ionizing photons. In this review talk I will outline the work done in identifying star-forming galaxies within the first billion years of the Big Bang through deep imaging in the optical and near-infrared with the Hubble Space Telescope (HST) and spectroscopy with large telescopes from the ground. I will also discuss what can be learned about the stellar masses and formation epochs of these galaxies, and what role they may have played in the reionization of the Universe. The standard “concordance” cosmology is used throughout (, , and use ). All magnitudes are on the system.
2. The Lyman-Break Technique at
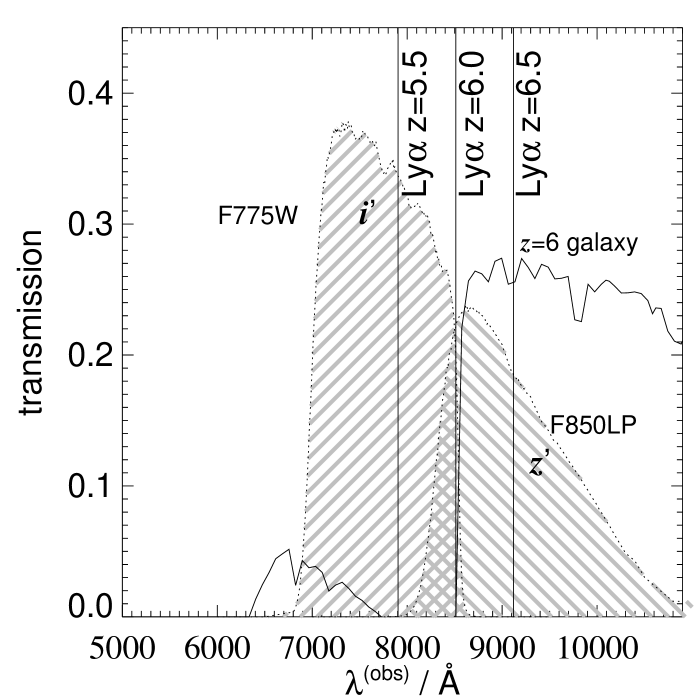
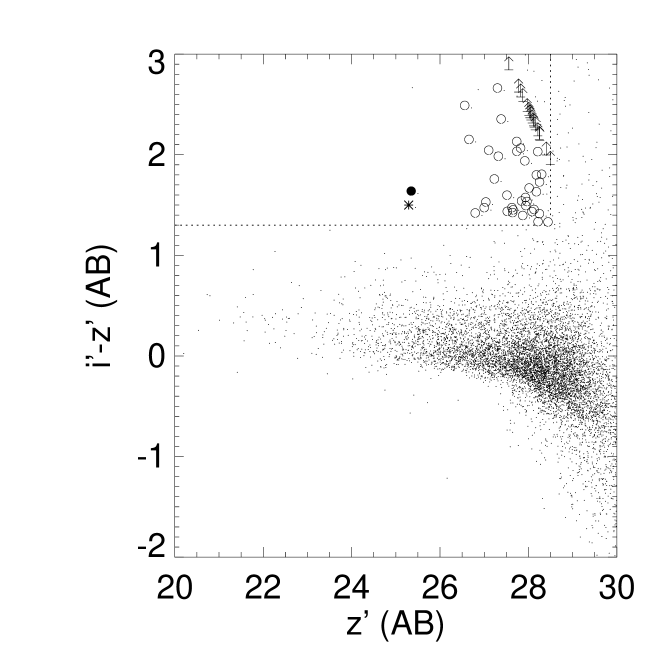
To address the contribution of star-forming galaxies to reionization, we need to reliably identify galaxies at and measure their integrated rest-frame UV flux. Magnitude-limited spectroscopic surveys have shown that the high-redshift tail is small, so simply taking spectra of everything in a deep field is an expensive way of discovering a handful of high-redshift galaxies. Some way of isolating candidate high-redshift galaxies from the foreground population is required to provide targets for follow-up spectroscopic confirmation. One technique is to use narrow-band imaging to identify galaxies where highly-redshifted line emission falls within the passband. After many years of fruitless searches in the 1980s and early 1990s, this method is now yielding great results, although the Lyman- line typically targetted is a poor measure of the star formation rate. In the past decade, deep imaging in several different broad-bands (typically spanning the optical and near-infrared) has also been used to estimate the redshifts of galaxies on the basis of their observed colours – essentially using the few photometric datapoints at different wavelengths as a crude low-dispersion spectrum. In this article I will focus on a particular variant of these “photometric redshifts”, which relies on a strong spectral break arising from absorption by neutral hydrogen in intervening clouds along the line of sight (the Lyman- forest). This “Lyman break technique” was originally pioneered at by Steidel and co-workers (Steidel, Pettini & Hamilton 1995; Steidel et al. 1996) who identified -band drop-outs. At the technique involves the use of three filters: the -band below the Lyman limit ( Å); the - or -band in the Lyman forest region and a third filter, the -band, long-ward of the Lyman- line ( Å). At , we can efficiently use only two filters, above (-band 9000Å) and below (-band 8000Å) the continuum break at the Lyman- line ( Å); since the integrated optical depth of the Lyman- forest at is (see Figure 1), there is essentially no flux at shorter wavelengths, rendering the shortest-wavelength filter below the Lyman limit redundant. The key issue is to work at a sufficiently-high signal-to-noise ratio that Lyman break “drop-out” galaxies can be safely identified through detection in a single redder band (i.e., -band). This approach has been demonstrated to be effective by the SDSS collaboration in the detection of QSOs using the - and -bands alone (Fan et al. 2002), using wide-area but shallow ground-based imaging, which is sensitive to bright but rare quasars. Several deep imaging programmes with the Advanced Camera for Surveys (ACS) on HST use the sharp-sided SDSS F775W () and F850LP () filters, which can be used to locate the“-drop” candidate galaxies (fainter but more numerous than the QSOs). Figures 1 & 2 illustrates how a colour cut of can be effective in selecting sources with . The ACS images of the Chandra Deep Field South from the HST Treasury “Great Observatory Origins Deep Survey” (GOODS; Giavalisco & Dickinson 2003) have been used to discover this -drop population of galaxies (Stanway, Bunker & McMahon 2003; Dickinson et al. 2004; Giavalisco et al. 2004). Stanway, Bunker & McMahon (2003) searched 150 arcmin2 for -drop objects, of which six were probable galaxies brighter than . To address potential cosmic variance issues, a similar analysis in the GOODS-North field, which yielded a consistent estimate of the surface density of star forming sources (Stanway et al. 2004a). Since these initial results, larger numbers of -drops have been uncovered in additional HST/ACS pointings (e.g., Bouwens et al. 2006) and from the ground (e.g., the Subaru Suprime-Cam – Iwata et al. 2007) as well as deeper imaging of the GOODS fields, particularly the Hubble Ultra Deep Field (Bunker et al. 2004) within GOODS-South.

3. Spectroscopic Confirmation of Galaxies
The effectiveness of the Lyman-break technique has been demonstrated at lower redshifts through spectroscopic confirmation of hunderds of -band dropouts at and -band drop-outs at (Steidel et al. 1999). However, it is important to demonstrate that the -drop selection is similarly isolating galaxies at , if we are to use the surface density of -drops to draw global inferences about galaxies within the first billion years. A known possible contaminant is the Extremely Red Object (ERO) population of evolved galaxies at which can produce large colours: deep near-infrared imaging should identify EROs, and this possible contamination is considered in Stanway, McMahon & Bunker (2005) from the HST/NICMOS survey of the HUDF. Low-mass Galactic stars (M/L/T dwarfs) are another interloper population. Deep spectroscopy with Keck/DEIMOS of the brightest -drop identified by Stanway, Bunker & McMahon (2003) in GOODS-South revealed the brightest one, galaxy SBM03#3 ( mag), to be at (Bunker et al. 2003; Dickinson et al. 2004) and another -drop (SBM03#1, ) was found to lie at a similar redshift of (Stanway et al. 2004ab; Dickinson et al. 2004). The -drop spectra typically show a single emission line, with no significant continuum detected at moderate spectral resolution (); spectrally-resolved profiles of the emission lines are asymmetric (as high- Lyman- tends to be) with a P-Cygni-like profile and a sharp cut-off on the blue wing (Figure 2b). The line fluxes of these brighter -drops are . The equivalent widths are Å using the -band photometry from HST/ACS, which is within the range seen in high- star-forming galaxies at . The velocity widths of the Lyman- are comparatively narrow () and we do not detect the high-ionization line N V 1240 Å, which strongly support the view that this line emission is powered by star formation rather than an AGN. Subsequent spectroscopic programmes, including using FORS 2 on the ESO VLT (Vanzella et al. 2006) and GMOS “nod & shuffle” spectroscopy on Gemini (GLARE, Stanway et al. 2004b, 2007) have confirmed many more galaxies in GOODS-South. Slitless spectroscopy of the HUDF with HST/ACS (GRAPES, Malhotra et al. 2005) has also confirmed the spectral breaks of the -drop galaxies, although the spectral resolution of is usually insufficient to see the Lyman- emission lines in all but the most extreme equivalent widths.
Although such spectroscopy has proven that the -drop selection technique does select star-forming galaxies at , the efforts to date have been limited despite pushing the limits of 10-m class telescopes from the ground. Only a fraction of the -drops imaged with HST (see the compilation of Bouwens et al. 2006) have spectroscopic redshifts. It seems likely that Lyman- line emission does not emerge from some galaxies, through resonant scattering and absorption by dust (a well-known result at lower redshifts, e.g., Steidel et al. 1999), although the fraction of galaxies at with large Lyman- equivalent widths seems greater than at (Stanway et al. 2007), possibly implying low-metallicity, a top-heavy initial mass function, or extremely young ages for the starbursts.
With its multi-object spectroscopic capability using micro-shutter technology, NIRSpec on JWST (Gardner et al. 2006) will have the capability to determine redshifts for most of the -drop candidates identified, even to the depth of the HUDF. Beyond simply extending ground-based Lyman- spectroscopy at to fainter galaxies, NIRSpec will have the sensitivity to detect the rest-frame UV and optical continuum. Studies of interstellar medium (ISM) and stellar photospheric lines of -drop galaxies at in the rest-UV have provided clues to the initial mass function, metallicity and outflow velocities in these galaxies (e.g., Shapley et al. 2003). Only in the case of the brightest -drop have such ISM metal absorption lines been seen (Dow-Hygelund et al. 2005), but NIRSpec will enable the whole population to be studied with its intermediate-resolution and high-resolution modes ( and ). Perhaps most importantly, NIRSpec will not be restricted to the rest-UV at , which is the case with ground-based optical/near-IR spectroscopy. NIRSpec has a coverage from m, unhampered by the OH sky lines and large thermal background seen from ground-based observatories. Hence, for the population, we can target the full range of emission lines from Lyman- 1216 Å to H 6563 Å. Emission line diagnostics can then be used to estimate the metallicities and the extinction due to dust.


Right: An updated version of the ‘Madau-Lilly’ diagram (Madau et al. 1996; Lilly et al. 1996) illustrating the evolution of the comoving volume-averaged star formation rate. Our work from the HUDF data is plotted a solid symbol. Other determinations have been recalculated for our cosmology and limiting UV luminosity of at . See Bunker et al. (2004) for definition of the other symbols.
4. The star formation rate density at
Estimates of the star formation rate density at the highest redshifts have relied on the intensity of the rest-frame UV continuum emission, redshifted into the -band at ; this is dominated by the light from the most massive stars ( which are the hottest and bluest stars), which are the shortest lived, and hence a tracer of the instantaneous star formation rate. To go from the number of massive stars formed to the total star formation rate requires an assumption about the stellar initial mass function (IMF). In the absence of dust obscuration, the relation between the flux density in the rest-UV around Å and the star formation rate ( in ) is given by from Madau, Pozzetti & Dickinson (1998) for a Salpeter (1955) IMF with . The relatively bright magnitude cut of for the original -drop selection from the GOODSv0.5 data (Stanway, Bunker & McMahon 2003; Stanway et al. 2004a) corresponds to an unobscured star formation rate of at (the luminosity-weighted average redshift), equivalent to for the -band dropout population at .
A tantalizing result from our work so far is that at there are far fewer UV-luminous star forming galaxies than would have been predicted if there was no evolution, based on a comparison to the well-studied Lyman break population (Steidel et al. 1999). In fact, the volume averaged (comoving) star formation rate in galaxies with is less at than at . So it would appear that at this crucial epoch, where abundant sources of UV photons are needed to reionize the Universe, there is in fact a deficit of luminous star forming galaxies. The bright end of luminosity function has evolved greatly from to . Other groups have claimed less dramatic evolution or even no evolution in the total volume-averaged star formation rate, based on the same fields (Giavalisco et al. 2004; Dickinson et al. 2004) and similar HST/ACS data sets (Bouwens et al. 2003; Yan, Windhorst & Cohen 2003), but these groups work closer to the detection limit of the images and introduce large completeness corrections for the faint source counts. To do a complete inventory of the UV light from star formation we must address the contribution of low-luminosity star-forming galaxies to the ionizing flux. The public availability of the Hubble Ultra Deep Field (HUDF; Beckwith, Somerville & Stiavelli) can address this puzzle by pushing down the luminosity function at to well below the equivalent of for the population.
5. The Hubble Ultra Deep Field
The Hubble Ultra Deep Field (HUDF) was a Cycle 12 STScI Director’s Discretionary Time programme executed over September 2003 – January 2004, comprising 400 orbits in 4 broad-band filters (including F775W -band for 144 orbits; F850LP -band for 144 orbits). As the HUDF represents the deepest set of images yet taken, significantly deeper than the -band exposures of the Hubble Deep Fields (Williams et al. 1996), and adds the longer-wavelength -band, it is uniquely suited to the goals of our program.
We performed the first analysis of -drops in the UDF (Bunker et al. 2004), presenting details of 54 candidate star forming galaxies at in a preprint the day after the release of the UDF data. Our analysis was subsequently independently repeated by Yan & Windhorst (2004), with agreement at the 98% level (see Bunker & Stanway 2004 for a comparison). We take our magnitude limit as (a cut).We measure a star formation density of at from galaxies in the UDF with SFRs (equivalent to at ). This confirmed the previous discovery of a relatively low co-moving star formation rate density at compared to the more recent past at (Figure 3).
At the relatively bright cut of used in Stanway, Bunker & McMahon (2003) from the GOODSv0.5 survey, the UDF data is 98% complete for sources as extended as arcsec. Interestingly, we detect no extended (low surface brightness) -drops to this magnitude limit in addition to the targetted -drop SBM03#1 in the deeper UDF data. This supports our assertion that the -drop population is predominantly compact and there cannot be a large completeness correction arising from extended objects (c.f. Lanzetta et al. 2002). The ACS imaging is of course picking out HII star forming regions, and these UV-bright knots of star formation are typically kpc ( arcsec at ) even within large galaxies at low redshift.
It is interesting that the level of stellar contamination in the UDF -drops is only 2%, compared with about one in three at the bright end (; Stanway, Bunker & McMahon 2003; Stanway et al. 2004). This may be because we are seeing through the Galactic disk at these faint limiting magnitudes to a regime where there are no stars (see also Pirzkal et al. 2005).
6. Implications for Reionization
We compare our -drop luminosity function with the work of Madau, Haardt & Rees (1999) for the density of star formation required for reionization. We have updated their equation 27 for the more recent concordance cosmology estimate of the baryon density of Spergel et al. (2007), and for the predicted mean redshift of our sample ():
| (1) |
This relation is based on the same Salpeter Initial Mass Function as we have used in deriving our volume-averaged star formation rate. is the concentration factor of neutral hydrogen, . Simulations suggest (Gnedin & Ostriker 1997). Even if we take (no absorption by H I) this estimate of the star formation density required is a factor of higher than our measured star formation density of at from galaxies in the UDF with SFRs . For faint end slopes of galaxies with account for % of the total luminosity, so would fall short of the required density of Lyman continuum photons required to reionize the Universe. If the faint-end slope is as steep as then there would just be enough UV Lyman continuum photons generated in star forming galaxies at (assuming a Salpeter IMF), but the required escape fraction for complete reionization would still have to be implausibly high (, whereas all high- measurements to date indicate : Fernánadez-Soto, Lanzetta & Chen 2003; Steidel, Adelberger & Pettini 2001). If star forming galaxies at redshifts close to were responsible for the bulk of reionization, then a very different initial mass function would be required, or the calculations of the clumping factor of neutral gas would have to be significantly over-estimated (see also Stiavelli, Fall & Panagia 2004). Alternatively another low-luminosity population (e.g., forming globular clusters; Ricotti 2002) could be invoked to provide some of the shortfall in ionizing photons. It is also plausible that the bulk of reionization occurred at redshifts well beyond : the WMAP polarization data indicate (Spergel et al. 2007), and it is possible that the Gunn-Peterson troughs seen in QSOs (Becker et al. 2001; Fan et al. 2002) mark the very last period of a neutral IGM. If some of these -drop galaxies can be shown to harbour stellar populations with ages of a few hundred Myr, then this pushes their formation epoch to . Measurements of the stellar masses of individual galaxies can also constrain structure formation paradigms; in a simple hierarchical model, massive galaxies assemble at later times through merging, so it might be expected that in this scenario the number density of massive evolved galaxies in the first Gyr would be low.
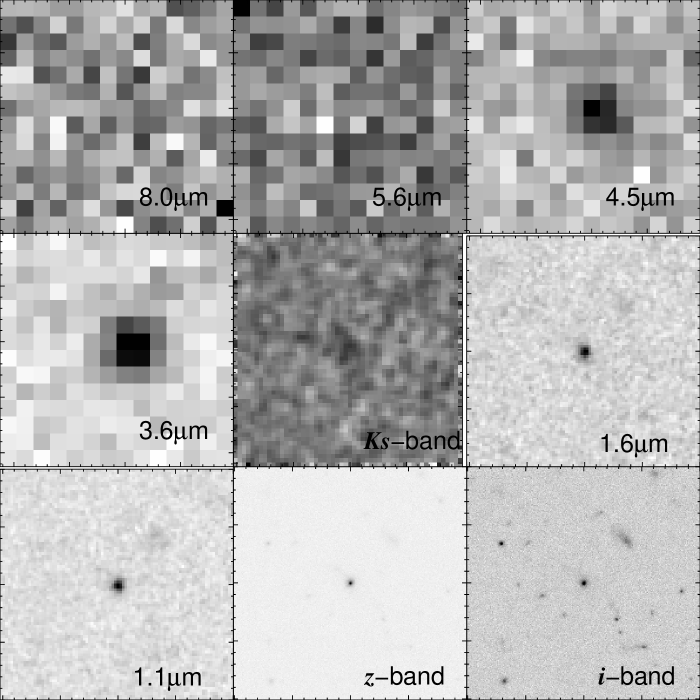
Obtaining such observational evidence of old stars at high redshift is challenging: the initial work on galaxies was based on optical and near-infrared imaging and explored the rest-frame ultraviolet (UV) in these galaxies, which is completely dominated by recent or ongoing star formation. The addition of imaging at wavelengths m with the IRAC camera on the Spitzer Space Telescope extends the coverage to the rest-frame optical at , beyond the age-sensitive Balmer/4000 Å break and where the light is dominated by stars that form the bulk of the stellar mass. With the addition of this Spitzer/IRAC imaging, spectral energy distributions from the multi-wavelength broad-band photometry can be fit to stellar population synthesis models to constrain the stellar masses and ages, and hence the preceding star formation history and the formation epochs can be explored.
In Eyles et al. (2005) we identified two -drops with spectroscopic redshifts of which exhibited significant Balmer/4000 Å spectral breaks (Figure 4) , implying stellar ages of Myr, and formation redshifts of . Large stellar masses in the range were inferred. We then studied the whole Lyman-break population in the GOODS-South field with IRAC/Spitzer at (the -drops, Eyles et al. 2007) and (the -drops, Stark et al. 2007). Half of these are confused with foreground sources at Spitzer resolution, but from those with clean photometry we find that a surprisingly large fraction (40%) have evidence for substantial Balmer/4000 Å spectral breaks. This indicates the presence of old underlying stellar populations that dominate the stellar masses. Analysis of those -drops that are undetected by IRAC at 3.6 m indicates that a subset of the population are younger, considerably less massive systems. We calculate that emission line contamination should not severely affect our photometry or derived results. Using SED fits out to m, we find little evidence for substantial intrinsic dust reddening in our sources.
Using the constrained properties of our -drop sample, we were able to calculate a value for the stellar mass density of (Figure 5), correcting for those objects eliminated from our analysis due to their untreatable IRAC-confusion and those lacking GOODS-MUSIC photometric redshifts. Using a somewhat uncertain correction in order to account for the stellar mass in objects below our -band magnitude selection limit, this value could perhaps be . Any post-starburst and dust-obscured sources would not be found using the -drop selection technique, and hence our stellar mass density value is necessarily a lower limit, and is consistent with the estimates of Yan et al. (2006). Exploring the previous star formation histories of our -drops, as inferred from their SED fitting, we suggest that the global star formation of these sources may have been substantially higher prior to the epoch of observation (Figure 5), and the resultant UV flux at may have played an important role in reionizing the Universe.


References
- (1) Becker R. H. et al., 2001, AJ, 122, 2850
- (2) Beckwith S., Somerville R., Stiavelli M., 2003, STScI Newsletter vol 20 issue 04
- (3) Bouwens R., et al., 2003, ApJ, 595, 589
- (4) Bouwens R., et al., 2004, ApJ, 606, L25
- (5) Bouwens R. J., Illingworth G. D., Blakeslee J. P., Franx M., 2006, ApJ, 653, 53
- (6) Bunker A., Stanway E., Ellis R., McMahon R., McCarthy P., 2003, MNRAS, 342, L47
- (7) Bunker A., Stanway E., Ellis R., McMahon R., 2004, MNRAS, 355, 374
- (8) Bunker A. J., Stanway E. R., 2004, astro-ph/0407562
- (9) Coleman G. D., Wu C.-C., Weedman D. W., 1980, ApJS, 43, 393
- (10) Dickinson M., et al., 2004, ApJ, 600, L99
- (11) Dijkestra M., Haiman Z., Loeb A., 2004, ApJ, 613, 646
- (12) Dow-Hygelund C.,et al., 2005, ApJ, 630, L137
- (13) Eyles L., Bunker A., Stanway E., Lacy M., Ellis R., Doherty M., 2005, MNRAS, 364, 443
- (14) Eyles L., Bunker A., Ellis R., Lacy M., Stanway E., Stark D., Chiu K., 2007, MNRAS, 374, 910
- (15) Fan X., et al., 2002, AJ, 123, 1247
- (16) Fernández-Soto A., Lanzetta K. M., Chen H.-W., 2003, MNRAS, 342, 1215
- (17) Gardner J., et al., 2006, SPIE, 6265, 17
- (18) Giavalisco M., Dickinson M., 2003, in “The Mass of Galaxies at Low and High Redshift” Proceedings of the ESO Workshop, p324
- (19) Giavalisco M., et al., 2004, ApJ, 600, L103
- (20) Gnedin N. Y., Ostriker J. P., 1997, ApJ, 486, 581
- (21) Gunn J. E., Peterson B. A., 1965, ApJ, 142, 1633
- (22) Iwata I., et al., 2007,MNRAS, 376, 1557
- (23) Lanzetta K. M., Yahata N., Pascarelle S., Chen H.-W., Fernández-Soto A., 2002, ApJ, 570, 492
- (24) Lilly S. J., Tresse L., Hammer F., Crampton D., Le Fèvre O., 1995, ApJ, 455, 108
- (25) Madau P., Ferguson H., Dickinson M., Giavalisco M., Steidel C., Fruchter A., 1996, MNRAS, 283, 1388
- (26) Madau P., Pozzetti L., Dickinson M., 1998, ApJ, 498, 106
- (27) Madau P., Haardt F., Rees M., 1999, ApJ, 514, 648
- (28) Malhotra S., et al., 2005, ApJ, 626, 666
- (29) Pirzkal N., et al., 2005, ApK, 622, 319
- (30) Ricotti M., 2002, MNRAS, 336, L33
- (31) Salpeter E. E., 1955, ApJ, 121, 161
- (32) Shapley A., Steidel C., Pettini M., Adelberger, K., ApJ, 588, 65
- (33) Spergel, D. N., et al., 2007, ApJS, 170, 377
- (34) Stanway E. R., Bunker A. J., McMahon R. G., 2003, MNRAS, 342, 439
- (35) Stanway E., Bunker A., McMahon R., Ellis R., Treu T., McCarthy P., 2004a, ApJ, 607, 704
- (36) Stanway E. R., et al., 2004b, ApJ, 604, L13
- (37) Stanway, E. R., 2004, PhD Thesis (University of Cambridge)
- (38) Stanway E. R., McMahon R. G., Bunker A. J., 2005, MNRAS, 359, 1184
- (39) Stanway E. R., et al., 2007, MNRAS, 376, 727
- (40) Stark D., Bunker A., Ellis R., Eyles L., Lacy M., 2007, ApJ, 659, 84
- (41) Stiavelli M., Fall S. M., Panagia N., 2004, ApJ, 610, L1
- (42) Steidel C. C., Pettini M., Hamilton D., 1995, AJ, 110, 2519
- (43) Steidel C., Giavalisco M., Pettini M., Dickinson M., Adelberger K., 1996, ApJ, 462, L17
- (44) Steidel C., Adelberger K., Giavalisco M., Dickinson M., Pettini M., 1999, ApJ, 519, 1
- (45) Steidel C. C., Pettini M., Adelberger K. L., 2001, ApJ, 546, 665
- (46) Vanzellla E., et al., 2006, A&A, 454, 423
- (47) Williams R. E., et al., 1996, AJ, 112, 1335
- (48) Yan H., Windhorst R. A., Cohen S., 2003, ApJ, 585, L93
- (49) Yan H., Windhorst R. A., 2004, ApJ, 600, L1
- (50) Yan H., Dickinson M., Giavalisco M., Stern D., Eisenhardt P., Ferguson H., 2006, ApJ, 651, 24