World stock market: more sizeable trend reversal likely in February/March 2010
Abstract
Based on our ”finance-prediction-oriented” methodology which involves such elements as log-periodic self-similarity, the universal preferred scaling factor , and allows a phenomenon of the ”super-bubble” we analyze the 2009 world stock market (here represented by the SP500, Hang Seng and WIG) development. We identify elements that indicate the third decade of September 2009 as a time limit for the present bull market phase which is thus to be followed by a significant correction. In this context we also interpret the Chinese stock market index SSE.
The third decade of September 2009 was accompanied with a stock market correction typically within the range of worldwide. Taking into account the market patterns that followed the time of delivering the previous scenario we present an updated scenario whose critical time corresponds to October 28, 2009.
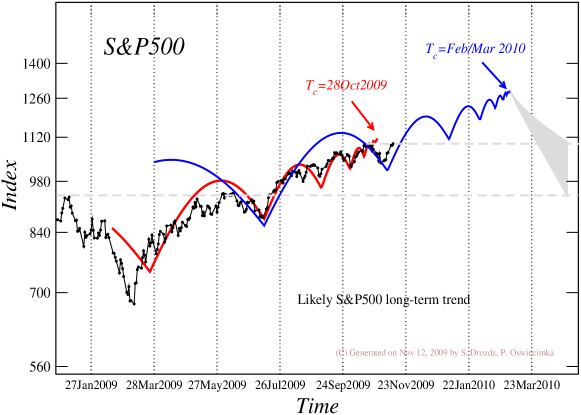
Assuming quite evident (as of November 12, 2009) termination of the correction due to the above critical time we extend - consistently with our methodology - the stock market forecasting scenario. The corresponding expected SP500 future trend is shown in Fig. 5 and it supports a potential average continuation of increases to as far into the future as the turn of February/March 2010. We also indicate the log-periodic patterns on the gold market and they point to the end of November 2009 as the time when the trend reversal - likely local however - is expected to begin.
Since the time - turn of February/March 2009 - of reaching the deepest minima since 2003, the leading world stock market indices started systematically elevating and, until present, they on average increased within the range of . Many other world markets did follow this trend. In some cases this increase was even stronger. Such a strong increase in a relatively short period of time sooner or later has to terminate with a correction that can be sizeable. A question that we address in this note is whether this recent increase does reveal any precursors that encode the date of this termination. In the financial markets such precursors are typically associated with the presence of specific oscillations that get accelerated in time according to a constant contraction factor also referred to as a preferred scaling factor. Based on many systematic analyzes and our personal experience this factor corresponds to if the rate of oscillatory contractions points to a real reversal of the trend as postulated already in [1, 2] and further documented in [3]. As before [2, 4], for transparency we use the simplest representation of the corresponding log-periodic structure in the form
| (1) |
where . The stock market index representation is then drawn according to the equation:
| (2) |
where denotes a distance to the critical time and is the clock time.
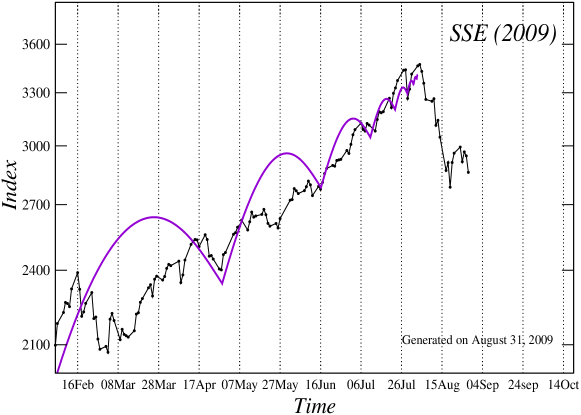
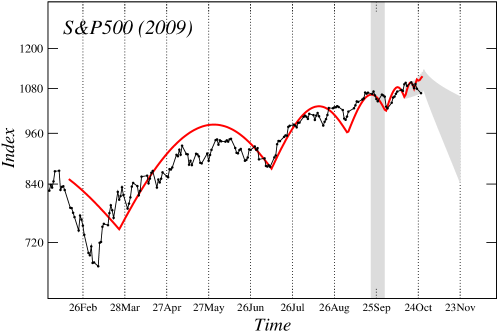
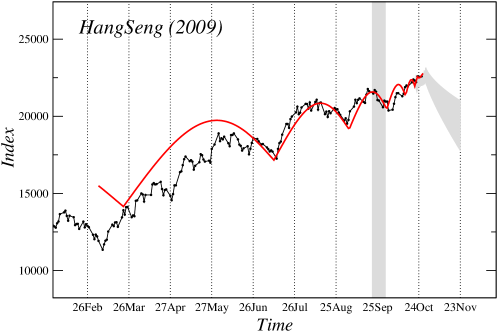
Three such current examples relating stock market indices SP500, Hang Seng and WIG (Warsaw)- thus elected from entirely different world zones - starting in February 1, 2009 and their optimal log-periodic representations fulfilling our criteria of consistency are shown in Figs. 1a, 1b and 1c respectively. These three graphs were prepared on August 25, 2009 and then disclosed on http://picasaweb.google.com/finpredict. They all three point to the beginning of the third decade in September 2009 as a date setting barrier for the present phase of increase.
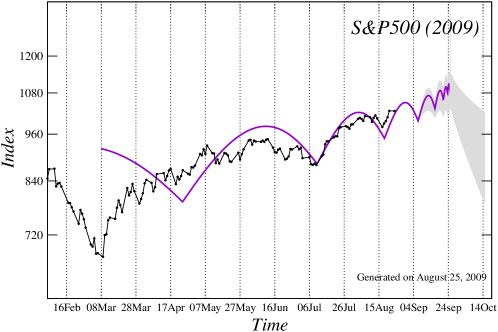
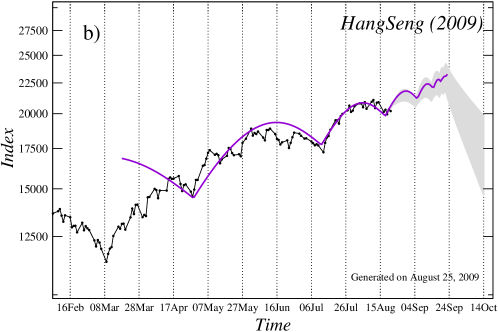
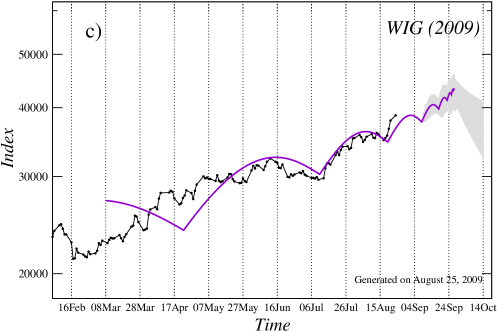
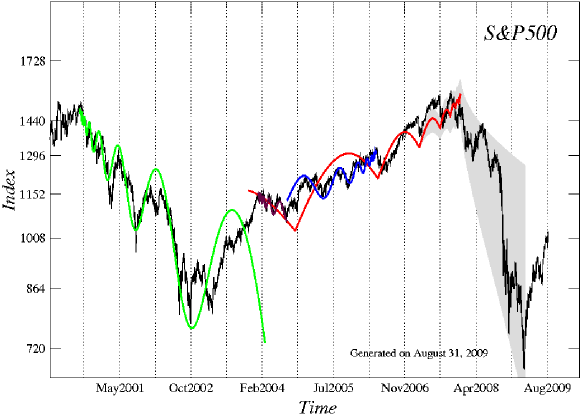
Notice needs to be given here to the fact that we do not begin tracking oscillatory patterns with the deepest minimum at the turn of February/March 2009 but instead with a seemingly much less convincing minimum in the second half of April 2009. One reason is consistency which demands . We also hypothesize that this previous deepest minimum (here of February/March) is still associated with the preceding market declining phase and does not yet involve components characterizing the phase of increase. That such a postulate is justified can be seen from several historical stock market evolution examples. One such example, particularly relevant in the present context, is shown in Fig. 2. This is the SP500 development over the time period 2000 - present versus the corresponding log-periodic representations both decelerating and accelerating, depending on the market phase. The up trend whose reversal took place in the end of 2007 turns out to establish itself log periodically only in the second half of 2004 and not already at the deepest levels in 2003. One should also notice that this last, by now historical, example refers to a significantly larger time scale than currently considered which provides further argument in favor of the concept of log-periodic self-similarity [1, 2].
The above considered stock markets, similarly as many others in the world, do correlate in phase since many years therefore their oscillation patterns largely resemble each other and thus the trend reversal is expected to occur at around the same time. There is however one significant exception. This is the Chinese stock market represented by the Shanghai SSE Composite Index. After drawing down since October 2007, it started resuming the up trend some two month earlier than the other world markets. As it can be seen from today’s perspective the end of this increasing phase occurred on August 4, 2009 and this, as is shown in Fig. 3, can be reproduced by the log-periodic function with the same contraction factor but again by not taking into account the initial absolute minimum. The other intermediate oscillations are to be qualified as substructures corresponding to the shorter time scales. Blindly taken relative magnitude of the amplitude of oscillations operating on the different time scales may not always directly reflect to what time scale a given pattern is to be assigned. Some distortion, either artificial amplification or reduction, may originate from some exogenous factors or, which is especially likely in the present case, from some influence of the other world markets on the Chinese market. This influence may of course be mutual. It, in particular, may start pulling down the other markets somewhat earlier [5] than the above predicted date specified as third decade in September 2009.
(Note added on October 26, 2009)
In the third decade of September the world stock markets underwent a correction within the range indeed but with some exceptions (like Nikkei or Canadian SP TSX Composit)it generally resumed the up trend and in October in most cases it even topped the September maxima by 2-3. The question that we address here is whether the additional market patterns developed since the end of August 2009 allow to update (as compared to Fig. 1) a consistent log-periodic scenario within the same methodology as described above. The answer is presented in Fig. 4 for the same three stock market indices as before. Quality of the resulting theoretical log-periodic market representation is equally acceptable indeed and the critical time corresponds to around October 28, 2009.
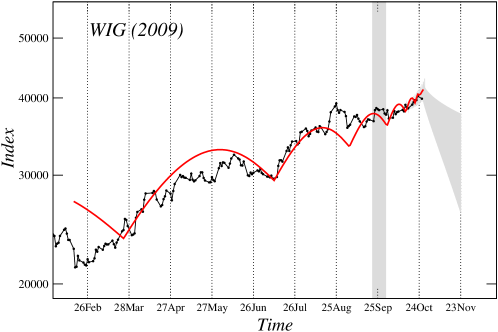
A fundamental question that stays behind the markets dynamics is this: suppose a law that governs it is identified and suppose more and more market participants learn about it and start believing the resulting predictions and thus act accordingly. If sufficiently many participants (in an extreme case all) belong to this group the law starts dissolving and eventually it disappears. Perhaps its new variant starts emerging such that it remains unperceived similarly as the previous one when it was not yet commonly recognized. Empirical possibilities to verify such effects by conducting realistic experiments on the real stock market are of course very limited. Occasionally, under appropriate conditions, the smaller local markets might offer a testing ground. To some extent we in Poland seem to have experienced a trace of action in this direction. Soon after we made or prediction public (this in fact was one of our motivations), accidentally or perhaps not entirely accidentally, there was a growing expectation in a correction that is to come. As one visible result, likely due to this fact, the Polish stock market index WIG has been evolving sideways over the entire period of September with an extremely strong tendency to the sudden sharp drawdowns in response to even small moves down on the large world markets where the global September trend was up. During the whole month of September it did even not reach the top value of August. Only after the third decade of September was over the situation reversed and the Polish market become even more vital in its tendency to move up. In any case the issue raised here remains an intriguing subject for future studies, also in connection with the concept of financial log-periodicity.
(Note added on November 16, 2009)
The critical time indicated before (turn of October/November) did result in a correction of the order of (US, Asia) up to (Europe), indeed. That however was not yet a longer term trend reversal. The previous as large correction as this most recent one took place at the turn of June/July 2009. Based on these facts and on the methodology described above, a natural log-periodically extended scenario is shown in Fig. 5 (available on [6] since November 12, 2009) for the SP500 (most leading world markets are likely to follow the same pattern if applies). This scenario thus indicates that the stock market carries potential to move up until around the turn of February/March 2010.
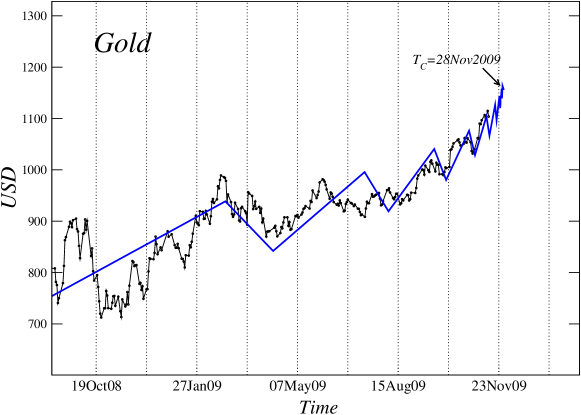
Concerning other markets viewed from similar perspective quite an interesting development can be traced on the precious metals market and especially on the gold market. The relevant illustration is presented in Fig. 6 for the past one year starting in October 2008. The related critical time corresponds to the period just before the end of November 2009 which is to be followed by a significant correction. This however does not yet have to be an ultimate gold price trend reversal. The structure under consideration is likely to constitute a subcomponent of the longer-term up trend whose estimated termination would correspond to the end 2010.
References
- [1] S. Drożdż, F. Ruf, J. Speth, M. Wójcik, Eur. Phys. J. B 10, 589 (1999)
- [2] S. Drożdż, F. Grümmer, F. Ruf, J. Speth Physica A 324, 174 (2003
- [3] M. Bartolozzi, S. Drożdż, D. B. Leinweber, J. Speth, A. W. Thomas, Int. J. Mod. Phys. C 16, 1347 (2005
- [4] S. Drożdż, J. Kwapień, P. Oświȩcimka, Acta Phys. Polonica A 114, 699 (2008); available also as arXiv:0808.3360
- [5] D. Sornette, Why Stock Markets Crash: Critical Events in Complex Financial Systems, (Princeton University Press, Princeton, 2003)
- [6] http://picasaweb.google.com/finpredict