Control via electron count of the competition between magnetism and superconductivity in cobalt and nickel doped NaFeAs
Abstract
Using a combination of neutron, muon and synchrotron techniques we show how the magnetic state in NaFeAs can be tuned into superconductivity by replacing Fe by either Co or Ni. Electron count is the dominant factor, since Ni-doping has double the effect of Co-doping for the same doping level. We follow the structural, magnetic and superconducting properties as a function of doping to show how the superconducting state evolves, concluding that the addition of 0.1 electrons per Fe atom is sufficient to traverse the superconducting domain, and that magnetic order coexists with superconductivity at doping levels less than 0.025 electrons per Fe atom.
pacs:
74.25.Ha, 74.62.-c, 74.90.+n, 76.75.+iSince the discovery of high-temperature superconductivity in fluoride-doped LaFeAsO kamihara , several series of compounds containing fluorite-type or anti-PbO type iron pnictide or chalcogenide layers with a range of intervening layers have been shown to exhibit unconventional superconductivity review_hosono . The superconducting pnictides range from compounds in which the iron pnictide layers are separated by electropositive metal cations to those in which a much thicker perovskite-type oxide slab separates the iron pnictide layers and the electronic dimensionality of the system is correspondingly much lower ogino . As for the layered cuprate superconductors, the superconducting regime is adjacent to antiferromagnetic order. The boundary between these regions may be traversed by changing the electron count, by applying an external hydrostatic pressure or by making an isoelectronic chemical substitution which changes the structural parameters, essentially applying a “chemical pressure”.
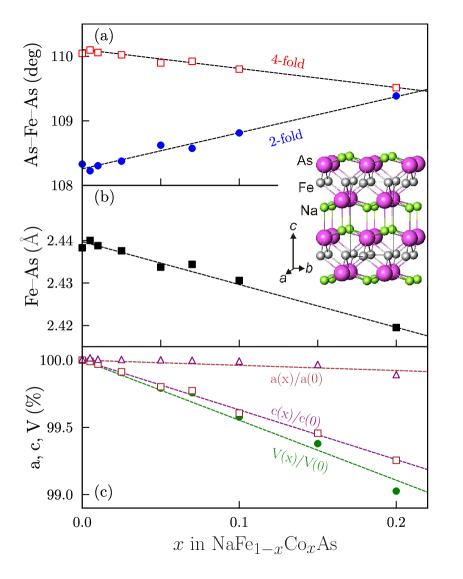
The chemically simplest superconductors containing iron arsenide layers have formula FeAs where =Li, Na and adopt the anti-PbFCl structure type [see the inset to Fig. 1(b)]. LiFeAs was shown to be a bulk superconductor in its undoped, stoichiometric form pitcher ; tapp . Stoichiometric NaFeAs parker also showed evidence for superconductivity: a sample which appeared to consist of a single crystallographic phase with very close to full occupancy of the Na site, and which had a 10% superconducting volume fraction evident from DC magnetometry, also exhibited long-range antiferromagnetic ordering in most of its volume as demonstrated by muon-spin rotation (SR) measurements parker . These results imply that there is some overlap between the antiferromagnetically ordered and superconducting regions of the phase diagram. In this Letter we present high-resolution powder diffraction, SR, and magnetometry measurements on NaFe1-xMxAs (M = Co, Ni) that show the extremely high sensitivity of the competition between magnetic ordering and superconductivity in NaFeAs derivatives to the electron count.
The compounds prepared were NaFe1-xCoxAs (, 0.005, 0.01, 0.025, 0.05, 0.07, 0.1, 0.15, 0.2) and NaFe1-xNixAs (, 0.05, 0.1, 0.2). All are extremely air sensitive and all manipulations of solids were performed in an argon-filled glove box. The products were prepared from stoichiometric quantities of elemental reagents: freshly cut sodium pieces were placed in a 9 mm diameter Nb tube and a well-ground mixture of the transition metal and arsenic powders were placed on top. The tube was sealed under 1 atm of argon in an arc-welding furnace and heated at 200∘C in a resistance furnace for 48 hours. The black initial product was extracted from the tube, homogenized in an agate mortar and pressed into a pellet which was heated in a second sealed Nb tube at 750∘C for 48 hours. The tube was cooled to room temperature in a few hours at the natural rate of the furnace. The final products were highly crystalline lustrous black powders and appeared phase pure according to the results of laboratory X-ray powder diffraction measurements.
Structural investigations were carried out using the high-resolution X-ray diffractometer ID31 at the ESRF, Grenoble, France and the high-resolution neutron powder diffractometer HRPD at the ISIS facility, UK. On ID31 the samples were contained in 0.7 mm diameter glass capillary tubes sealed closed under helium exchange gas. Samples for neutron diffraction were contained in vanadium cylinders sealed with indium gaskets. Rietveld refinement was performed using the GSAS suite vondreele . The diffraction data did not indicate more than 1–2% Na deficiency, consistent with earlier reports parker ; dai . The evolution of the lattice parameters and key structural parameters with composition at room temperature are summarized in Fig. 1. The Fe(Co)As4 tetrahedra become more regular as Fe is substituted by Co [Fig. 1(a)] and the Fe(Co)–As bond distances decrease almost monotonically [Fig. 1(b)] as the smaller Co atom is substituted. The almost monotonic contraction in cell volume (by % between and ) is dominated by the contraction of the lattice parameter (% over this range of compositions, compared to % for the basal lattice parameter, [Fig. 1(c)]). A similar effect is found for Ni doping.

Magnetometry measurements were carried out on a Quantum Design MPMS-XL SQUID magnetometer under zero-field cooled and field cooled conditions in a measuring field of 5 mT. The evolution of the low temperature magnetic susceptibility with composition is shown in Fig. 2. The reported behavior of NaFeAs parker ; chen ; chu is reproducible with several samples showing very small superconducting fractions (5–10%) and broad superconducting transitions with of around 10 K as judged from the onset of diamagnetism. Small levels of electron doping away from NaFeAs produce a rapidly-increasing superconducting fraction and in the case of Co doping, which supplies one additional electron per Co atom, a fully superconducting state is attained between NaFe0.975Co0.025As and NaFe0.93Co0.07As with the maximum of 21 K attained in NaFe0.975Co0.025As.
Substituting Ni for Co at an equivalent doping level doubles the amount of electron doping but produces a very similar doping dependence of lattice parameters. As shown in Fig. 2, the isoelectronic compounds NaFe0.95Co0.05As and NaFe0.975Ni0.025As exhibit extremely similar susceptibilities. Similarly, at the electron-rich boundary of the superconducting region, the isoelectronic NaFe0.9Co0.1As and NaFe0.95Ni0.05As both show very tiny superconducting fractions. These results strongly suggest that electron count, and hence band filling, is the key parameter which controls the superconductivity in this series of compounds. Samples with higher doping levels than 0.1 electrons per Fe did not exhibit superconductivity.

Zero-field SR experiments were carried out on the GPS beamline at the Swiss Muon Source (SS). In NaFeAs, a clear oscillatory signal is observed [Fig. 3(a)] which can be fitted to an expression which is the sum of three components: . All three precession frequencies can be fitted and each follows a temperature dependence [Fig. 3(b)] consistent with a Néel temperature K and a critical exponent ; These results are consistent with antiferromagnetic order with a primarily two-dimensional character. The relaxation rates stay roughly constant with temperature, but one of them (corresponding to the highest frequency component) diverges at . On substituting 1% of the Fe ions with Co to obtain a sample with a superconducting fraction of about 60%, as judged by magnetometry, and a broad superconducting transition [Fig. 2], there is still evidence for long-range magnetic ordering in the sample, but the oscillations in the asymmetry are heavily damped [Fig. 3(d)] and lower in frequency and [Fig. 3(e)]. This implies a smaller internal field with a more inhomogeneous field distribution.
The undoped and lightly Co-doped samples were measured using high-resolution diffraction measurements at low temperatures. The non-superconducting “parent” phases of these arsenide superconductors commonly show a structural distortion driven by the long-range antiferromagnetic ordering. Such a distortion was not evident in the original report on NaFeAs parker , but it was observed in a higher resolution study dai and the symmetry of the distortion was observed to be similar to that in the “1111” and “122” parent phases with an orthorhombic cell of symmetry adopted at low temperatures where and are the tetragonal lattice parameters. On HRPD the splitting of, for example, the 112 reflection in into the 022 and 202 in is well resolved [Fig. 4(a)–(c)]. The high-resolution measurements show that in NaFeAs the distortion does not vanish until 55–60 K, well above the antiferromagnetic Néel temperature similar to the behaviour observed for all classes of parent materials apart from the Fe2As2 (=Ca, Sr, Ba) “122” series where the two transitions are coincident. Our measurements confirm that the two transitions identified by Chen et al. chen at 41 K and 52 K from heat capacity measurements correspond to the antiferromagnetic-ordering transition at 45 K and the structural distortion at about 55 K.


In the lightly Co-doped regime in which SR shows that antiferromagnetic ordering persists, diffraction measurements on the high-resolution powder diffractometer ID31 show that the distortion (, in terms of the basal plane orthorhombic lattice parameters) persists above [Fig. 4(d)–(e)]. The size of the distortion at 5 K decreases smoothly with increasing Co content [Fig. 4(f)] showing a similar dependence on composition to the Néel temperature.
In iron pnictide systems the structural distortion associated with antiferromagnetic order is known to be quenched in the fully superconducting regime. Measurements at 5 K on ID31 of NaFe0.975Co0.025As, which lies in this regime, revealed broadening of the reflections which would split under an orthorhombic distortion, while reflections which would not split retained their ambient temperature widths [Fig. 4(f) inset]. At 5 K, the orthorhombic model refined stably but the goodness of fit was negligibly superior to that of the tetragonal model and the lattice parameters were clearly correlated with the peak profile parameters. An orthorhombic distortion may thus persist into the superconducting regime, although the upper bound on is in NaFe0.975Co0.025As, an order of magnitude smaller than in NaFeAs, and marginal even using an extremely high-resolution diffractometer.
Once a large superconducting fraction is established () it is possible to use transverse-field SR to study the superfluid stiffness by measuring the temperature and field-dependence of the rms field broadening due to the vortex lattice sonier . Such experiments were performed using both SS and the ISIS Pulsed Muon Facility and these data can be used to deduce the in-plane penetration depth and superfluid stiffness using . Plotting our data on an Uemura plot (Fig. 5) demonstrates that the values of superfluid stiffness correlate well with the trend observed in hole-doped cuprates and other iron arsenides, in contrast to the enhanced superfluid stiffness found for LiFeAs flp .
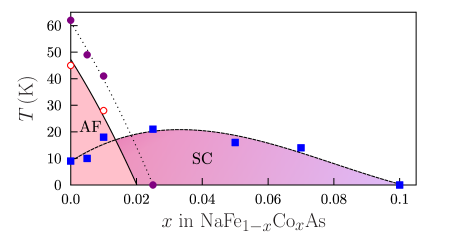
The conclusions of our work are that NaFeAs lies very close to one edge of a superconducting dome which is traversed by the addition of 0.1 electrons per Fe atom using either Co or Ni doping (see Fig. 6). As the system passes from the magnetically ordered regime to the superconducting regime there is a region of phase coexistence which has a width of less than 0.025 electrons per Fe, so the system is extremely sensitive to composition. The width and shape of the superconducting dome and the width of the coexistence region are similar to those determined in the “122” system Ba(Fe1-xCox)2As2 fisher and in the “1111” system CaFe1-xCoxAsF matsuishi .
We thank the EPSRC (UK) for financial support and STFC (UK) for access to ISIS and ESRF, K. S. Knight for assistance on HRPD, and A. N. Fitch and I. Margiolaki for assistance on ID31. Part of this work was performed at the Swiss Muon Source (SS).
References
- (1) Y. Kamihara, T. Watanabe, M. Hirano, and H. Hosono, J. Am. Chem. Soc. 130, 3296, (2008).
- (2) K. Ishida, Y. Nakai and H. Hosono J. Phys. Soc. Jpn, 78, 062001, (2009).
- (3) H. Ogino et al. Supercond. Sci. Technol. 22, 075008, (2009).
- (4) M. J. Pitcher et al. Chem. Commun. 5918, (2008).
- (5) J. H. Tapp et al. Phys. Rev. B 78, 060505(R) (2008).
- (6) D. R. Parker et al. Chem. Commun. 2189 (2009).
- (7) A. Larson and R. B. von Dreele, The General Structure Analysis System, Los Alamos National Laboratory, Los Alamos, NM, (1985).
- (8) S. Li et al. Phys. Rev. B 80, 020504(R) (2009).
- (9) G. F. Chen, W. Z. Hu, J. L. Luo, and N. L. Wang, Phys. Rev. Lett. 102, 227004, (2009).
- (10) C. W. Chu et al. Physica C 469, 326, (2009).
- (11) J. E. Sonier, J. H. Brewer, and R. F. Kiefl, Rev. Mod. Phys. 72, 769 (2000).
- (12) H. Luetkens et al. Phys. Rev. Lett. 101, 097009 (2008).
- (13) A. J. Drew et al. Phys. Rev. Lett. 101, 097010 (2008); R. Khasanov et al. Phys. Rev. B 78, 092506 (2008).
- (14) J. P. Carlo et al. Phys. Rev. Lett. 102, 087001 (2009).
- (15) Y. J. Uemura, Physica B 374, 1 (2006).
- (16) F. L. Pratt et al. Phys. Rev. B 79, 052508, (2009).
- (17) J.-H. Chu, J. G. Analytis, C. Kucharczyk and I. R. Fisher, Phys. Rev. B 79, 014506, (2009).
- (18) S. Matsuishi et al. J. Am. Chem. Soc. 130, 14428, (2008).