The Foggy Disks Surrounding Herbig Ae Stars: a Theoretical Study of the H2O Line Spectra
Abstract
Water is a key species in many astrophysical environments, but it is particularly important in proto-planetary disks. So far, observations of water in these objects have been scarce, but the situation should soon change thanks to the Herschel satellite. We report here a theoretical study of the water line spectrum of a proto-planetary disk surrounding Ae stars. We show that several lines will be observable with the HIFI instrument onboard the Herschel Space Observatory. We predict that some maser lines could also be observable with ground telescopes and we discuss how the predictions depend not only on the adopted physical and chemical model but also on the set of collisional coefficients used and on the H2 ortho to para ratio through its effect on collisional excitation. This makes the water lines observations a powerful, but dangerous -if misused- diagnostic tool.
1 Introduction
Water is a very special molecule in the interstellar medium for its crucial role in cooling the molecular gas. However, because of its abundance in the Earth’s atmosphere, observations of water have to be made from space. Notable exceptions are the observations of its isotopes (HO, HDO and D2O), whose rotational transitions can be observed with ground-based telescopes (e.g., Butner et al., (2007) for the detection of D2O, or some maser lines Cernicharo et al., (1990, 1994, 1996, 2006)).
Similarly, water is of particular importance in protoplanetary disks, the sites where planets are formed. More difficult to detect than in other astrophysical environments, HDO has so far been detected in only one protoplanetary disk (Ceccarelli et al.,, 2005), and only very recently the Spitzer Space Telescope detected warm H2O from the innermost regions of protoplanetary disks (Carr & Najita,, 2008; Salyk et al.,, 2008). These observations rose the question of the origin of the observed warm water as H2O was predicted to be absent in the innermost disk. On the contrary, water is expected to be present in the outer regions of the disk, where the bulk of the gas resides. But water has never been detected in those colder regions. The situation will hopefully soon change thanks to the Herschel Space Observatory, and, specifically, the HIFI instrument which will allow to observe the water lines with unprecedented sensitivity, spectral and spatial resolution. In this Letter, we report the predictions of the H2O spectrum toward a typical disk surrounding a Herbig Ae star, similar to the one of HD 97048.
We first describe the adopted physical and chemical structures, based on previously published models, and the method to compute the emerging line spectrum (§2). We then show the results of our computations (§3) and discuss how they depend on the distribution of the grain sizes across the disk, a key parameter in the evolution of the protoplanetary disks and the formation of planets. We also show the impact of the adopted set of collisional rates on the predictions and the importance of having a full modeling of the spectrum to derive reliable physical and chemical parameters from the water lines.
2 Model description
The disk structure used in the present calculations is inspired by the disk model derived for HD 97048 by Lagage et al., (2006) and Doucet et al., (2007). The dust mass in the disk is 10-4M⊙, distributed following power-laws for the scale height and surface density, and located between R0.9 AU and R 400 AU. The flaring exponent is 1.26 and the exponent for the surface density is . The gas scale height is 51 AU at the reference radius of 135 AU. The continuum radiative transfer and dust temperature calculations are performed with MCFOST, a Monte Carlo based code (Pinte et al.,, 2006, 2009). The central star has Teff=10000K and a radius of 2 R⊙. The dust opacity is calculated with the Mie theory and the dust composition is the mixture given by of Mathis & Whiffen, (1989). The grains size distribution follows a power-law ranging from 0.03m to 1mm in radius and the usual ISM slope of -3.5. Two models are calculated, one where dust is fully mixed throughout the disk, and one where vertical settling has occurred and large particles have been removed from the disk surface and progressively settled to the disk midplane as a function of their size, the larger the grain the more complete the settling. In the following we refer to the latter as stratified disk model. Details about the parameterization of the dust settling are given in Pinte et al., (2008). The exponent describing the settling has been fixed to 0.25, a value that fits the observations of GG Tau (Pinte et al.,, 2007). The continuum calculations made with MCFOST provided the density and temperature profiles, as well as the UV radiation field fully propagated including multiple scattering, to further compute the H2O abundance and line spectrum with other tools described below.
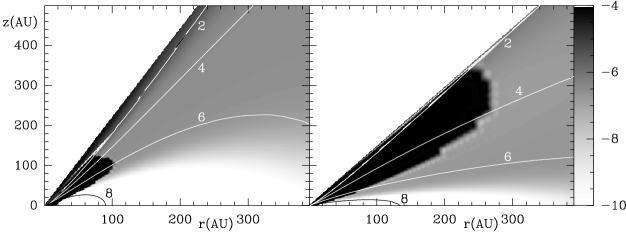
The H2O abundance profile has been computed following the model described in Dominik et al., (2005). The model has been verified against the more extended chemical model by Willacy, (2007) to give similar results. Briefly, at the conditions prevailing in the protoplanetary disks described above, the major reservoir of water is that frozen on the dust grain mantles. The latter inject water into the gas phase because of two major mechanisms: i) the sublimation of the H2O-rich ices when the dust temperature exceeds about 100 K, and ii) the photo-desorption of the H2O-rich ices due to the FUV photons from the Interstellar Field and the star itself (Dominik et al.,, 2005; Willacy,, 2007). These two mechanisms completely dominate the abundance profile of the water across the disk. The results for the disk described above are shown in Fig. 1 which shows the case of a standard grain size distribution and the case where a stratification is present (see above). In both cases, three regions can be identified: 1) at radii less than about 20 AU, water is abundant at any height of the disk because of the warm dust temperature ( K) and water ice sublimation; 2) between 20 AU and about 100 AU (or 250 AU in the case of dust stratification), water is mostly frozen onto the grain mantles on the equatorial plane (where the density is larger than cm-3 and the dust temperature lower than K) but it is very abundant ( with respect to H2) in the regions just above the plane because of ice sublimation; 3) at radii larger than about 100 AU (or 250 AU in the case of dust stratification), water is frozen in the equatorial plane and abundant () above it because of the photo-desorption of the ices by the FUV photons. The major difference in the water abundance distribution between the non stratified and stratified case is, therefore, a much larger region where ices sublimate and water is abundant (10-4). We will show that this has important consequences on the emerging H2O line spectrum. Another important difference between the two cases is the continuum emission from the dust grains which also largely affects the emerging water line profiles.
Given the intrinsic geometry of the problem, a full modeling of the water line spectrum would require a 2-D treatment. However, in the specific case of water, the lines are greatly optically thick and, because of the disk geometry, the line optical depths in the horizontal direction are by far larger than in the vertical one. We therefore developed a pseudo 2-D code where we computed the radiative transfer along the vertical direction at 50 and 70 different disk radii for the non stratified and the stratified case respectively. Other authors have discussed and verified the validity of this approach (Pavlyuchenkov et al.,, 2007; Asensio-Ramos et al.,, 2007). The radial distances for each set of models have been selected in order to sample the variations of density and water abundance given by the physical structure of the disk. We have assumed an intrinsic turbulent velocity of 0.5 kms-1 (see, e.g., the case for MWC758 and CQ Tau published by Chapillon et al., (2008)). The sampling in height has been adjusted to trace narrowly the upper layers of the disk where the line opacity of the thicker lines is 1 and photons do escape. The equatorial zone is treated as a continuum source (water abundance in these regions is 10-10) with a temperature identical to that of the dust grains and a spectral dependence on the dust opacity of 0.65. The code used for the 1-D radiative transfer models has been described in González-Alfonso & Cernicharo, (1993, 1997). We used the collisional rates with the H2 by Faure et al., (2007), assuming that all H2 is in the ortho form. We will discuss the impact of this assumption on the computed emerging line spectrum by comparing the predicted emerging spectrum obtained by considering different sets of collisional coefficients. Finally, in all models the orto-to-para H2O ratio was assumed equal to 3:1.
3 Results and Discussion
Figure 2 shows the profile of a selected sample of lines, namely the brightest lines observable with the HIFI instrument onboard the Herschel observatory. In order to identify the regions contributing to the emerging profiles we present the results for a face-on disk convolved with the beam of Herschel’s telescope. Hence, the line profiles are totally dominated by the opacity of the lines and the variation of excitation temperature with radius and height above the disk. Several kind of profiles are predicted, depending on the line and whether dust grains are stratified or not. In the case of dust stratification, several lines are predicted to be in emission with a central dip caused by self-absorption. Other lines show a combination of emission and absorption profiles. For example, the para line at 1.111 THz is in absorption with two “emission peaks” at velocities at about 1 km/s arising from the outer (r200 AU) disk, where the water abundance is lower. Another important example is represented by the 557 GHz line, which shows two emission peaks again at about 1 km/s produced by the regions with r180 AU, and a deep absorption in the central velocities of the continuum produced at all radii but particularly strong at r 120 AU (see Fig. 4). The situation dramatically changes for the case with no dust stratification. Almost all lines go entirely in absorption against the dust continuum, because of the brighter continuum. The only exception is the 1153 GHz line, thanks to its relatively low spontaneous emission coefficient (10 times lower than, for example, the line at 1163 GHz). In general, the line profiles are dominated by the line optical depth and the variation of excitation temperature with height and radius. Besides, due to the relatively large telescope beam and to the large line opacities the water lines of Fig. 2 largely probe the upper layers of the outer disk where ices are photo-desorbed. The wiggles presented by some water lines in the no-stratified model are due to the strong decrease of water abundance for r120 AU compared to the stratified case.

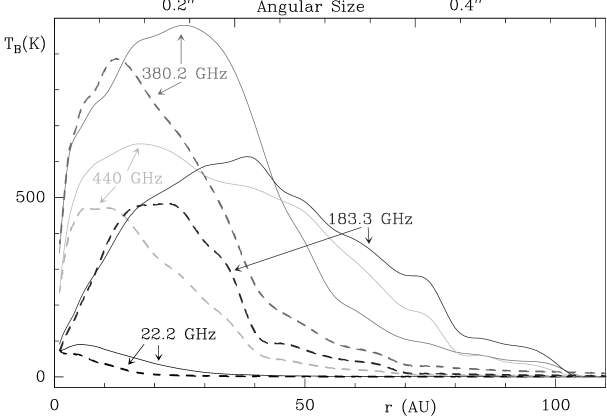
Several H2O lines show masering effects in the inner disk equatorial plane because of the high densities and temperatures prevailing there. Figure 3 shows the brightness temperature TB of the four brightest maser lines as a function of disk radius. All of them probe the inner ( AU) and denser regions of the disk, but each of them peaks at a different radius, probing, therefore, a different part of the disk. In principle, observations of these maser lines would allow to constrain the physical and chemical structure of the inner disk, even if the spatial resolution is not large enough to resolve the emission. Of all the shown maser lines, the 183.3 GHz seems to be the most promising. For example, we predict a signal of 3 and 1 K at the IRAM-30m telescope for the non stratified and the stratified case respectively. Such signals can easily be detected under good weather conditions (Cernicharo et al.,, 1990). This is particularly true for the ALMA interferometer.
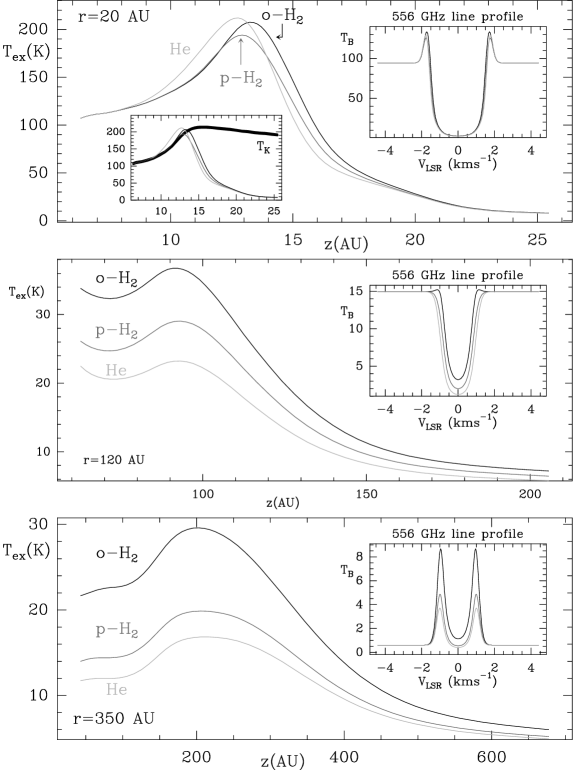
We have also computed the emerging profiles for the isotope HO of water assumed to be 500 times less abundant than H2O. In spite of the large abundance ratio the intensities predicted for the fundamental line of the rare isotope are not very different from those of the main isotope. Of course, the HO fundamental line penetrates deeper in the disk probing a different region than the main isotope. Finally, in order to help understanding the role of collisional pumping on the emerging water line spectrum, Fig. 4 shows the excitation temperature, Tex, of the fundamental line of water 110-101 as function of the height above the disk at radii 20, 120 and 350 AU. Three different sets of collisional coefficients are used: i) collisions with He, scaled by the H2 mass, as computed by Green et al., (1993); ii) collisions with the ortho-H2, as computed by Faure et al., (2007); iii) collisions with para-H2, computed by the same authors.
We notice three effects. First, Tex is always larger for computations obtained with the ortho-H2 collision coefficients set and smaller with the He set. This directly reflects the value of the collisional coefficients, larger for the former set of coefficients. Second, at the three radii the difference in the Tex obtained with the three sets of collisional coefficients is larger going towards the equatorial plane, and can be as high as a factor two. This reflects the different population mechanisms at work in the different regions. At larger heights, the difference diminishes because the lines are more and more radiatively populated, an effect nicely seen at radii 20 AU where the three sets of collisional coefficients produce the same Tex. Third, the lines, integrated along the disk height, at r=120 and 350 AU, show slightly different profiles and very different intensities, reflecting the different excitation conditions and line optical depths. At the smaller radius, 120 AU, the line is in absorption against the continuum: the absorption is larger in the case of the He collisional coefficients set and smaller in the case of ortho-H2 set. At the larger radius, 350 AU, the line goes in emission with a self-absorption dip in the central velocities: the line is weaker in the case of the He collisional coefficients set and brighter in the case of ortho-H2 set.
The emerging line profile is obtained by integrating these profiles over the radii and will, therefore, depend on the balance of the absorption/emission in the different parts of the disks. In the specific case of the 556 GHz line reported in Fig. 2, the line can be substantially in absorption or in emission, depending on the choice of the collisional coefficients. For small radii (r120 AU), the line profiles do not depend on the set of collisional rates while differences of up to a factor of 2 can be found at larger radii.
We have performed the full calculations for the case in which H2 is in the para form, rather than ortho as assumed in the calculations of Fig. 2, using again the collisional coefficient calculated by Faure et al., (2007). The emerging line profiles dramatically change: lines in emission become weaker and the absorption becomes stronger. We note that we obtain similar results (with differences below 5%) when we used the more recent collisional coefficients by Dubernet et al., (2009). In summary, the emerging profile of the water spectrum strongly depends on the o-H2/p-H2 abundance ratio, which likely depends on the chemical history prior to the formation of the protoplanetary disk and its subsequent chemical evolution. The interpretation of the water line profiles will remain, therefore, challenging in spite of the accurate collisional rates available in the litterature. In summary, the major results of the present work are the following: a) First, and foremost, several H2O lines are predicted to be detectable with the newly launched space-born telescope Herschel. Some maser lines are also observable with ground telescopes. b) Even though we did not study the case of a different chemistry (for example the absence of water ices photodesorption, as in several previous published models; e.g. Aikawa & Nomura, (2006), or Woitke et al., (2009), the comparison between the stratified versus no stratified case shows that the assumed water abundance profile is crucial in the emerging line spectrum. The comparison of our predictions with those recently published by Woitke et al. (2009), who used a different chemical structure, strengthens this statement. The differences between our results and theirs are mainly due to the different water abundance profile, in particular in the upper layers, to the dust settling we have introduced in our models, and to the inclination assumed for their disk. Besides, the dust continuum emission is also crucial. In fact, if not for other reasons, line fluxes and profiles depend on the position of the water molecules with respect to the dust absorbing continuum. Therefore, predictions based on simplistic models based on constant abundance across the disk cannot be trusted. c) The transition where a line goes from emission to absorption not only depends on the dust and gas temperature and density profiles, but also on the collisional coefficients. This dependence is indeed critical. In practice, the emerging line spectrum strongly depends on the H2 para-to-orto ratio, a poorly known quantity. To conclude, observations of water lines will be a very powerful diagnostic tool to understand the structure of proto-planetary disks. The analysis of water line profiles will be a challenge because the levels are sub-thermally populated, the dust photons play a crucial role in the pumping, and the huge line opacities favour the vertical diffusion of photons. On the other hand, the information which can be extracted by H2O observations warrants the effort: amongst others, the amount of water present in the first phases of a planetary system birth. This work has been supported by Spanish MICINN through grant AYA2006-14876, by DGU of the CM under IV-PRICIT project S-0505/ESP-0237 (ASTROCAM). We also thank the French ANR (contracts ANR-08-BLAN-0225, ANR-07-BLAN-0221) and PNPS of CNRS/INSU for support. We thank J.R. Goicoechea for useful comments.
References
- Aikawa & Nomura, (2006) Aikawa Y., Nomura H., 2006, ApJ, 642, 115
- Asensio-Ramos et al., (2007) Asensio-Ramos A., Ceccarelli C., Elitzur M., 2007, A&A, 471, 187
- Butner et al., (2007) Butner H., Charnley S., Ceccarelli C., et al., 2007, ApJ, 659, L137
- Carr & Najita, (2008) Carr J.S., Najita J.R., 2008, Science, 319, 1504
- Ceccarelli et al., (2005) Ceccarelli C., Dominik C., Caux E., et al., 2005, ApJ, 631, L81
- Cernicharo et al., (1990) Cernicharo J., Thum C., Hein H., et al., 1990, A&A, 231, L15
- Cernicharo et al., (1994) Cernicharo J., González-Alfonso E., et al., 1994, ApJ, 432, L59
- Cernicharo et al., (1996) Cernicharo J., Bachiller R., González-Alfonso E., 1996, A&A, 305, L5
- Cernicharo et al., (2006) Cernicharo, J., Goicoechea J., Pardo J.R., Asensio-Ramons A., 2006, ApJ, 642, 940
- Chapillon et al., (2008) Chapillon E., Guilloteau S., Dutrey A., Piétu V., 2008, A&A, 488, 565
- Dominik et al., (2005) Dominik C., Ceccarelli C., Hollenbach D., Kaufman M., 2005, ApJ, 635, L85
- Doucet et al., (2007) Doucet C., Habart E., Pantin E., et al., 2007, A&A, 470, 625
- Dubernet et al., (2009) Dubernet M.L., Daniel F., et al., 2009, A&A, 497, 911
- Faure et al., (2007) Faure A., Crimier N., Ceccarelli C., et al., 2007, A&A, 472, 1029
- González-Alfonso & Cernicharo, (1993) González-Alfonso E., Cernicharo J., 1993, A&A, 279, 506
- González-Alfonso & Cernicharo, (1997) González-Alfonso E., Cernicharo J., 1997, A&A, 322, 938
- Green et al., (1993) Green S., Maluendes S., McLean A.D., 1993, ApJS, 85, 181
- Lagage et al., (2006) Lagage P.O., Doucet C., Pantin E., et al., 2006, Science, 314, 621
- Mathis & Whiffen, (1989) Mathis J.S., Whiffen G., 1989, ApJ, 342, 808
- Pavlyuchenkov et al., (2007) Pavlyuchenkov Ya, Henning Th., Wiebe D., 2007, ApJ, 669, L101
- Pinte et al., (2006) Pinte C., Ménard F., Duchene G., Bastien P., 2006, A&A, 459, 797
- Pinte et al., (2007) Pinte C., Fouchet L., Ménard F., et al. 2007, A&A, 469, 963
- Pinte et al., (2008) Pinte C., Padgett D.L., Ménard F., et al. 2008, A&A, 489, 633
- Pinte et al., (2009) Pinte C., Harries T.J., Min, et al., 2009, A&A, 498, 967
- Salyk et al., (2008) Salyk C., Pontoppidan K., Blake G.A., et al., 2008, ApJ, 676, L49
- Willacy, (2007) Willacy K., 2007, ApJ, 660, 441
- Woitke et al., (2009) Woitke P., Thi W.F., Kamp I., et al., 2009, A&A501, L5