Evolutionary paths to and from the red sequence:
Star formation and \hi properties of transition galaxies at 0
Abstract
We investigate the properties of galaxies between the blue and the red sequence (i.e., the transition region, 4.56 mag) by combining ultraviolet (UV) and near-infrared imaging to 21 cm \hi line observations for a volume-limited sample of nearby galaxies. We confirm the existence of a tight relation between colour and \hi-fraction across all the range of colours, although outside the blue cloud this trend becomes gradually weaker. Transition galaxies are divided into two different families, according to their atomic hydrogen content. ‘\hi-deficient’ galaxies are the majority of transition galaxies in our sample. They are found in high density environments and all their properties are consistent with a quenching of the star formation via gas stripping. However, while the migration from the blue cloud is relatively quick (i.e., 1 Gyr), a longer amount of time (a few Gyr at least) seems required to completely suppress the star formation and reach the red sequence. At all masses, migrating ‘\hi-deficient’ galaxies are mainly disks, implying that the mechanism responsible for today’s migration in clusters cannot have played a significant role in the creation of the red sequence at high-redshift. Conversely, ‘\hi-normal’ transition galaxies are a more heterogeneous population. A significant fraction of these objects show star formation in ring-like structures and evidence for accretion/minor-merging events suggesting that at least part of the \hi reservoir has an external origin. The detailed evolution of such systems is still unclear, but our analysis suggests that, in at least two cases, galaxies might have migrated back from the red sequence after accretion events. Interestingly, the \hi available may be sufficient to sustain star formation at the current rate for several billion years. Our study clearly shows the variety of evolutionary paths leading to the transition region and suggests that the transition galaxies may not be always associated with systems quickly migrating from the blue to the red sequence.
keywords:
galaxies:evolution–galaxies: fundamental parameters–galaxies: clusters:individual: Virgo–ultraviolet: galaxies– radio lines:galaxies1 Introduction
The last decades have seen the rise and success of the hierarchical paradigm for galaxy formation in a cold dark-matter dominated universe. Although very powerful, the concordance model is still far from providing us with a complete and coherent view of how galaxies form and evolve. This is mainly because we still do not understand the physics involving the baryonic component. The current challenge for galaxy formation and evolution studies is thus to improve our knowledge of the astrophysical processes responsible for transforming simple dark matter halos into the bimodal population of galaxies inhabiting today’s universe.
It is in fact well established that, when we look at their integrated optical colours, galaxies constitute a bimodal population (e.g., Tully et al. 1982; Baldry et al. 2004) composed of a ‘red sequence’, dominated by old stellar populations, and a ‘blue cloud’ where the vast majority of new stars in the universe are formed. However, the dichotomy in the colour distribution does not automatically reflect a difference in morphological type (e.g., light distribution) and we now know that the red sequence is not only composed of quiescent early-type galaxies (e.g., Scodeggio et al. 2002; Franzetti et al. 2007). For example, while the red sequence accounts for 60-85% (depending on the colour cut used to define star-forming galaxies) of the total stellar-mass density in the local universe (e.g., Baldry et al. 2004; Bell et al. 2003; Borch et al. 2006; Pérez-González et al. 2008), stars in late-type galaxies contribute to at least half the local stellar mass budget (e.g., Driver et al. 2006, 2007a, 2007b; Kochanek et al. 2001). This automatically implies that a significant fraction of massive late-type galaxies lie in the red sequence, whereas high-mass blue ellipticals are extremely rare. Moreover, not all red galaxies have stopped forming stars, as revealed by recent ultraviolet (UV) investigations (e.g., Kaviraj et al. 2007). It thus emerges that, at least at optical wavelength, the red sequence is a heterogeneous family of objects which have likely followed different evolutionary paths.
How galaxies end-up in the red sequence is still partly a mystery, but recently high-redshift surveys have made it possible to start tracing the growth of the star-forming and quiescent galaxy population up to 1 and beyond. Despite the observational and theoretical uncertainties (e.g., Conroy et al. 2009), it seems now commonly accepted that the stellar mass of the blue cloud shows very little growth since 1, while the red sequence has grown by at least a factor 2 (e.g. Cimatti et al. 2006; Arnouts et al. 2007; Bell et al. 2007; Brown et al. 2007; Faber et al. 2007). The most popular scenario invoked to explain the growth of red galaxies is a migration of a significant fraction of star-forming systems from the blue cloud. Although not always supported (Blanton 2006), the possibility of an exchange of galaxies between the two sequences is exciting, and several theoretical and observational studies have started to look for the possible astrophysical processes responsible for such transition. Several mechanisms have been proposed so far, among the most popular are different modes of gas accretion (Kereš et al. 2005; Dekel & Birnboim 2006), feedback from active galactic nuclei (AGN, Schawinski et al. 2009), and environmental effects (e.g., Hughes & Cortese 2009, hereafter HC09). However, whether a population of migrating galaxies does really exist and what causes the quenching of their star formation is still not clear.
In this context, the advent of the Galaxy Evolution Explorer (GALEX) large-area UV surveys is allowing us to tackle this problem from a different angle. Thanks to its high sensitivity to low-level star formation activity, UV magnitudes can be used to better discriminate between quiescent and still active (although optically-red) galaxies. In fact, contrary to what is observed at optical wavelengths, the UV-optical colour distribution at a given mass is not well fitted by two gaussian distributions (Wyder et al. 2007), but it shows a significant excess of objects in the region between the blue and red sequence (i.e., the ‘so-called’ transition region or ‘green-valley’, Martin et al. 2007b). Transition galaxies may thus represent the missing link to understand if and how galaxies move from one population to the other. However, it is worth reminding that, despite its potential, UV emission is significantly affected by dust and, only after accurate dust corrections, can the UV-optical colour be used to identify transition galaxies. A significant fraction of galaxies found between the two sequences may in fact be composed of reddened systems (Cowie & Barger 2008).
Once transition galaxies are properly identified, a reconstruction of their past evolution is not straightforward. The correct discrimination between various physical mechanisms able to suppress star formation requires, in theory, a detailed investigation of all the galactic components, i.e., stars, gas and dust. Of particular importance is the atomic gas content (\hi), which represents the fuel for the future star formation activity. The mechanism responsible for the migration from the blue cloud must in fact inhibit the condensation of atomic into molecular hydrogen and the onset of star formation. Unfortunately, not only is \hi astronomy still technically limited to the nearby universe (e.g., Catinella et al. 2008a), but also our knowledge of \hi properties of local galaxies is generally restricted to the blue cloud (e.g., Cortese et al. 2008b). The very local universe (e.g., up to the distance of the Virgo cluster) is currently the only place where it is possible to investigate the link between \hi-content and quenching of star formation in transition galaxies.
For all these reasons, we have collected UV to near-infrared imaging and \hi 21cm line data for a volume-limited sample of nearby galaxies covering different environments. In our previous paper (HC09), we have highlighted the power of a combination of UV and \hi observations to understand the properties of transition galaxies. Our analysis suggested a strong relationship between UV-near-infrared colour and \hi content showing that migrating spirals are mainly \hi-deficient objects found in high density environments. This result apparently rules out AGN-feedback as the main mechanism responsible for the quenching of the star formation in nearby spirals. However, a number of important questions still remain to be answered. Are transition galaxies really migrating from the blue to the red sequence? What are the time-scales of such migration? Is the quenching followed by a change in morphology? While in HC09 we have shown that a large fraction of spirals outside the blue cloud is \hi-deficient, this is not true for all transition spirals. How have \hi-rich systems reached the transition region? The aim of this paper is thus to extend the analysis presented in HC09, in order to provide important constraints on the recent mass growth of the red sequence.
The paper is arranged as follows. In § 2 we briefly describe the sample and discuss possible biases related to the dust extinction correction. In § 3 we define the transition region and in § 4 discuss the relation between colour and gas content. The properties of transition galaxies are presented in § 5 and their evolutionary histories and implications for galaxy evolution studies are discussed in § 6. Finally, our main results are briefly summarized in § 7.
2 The sample
The analysis presented in this paper is based on the K-band selected sample described in HC09. Briefly, it consists of a volume-limited sample of galaxies having 2MASS (Skrutskie et al. 2006) K-band magnitude K 12 mag and distance between 15 and 25 Mpc. Additional selection criteria are a high galactic latitude (b +55∘) and low galactic extinction, AB 0.2 (Schlegel et al. 1998), to minimize galactic cirrus contamination. The total sample contains 454 galaxies. Observations from the GALEX (Martin et al. 2005) GR2 to GR4 data releases in the near- (NUV; =2316 Å: =1069 Å) and far-ultraviolet (FUV; =1539 Å: =442 Å) band were available for 394 and 325 objects, respectively. In the rest of the paper we focus our attention mainly on the colour, given the larger number statistics available. UV magnitudes were obtained by integrating the flux over the galaxy optical size, determined at the surface brightness of (B) = 25 mag arcsec-2. The typical uncertainty in the UV photometry is 0.1 mag and 0.15-0.20 mag in NUV and FUV respectively. Stellar masses are determined from H-band luminosities using the colour-dependent stellar mass-to-light ratio relation from Bell et al. (2003), assuming a Kroupa et al. (1993) initial mass function. Single-dish \hi 21 cm line emission data, necessary for quantifying the \hi content of galaxies, was mainly taken from Springob et al. (2005), Gavazzi et al. (2003) and the NASA/IPAC Extragalactic Database (NED). Given the variety of sources from which the \hi fluxes are taken, it is impossible to define a 21 cm sensitiveness limit for our sample. However, as discussed in § 4, non detections start to be significant (20%) at -1.3 and dominate (50%) for -2.1. Estimates of atomic hydrogen mass or upper limits are available for 83% (326/394) of the galaxies with NUV photometry. We estimate the \hi deficiency parameter () as defined by Haynes & Giovanelli (1984): i.e., the difference, in logarithmic units, between the observed \hi mass and the value expected from an isolated galaxy with the same morphological type and optical linear diameter : . We used the equation in Haynes & Giovanelli (1984) for early-type galaxies (E/S0 and earlier types) and the four revised values presented by Solanes et al. (1996) for late-types (Sa-Sab, Sb, Sbc, Sc and later) to calculate the expected \hi mass from the optical diameter. The regression line coefficients are almost identical from Sa to Sbc types, whereas they both significantly vary going to E/S0 or to Sc and later types (Haynes & Giovanelli 1984; Solanes et al. 1996). The typical uncertainty in the estimate of is 0.3 (e.g. Haynes & Giovanelli 1984; Fumagalli et al. 2009), but it might slightly increase for dwarf galaxies and early-type systems. Given its large uncertainty, in the following, we will mainly use the \hi deficiency to select those galaxies which have likely lost a significant amount of atomic hydrogen. In detail, we use a threshold of 0.5 to discriminate between ‘\hi-deficient’ and ‘\hi-normal’ galaxies. \hi-deficient systems are thus objects with 70% less atomic hydrogen than expected for isolated objects of the same optical size and morphological type.
2.1 Extinction correction
The estimate of the internal UV dust attenuation is a crucial step for a correct interpretation of the colour-mass diagram. This is particularly true outside the blue cloud where a) evolved stellar populations can contribute to the dust heating (Cortese et al. 2008a), b) a significant fraction of the UV emission may come from evolved stars and not from young stellar populations (in particular in the red sequence, e.g. Boselli et al. 2005b). Previous works have shown how dramatic the effect of inaccurate dust corrections can be on the transition region and red sequence (Wyder et al. 2007; Schiminovich et al. 2007; Cortese et al. 2008a). Cortese et al. (2008a) have recently calibrated new recipes to estimate the dust attenuation, taking into account the contribution of evolved stellar population to the dust heating. Although this method provides more realistic dust corrections with an average error of 0.5 mag in , the uncertainty dramatically increases up to 1 mag for galaxies lying between the blue and the red sequence. Thus, the transition region can only be investigated using a statistical approach and a comparison between colours and SFRs of transition galaxies could be meaningless given such large uncertainties.
Unfortunately, all dust correction recipes developed so far are calibrated on late-type/star-forming galaxies whereas in the case of early-type/quiescent systems (the dominant population in the red sequence) it is not a priori appropriate to apply such corrections. The UV emission coming from old stellar populations should in fact be less affected by dust. For example, a systematic (but likely unreal) shift of 0.5 mag is applied to the red sequence if the extinction corrections calibrated on late-types are applied to early-type galaxies (Cortese et al. 2008a). In order to avoid any systematic overestimate of the SFR in early-type galaxies (and also to be consistent with previous works) here we corrected all galaxies for Galactic extinction according to Schlegel et al. (1998), but we applied internal extinction corrections only to late-type galaxies. In detail, the internal dust attenuation was determined using the total infrared (TIR) to UV luminosity ratio method (e.g., Xu & Buat 1995) and the age-dependent relations of Cortese et al. (2008a). The TIR luminosity is obtained from IRAS 60 and 100 m fluxes or, in the few cases when IRAS observations are not available, using the empirical recipes described in Cortese et al. (2006).
Although this technique is likely to overestimate the colour of the few early-type galaxies lying in the blue cloud, we can exclude that it significantly affects the properties of transition region early-type galaxies and peculiar gas-rich ellipticals studied in the following sections. To test this hypothesis, we applied the dust attenuation corrections described above to these objects finding that, even after correcting for dust, transition early-types still lie in the transition region and peculiar red ellipticals are still in the red sequence. However, in the following, we will try to discuss as much as possible any systematic error that could be introduced by problems in the extinction corrections and all error-bars shown in our figures take into account the uncertainty in the estimate of .
3 Where does the blue cloud end?
Contrary to what is observed in optical (Baldry et al. 2004), at fixed stellar mass, the UV-optical colour distribution of galaxies is not best fitted with the sum of two gaussians. An excess of galaxies is clearly present in between the two sequences (Wyder et al. 2007). This is likely due to galaxies with suppressed star formation perhaps migrating from the blue to the red sequence. However, it is not straightforward to clearly define the range of colours characterizing galaxies which do not belong either to the blue cloud or the red sequence.
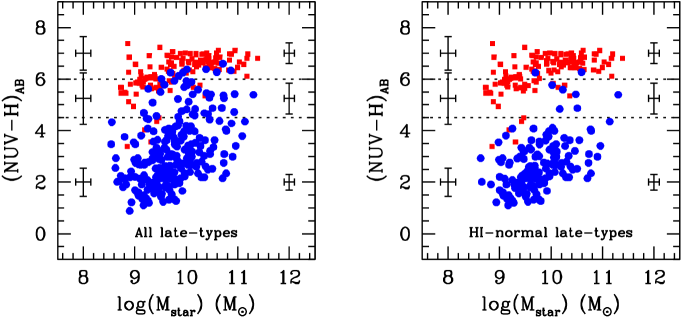
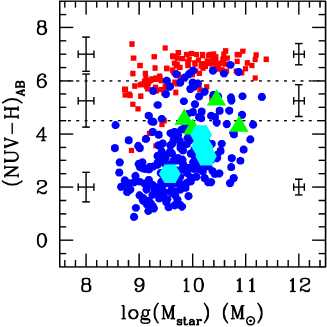
On one side, it is difficult to determine (both observationally and theoretically) where the blue cloud ends. In this paper we decide to use the blue cloud of \hi-normal galaxies to determine the range of colours typical of unperturbed galaxies. This is motivated by the fact, discussed in HC09, that the transition region is mainly populated by \hi-deficient galaxies in high-density environments. \hi-normal late-type galaxies form a blue cloud clearly separated from the red sequence at all masses, as shown in the right panel of Fig. 1. We thus define galaxies with suppressed star formation as those objects with 4.5 mag (corresponding to the 90th percentile of the colour of \hi-normal spirals with M1010 M⊙), consistently with Martin et al. (2007a). This colour-cut roughly corresponds to star formation histories (SFHs) having e-folding time-scale of 3 Gyr (assuming a galaxy age of 13.7 Gyr, solar metallicities and the models of Bruzual & Charlot (2003)) e.g., the typical e-folding time dividing local late- and early-type galaxies (Gavazzi et al. 2002). We note that, adopting this convention, M31 would be classified as ‘normal’ blue-cloud galaxy (4.1 mag). Being calibrated on massive galaxies, our colour-cut must be considered as a conservative upper-limit in the case of dwarf systems.
On the other side, UV-to-near-infrared colours typical of the red sequence (6) can either indicate low residual star formation activity or old, evolved stellar populations (e.g. Boselli et al. 2005b). The phenomenon of the UV-upturn (O’Connell 1999) makes colours redder than 6 difficult to interpret so that the colour cannot be considered anymore as a good proxy for the specific star formation rate (SSFR). Following Kaviraj et al. (2007), we use observations of well known strong UV-upturn galaxies to derive a lower limit on the colour typical of evolved stellar populations. In details, given the typical colour observed in M87 ( 6.1 mag) and NGC4552 ( 6.4 mag), we assumed =6 mag as a conservative lower limit to discriminate between residual star formation and UV-upturn. The validity of this colour-cut is confirmed by a visual inspection of GALEX colour images, which indicates that only 6% (i.e. 6 objects) of galaxies redder than =6 mag show clear evidence of residual SF (e.g., blue star-forming knots).
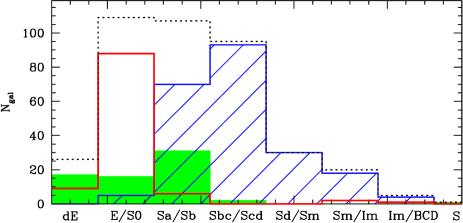
The morphological type distributions for galaxies belonging to the three groups here considered (i.e., blue cloud, red sequence and transition region) are shown in Fig. 2. It clearly emerges that red and blue galaxies are two disjoint families not only in colour, but also in shape.
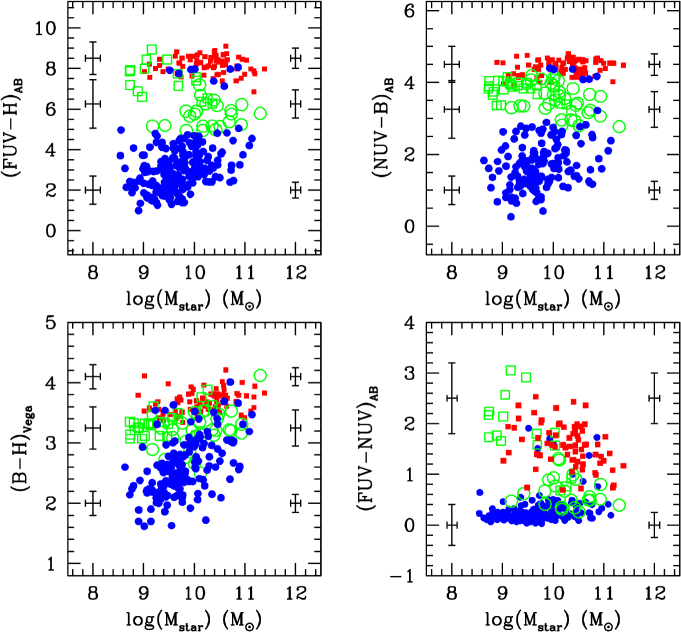
Of course, the criteria described above are arbitrary and vary according to the colour adopted and to the stellar mass range investigated. This can be clearly seen in Fig. 3, where the position of ‘transition galaxies’ in different UV and optical colour-stellar-mass diagrams is highlighted. Although it is indisputable that not all transition galaxies are outside the red sequence in a and colour diagram (in particular at low stellar-masses), it emerges that the definition here adopted is able to select a statistically representative sample of galaxies with suppressed star formation. Moreover, the comparison between the top and bottom row in Fig.3 highlights the necessity of UV colours to select fair samples of transition galaxies: e.g., a simple colour-cut would significantly contaminate our sample with star-forming blue-sequence and quiescent red-sequence systems. Finally, it is interesting to note the wide range in colour spanned by the transition galaxies, suggesting different current star formation rates.
As shown in the following sections, the sample of transition galaxies selected using these criteria is not significantly contaminated either by active star-forming or quiescent galaxies erroneously classified as transition systems. Thus, in the rest of this paper we will refer to the colour interval 4.56 mag as the ‘transition region’.
Finally, it is worth reminding the reader that, in all the figures presented in this paper, the UV-near-infrared colour is directly related to the SSFR only outside the red sequence. For colours redder than 6 mag, UV magnitudes cannot be blindly used to quantify current SFRs and the presence of a sequence does not imply that all red galaxies have the same SSFR, as shown in the following sections.
4 The link between atomic hydrogen content and colour
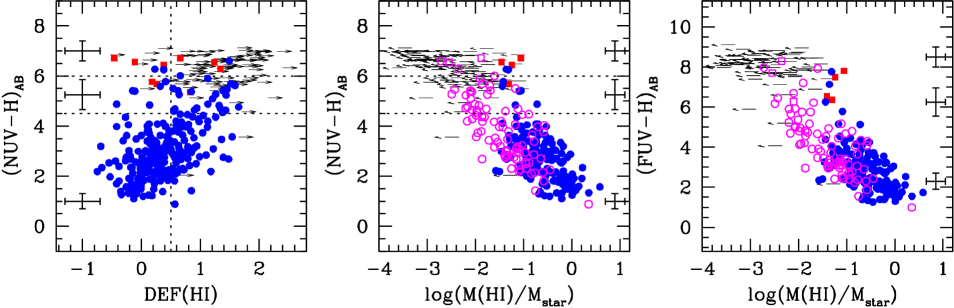
In HC09 we showed that late-type galaxies outside the blue cloud appear to have lost at least 70% of their atomic hydrogen content, when compared with isolated galaxies of similar size and morphology. We commented this result as a strong evidence of a physical relation between the loss of gas and quenching of the star formation. This interpretation is confirmed and reinforced in Fig. 4. The left panel shows the correlation between colour and \hi deficiency: galaxies outside the blue cloud have not only lost a significant fraction of their atomic hydrogen content, but we also find a correlation between \hi deficiency and colour, although with large scatter. At least part of the scatter is due to the large uncertainty in the estimate of \hi deficiency (0.3 dex). The same relation can be expressed in terms of gas-fraction (here defined as the ratio of the \hi to the stellar mass), as discussed by Kannappan (2004) and shown in the central and right panels of Fig. 4: lower gas-fractions correspond to redder colours. The best linear fit to the relation (excluding upper-limits) is =+0.19, with a dispersion of 0.43 dex. However, from the three panels in Fig. 4 it clearly emerges that not all transition region and red-sequence galaxies are \hi-deficient, but a number of systems have an amount of hydrogen typically observed in objects lying in the blue cloud. This is particularly interesting if we look at the colour-gas-fraction relations (central and right panels). Outside the blue cloud, galaxies lie mainly at the two edges of the relation depending on whether they are \hi-deficient (empty circles) or not and the colour-gas-fraction relation appears more scattered111The fact that, for the same colour, \hi-deficient objects have a lower gas fraction is expected, since both quantities trace the specific amount of atomic hydrogen in a galaxy.. This suggests that, for 4.5 mag, the gas-fraction is not a good proxy of the UV-optical colour anymore and vice-versa. The dispersion in the colour-gas-fraction relation increases from 0.35 dex (consistent with Kannappan 2004 and Zhang et al. 2009) to 0.54 dex when we move from \hi-normal blue-cloud galaxies to transition and red-sequence objects. This is in reality a lower-limit on the real scatter increase since upper-limits are not included in the calculation.
The results shown in Fig. 4 are strongly suggestive of a) a different evolutionary path followed by \hi-deficient and \hi-normal galaxies outside the blue cloud and b) of a weaker link between \hi-content and colour than the one typically observed in star-forming galaxies. Therefore, in order to gain additional insights on the evolution of galaxies in the transition region, in the following we divide transition galaxies into two families according to their gas content and investigate separately their properties.
Before investigating the detailed properties of transition galaxies, it is worth adding a few notes about the validity of the classification for \hi-normal transition systems. The low number of objects in this category and the large uncertainties in the estimate of gas fractions and UV dust attenuation might suggest that these are just random outliers, not different from the bulk of the \hi-deficient population. Although we cannot exclude the presence of a few misclassified galaxies in both the \hi-deficient and \hi-normal population, it is very unlikely that all (and only) the \hi-normal galaxies outside the blue sequence are affected by a large (0.5 dex) systematic underestimate of dust attenuation, and/or gas fraction. More importantly, the analysis presented in the next sections will clearly show that these two families have reached the transition region following different evolutionary paths.
5 The properties of transition galaxies
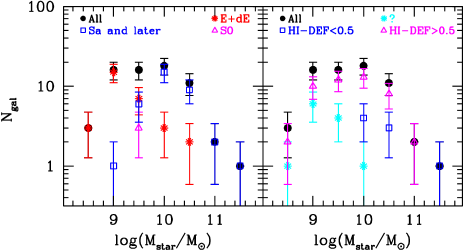
In total, 67 galaxies in our sample, corresponding to 17% in both number and total stellar-mass lie in the transition region as defined in § 3. In Fig. 5, we show the stellar-mass distribution of transition galaxies divided according to their morphological type (left panel) and gas content (right panel). For , galaxies with 4.56 mag are mainly spirals, whereas at lower stellar masses they are preferentially dwarf elliptical systems. More importantly, the majority of transition galaxies have 70% less atomic hydrogen content than isolated galaxies of similar optical size and morphological type. However, as already noted in HC09, not all galaxies in the transition region are \hi-deficient. For , 30% (8 galaxies) of the transition galaxies have \hi deficiency lower than 0.5. For lower stellar masses, it is difficult to quantify the number of gas-rich objects. \hi observations are not available for 9 of our galaxies and for 3 additional objects the lower limits obtained for the \hi deficiency are below our threshold of 0.5. These are mainly dE cluster galaxies (Fig. 5, left panel), suggesting that their evolution is related to the cluster environment (Boselli et al. 2008). However, to be conservative, in the following analysis we will focus our attention on the 55 galaxies for which the classification as \hi-deficient or \hi-normal galaxy is reliable.
5.1 \hi-deficient systems
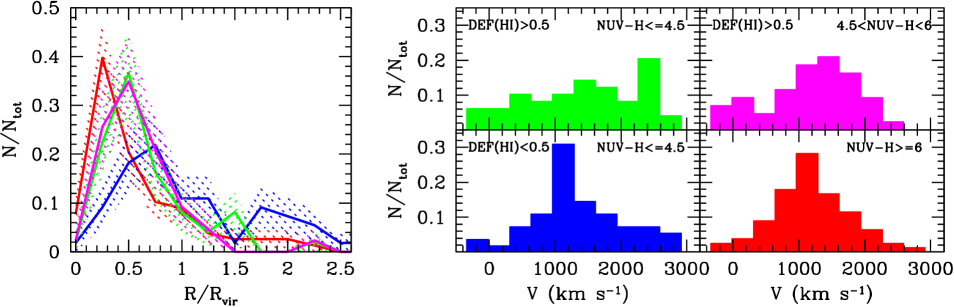
Overall, sure \hi-deficient galaxies represent 70% (47 galaxies) in number and 63% in stellar mass of the transition region222This fraction might increase up to 88% in case all galaxies without \hi measurement are \hi-deficient galaxies. We note, however, that these values may not be representative of the local universe, being our sample likely biased towards high-density environments (see § 6).. All except four galaxies lie in the Virgo cluster region (as defined in Gavazzi et al. 2003) suggesting that the cluster environment is playing an important role in quenching the star formation. Additional support to this scenario is obtained when we consider the properties of galaxies divided according to their gas content and their position in the colour-mass diagram. We compared the median projected distance from the cluster center of the different populations. Given the large asymmetry of Virgo and the presence of two main sub-clusters (Virgo A and Virgo B, at 1 virial radii projected-distance), for each galaxy we computed the projected-distance from the center of both clouds and adopted the smallest of the two values. Our results do not qualitatively change if just the distance from M87 is adopted. The median cluster-centric distance decreases from 0.83 virial radii (Rvir), in case of \hi-normal blue-cloud galaxies, to 0.51, 0.52 and 0.42 Rvir for \hi-deficient blue-cloud, \hi-deficient transition and red-sequence objects, respectively (see Fig. 6, left panel). Similarly, the difference between the 25th and 75th percentiles of the line-of-sight velocity distribution (i.e. a good estimate of the velocity dispersion in case of non gaussian distributions) increases in the blue cloud from 760 km s-1 to 1400 km s-1 when we consider \hi-normal and \hi-deficient galaxies respectively. Then, the typical velocity dispersion gradually decreases to 915 km s-1 and 610 km s-1 when we consider the transition region and the red sequence respectively (see Fig. 6, right panel). The gradual variation in projected distance and velocity distribution when moving in the colour magnitude diagram from blue, \hi normal systems to red, quiescent objects supports the idea that \hi-deficient galaxies represent a population of galaxies recently infalled into the cluster and not yet virialized. For example, a free-falling population is expected to have a velocity dispersion times larger than the virialized population. Moreover, the velocity dispersion profile for \hi-deficient galaxies decreases with cluster-centric distance consistent with isotropic velocities in the center and radial velocities in the external regions, as expected in the case of galaxy infall onto the cluster (Girardi et al. 1998; Cortese et al. 2004). The opposite trend (i.e., increasing with cluster-centric distance) is observed for red-sequence galaxies, as expected in a relaxed cluster undergoing two-body relaxation in the dense central region, with circular orbits in the center and more isotropic velocities in the external regions. Finally, a visual investigation of UV images reveals that in at least 50% of star-forming Virgo galaxies in the transition region the star formation is only present well within the optical radius, completing the collection of evidence supporting environmental effects behind the quenching of the star formation in \hi-deficient Virgo galaxies.
Less clear is the origin of the \hi deficiency in galaxies outside Virgo: 4 objects in total, namely NGC4684, UGC8756, UGC8032 and NGC5566. NGC5566 is the brightest member of a galaxy triplet while UGC8032 lies just 1.1 virial radii from the center of Virgo. Thus for these two galaxies it is still possible that environmental effects are playing a role in the gas stripping. The fact that UGC8032 is not included in our Virgo sample despite its small distance from M87 is due to the fact that it just lies outside the Virgo boundaries defined by Gavazzi et al. (2003). The origin of the \hi deficiency in NGC4684 and UGC8756 remains a puzzle. UGC8756 has in fact no nearby companions or any clear sign of interaction. NGC4684 is a lenticular galaxy with very strong UV nuclear emission, probably related to the extended H outflow discovered by Bettoni et al. (1993). The outflow has been interpreted as related to bar instability and it is not clear whether such process can be responsible for the \hi deficiency observed in this object. Thus, the origin of the \hi deficiency in these two objects still remains unclear.
5.1.1 Time-scales for the migration
Combining the observational evidence presented above with previous works on the Virgo cluster (e.g. Boselli & Gavazzi 2006 and references therein), we favor hydrodynamical interactions like ram-pressure as the main process responsible for the suppression of the star formation. However, we note that gravitational interactions cannot be excluded in at least one case (NGC4438, e.g., Kenney et al. 2008; Boselli et al. 2005a; Vollmer et al. 2005a).
Only recently, has it become possible to accurately quantify the time-scale for the quenching of the star formation after the stripping event (Boselli et al. 2006; Crowl & Kenney 2008). Luckily, almost all the objects for which a stripping time-scale has been computed are included in our sample. In Fig. 7, we highlight the position of these six objects in the colour-mass diagram according to the age of the stripping event: hexagons and triangles indicate galaxies in which the star formation in the outer regions has been suppressed less or more than 300 Myr, respectively. Interestingly, there is a difference in the average colour between very recent quenching (300 Myr) and older events, so that only galaxies with quenching time-scale 400-500 Myr are at the edge or have already reached the transition region. This is consistent with the fact that the Virgo transition galaxy population is not virialized, implying a recent ( 1.7 Gyr, i.e., the Virgo crossing time; Boselli & Gavazzi 2006) infall into the cluster center. Thus, we can conclude that once the \hi has been stripped from the disk, a galaxy moves from the blue cloud to the transition region in a time-scale roughly 0.5-1 Gyr.
It is more difficult to predict the future evolution of transition galaxies and in particular to estimate how long they will remain in the transition region and whether they will eventually join red-sequence galaxies. As already pointed out by Crowl & Kenney (2008) and Boselli et al. (2008), one cluster-crossing is not sufficient to completely halt the star formation in massive (Mstar1010 M⊙) galaxies. In fact, while the outer disk is completely deprived of its gas content and star formation is quickly stopped, in the central regions the restoring force is too strong, keeping the atomic hydrogen reservoir necessary to sustain continuos star formation. Moreover, Boselli et al. (2008) showed that two cluster crossings (2-3 Gyr) are already necessary to move the brightest dE from the blue to the red sequence, suggesting that the transition galaxies described here will take at least the same amount of time to have their star formation completely quenched. Assuming that the Gunn & Gott (1972) formalism for ram-pressure is still valid after the first passage and that the galaxy’s orbit does not change significantly, we can expect that very little additional gas will be stripped during the second passage by ram-pressure. Significant stripping would occur only if the galaxy’s restoring force is lowered by gravitational interactions with other members and the cluster potential well. Other intra-cluster medium related environmental effects, like viscous stripping (Nulsen 1982) and thermal evaporation (Cowie & Songaila 1977), may thus play an important role in the complete suppression of the star formation.
An upper limit to the time spent by \hi-deficient galaxies in the transition region can be obtained if we assume that all the remaining gas will be consumed by star formation. It is in fact plausible that the intra-cluster medium will prevent additional infall of cold gas. In this case, the ‘Roberts’ time’ (Roberts 1963, defined as the ratio of the gas mass to the current star formation rate: i.e., M(gas)/SFR) can be used to obtain a rough estimate of the gas consumption time. Assuming that 15% of the total gas is in the molecular state (Boselli et al. 2002) and 30% is composed by helium and heavy elements (Boselli et al. 2001), we find that the ‘Roberts’ time’ is already 2.2 Gyr333This value decreases by a factor 1.5 if a Salpeter IMF is adopted. This is in reality a lower limit to the real value since it does not take into account gas recycling. As shown by Kennicutt et al. (1994), the real gas consumption time is 1.5-4 times longer then the time scale calculated above. Thus, although they have lost a significant amount of their original gas content, \hi-deficient transition galaxies still have enough fuel to sustain star formation at the current rate for at least a couple of Gyr.
Detailed simulations focused on the effect of the cluster environment after the first passage will thus be extremely interesting to understand the future evolution of these systems. At this stage, the main conclusion we can draw from our analysis is that at least 3 Gyr seem to be necessary for the complete migration of a galaxy from the blue to the red sequence when gas stripping via the intra-cluster medium is involved.
| \hi-normal transition galaxies | ||||||||||||||
| NAME | TYPE | D | AGN | B-V | FUV | NUV | H | F60μm | F100μm | M(HI) | M(HI)/Mstar | C31(H) | Merging/Accretion? | Ref. |
| Mpc | mAB | mAB | mAB | Jy | Jy | 108 M⊙ | ||||||||
| NGC3619 | S0 | 20.7 | - | 0.86 | 16.86 | 16.14 | 7.40 | 0.43 | 1.61 | 7.08 | 0.04 | 6.2 | yes | 1,2 |
| NGC3898 | Sa | 15.7 | Lin | 0.79 | - | 15.03 | 6.25 | 0.42 | 2.02 | 26.9 | 0.09 | 3.1 | may be | 3 |
| NGC4324 | Sa | 17.0 | Lin/Sey | 0.87 | 16.62 | 15.99 | 7.29 | 0.45 | 1.96 | 6.76 | 0.05 | 3.5 | - | - |
| NGC4370 | Sa | 23.0 | NoL | 0.70 | - | 18.26 | 8.28 | 0.94 | 3.27 | 4.0 | 0.04 | 3.8 | yes | 4,5 |
| NGC4378 | Sa | 17.0 | Sey | 0.81 | 16.00 | 15.50 | 7.23 | 0.36 | 1.45 | 10.0 | 0.07 | 4.9 | - | - |
| NGC4772 | Sa | 17.0 | Lin | 0.87 | 17.07 | 16.16 | 7.12 | 0.38 | 1.32 | 6.17 | 0.04 | 5.1 | yes | 6 |
| NGC5701 | Sa | 20.1 | Lin | 0.84 | 15.48 | 15.11 | 6.74 | 0.27 | 1.36 | 61.7 | 0.20 | 4.0 | - | - |
| \hi-normal red-sequence galaxies | ||||||||||||||
| NAME | TYPE | D | AGN | B-V | FUV | NUV | H | F60μm | F100μm | M(HI) | M(HI)/Mstar | C31(H) | Merging/Accretion? | Ref. |
| Mpc | mAB | mAB | mAB | Jy | Jy | 108 M⊙ | ||||||||
| NGC4203 | S0 | 17.0 | Lin. | 0.99 | 16.94 | 15.87 | 6.26 | 0.59 | 2.16 | 33.1 | 0.09 | 6.8 | yes | 7 |
| NGC4262a | S0 | 17.0 | NoL | 0.83 | - | 16.9 | 7.20 | - | 0.50 | 5.13 | 0.04 | 6.0 | yes | 8 |
| NGC4698a | Sa | 17.0 | Sey | 0.83 | 16.64 | 15.71 | 6.16 | 0.63 | 1.89 | 17.0 | 0.04 | 4.2 | yes | 9 |
| NGC4866 | S0 | 17.0 | Lin | 0.96 | 17.26 | 16.27 | 6.76 | - | - | 13.5 | 0.06 | 3.7 | - | - |
| NGC5103 | Sab | 17.0 | - | - | 19.49 | 17.76 | 8.29 | - | - | 2.40 | 0.05 | 6.3 | - | - |
a UV fluxes increase significantly if the UV rings outside the optical radius are included.
5.2 \hi-normal galaxies
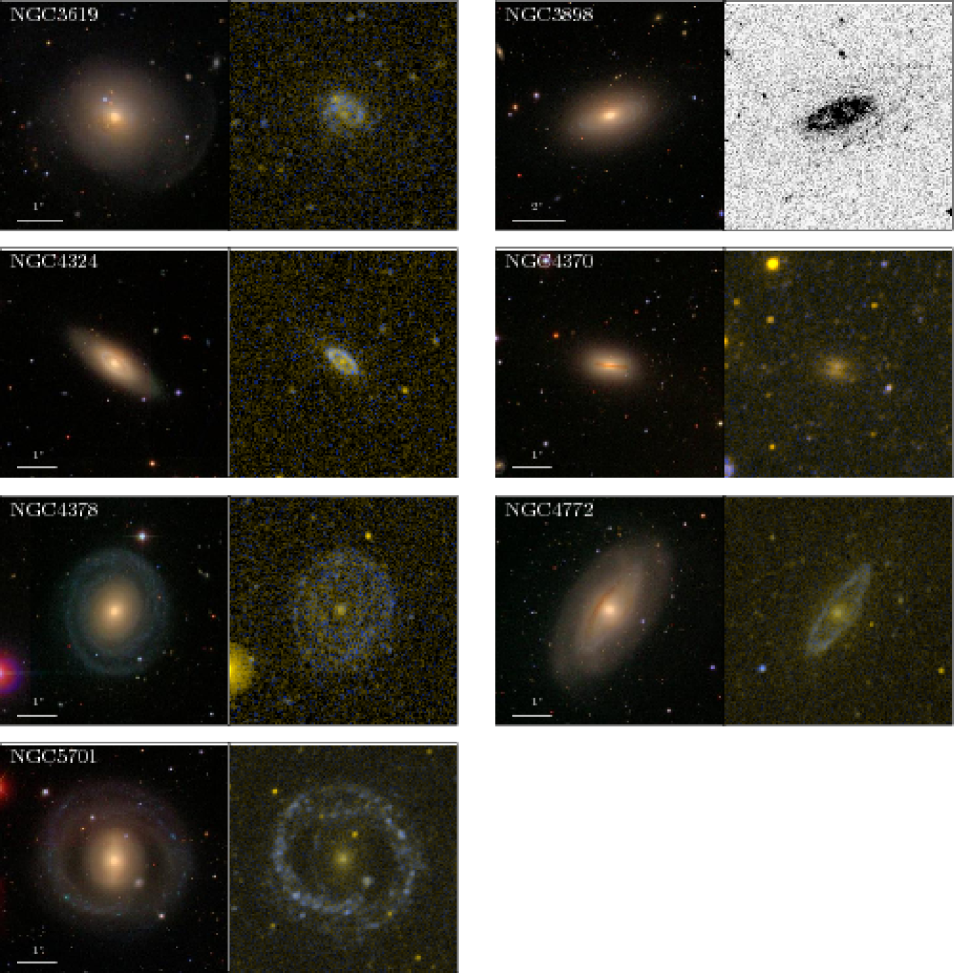
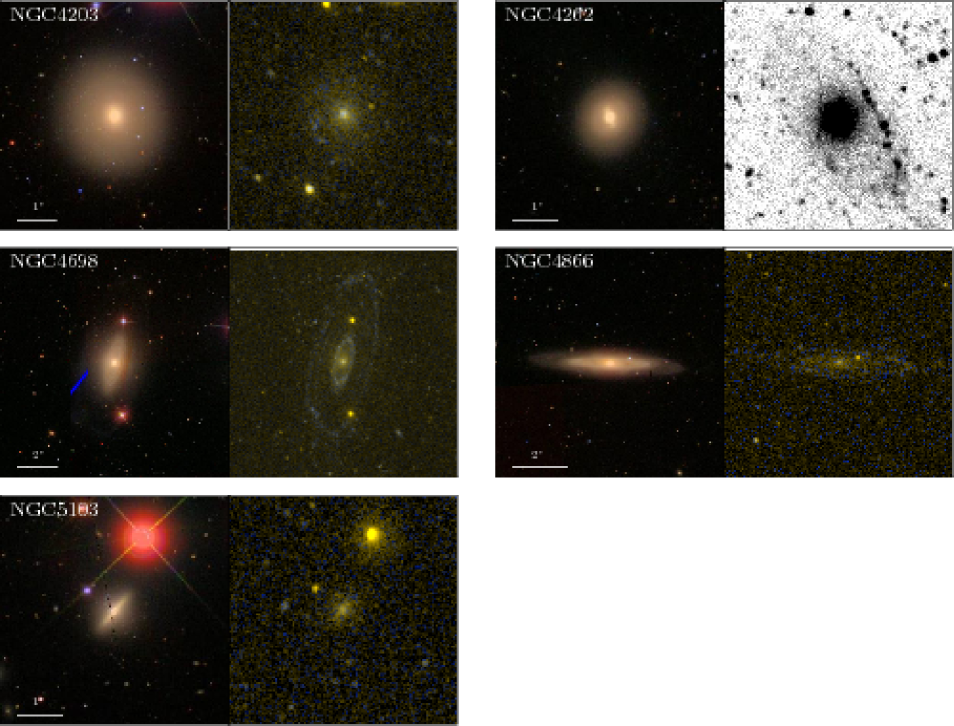
Contrary to \hi-deficient objects, sure \hi-normal transition galaxies are equally distributed between the field and cluster environments. They are 12 % in number444This fraction might increase up to 30% in case all galaxies without \hi measurement are \hi-normal galaxies. (8 objects in total) and 34% in stellar mass of the whole transition galaxy population in our sample. We note that NGC4565 is the only example of perfectly edge-on transition object, in this case we cannot exclude that the corrections adopted still underestimate the real UV extinction (Panuzzo et al. 2003) making this galaxy possibly an erroneous transition object. Therefore, we will exclude NGC4565 from the following analysis. The properties of the remaining 7 objects are listed in Table 1 as follows: Col. 1: Name. Col.2: Morphological type. Col. 3: Distance in Mpc. Col.4 AGN classification (following the criteria described in Decarli et al. 2007): Lin=LINER, Sey=Seyfert, NoL= No emission lines. Col.5: colour corrected for dust extinction. Col.6-8: FUV, NUV and H AB magnitudes. Col.9-10: IRAS fluxes at 60 and 100 . Col. 11: HI mass. Col. 12: \hi- to stellar-mass ratio. Col. 13: concentration index in H band taken from 2MASS ( defined as the ratio between the radii containing 75% and 25% of the total H-band light). Col. 14-15: Note regarding any evidence (and relative reference) supporting an external origin for the \hi. In Fig. 8, we show SDSS optical and GALEX UV colour images for each galaxy. In Appendix A, we describe the properties of each object in order to investigate the possible origins for the normal \hi content and low SSFR. From this analysis, it emerges that \hi-normal transition galaxies are a heterogeneous class of objects going from merger remnants (e.g., NGC3619) with star-formation activity limited to the center, to satellites of big ellipticals (NGC4370), with no evident signs of recent star formation. Contrary to the \hi-deficient family, gas stripping by environmental effect seems not to be playing any role in their recent evolution. As expected in the case of massive ( M⊙) galaxies, the majority of these objects host an ‘optical’ AGN. More surprisingly, our analysis shows that, although they have likely followed different evolutionary paths, a significant fraction of galaxies (at least 4 out of 7) has recent star formation mainly in form of one or more UV rings. As shown in Fig. 8, the UV rings have different morphologies going from inner rings (NGC3898, NGC4324, NGC4772) to Hoag-like objects (NGC5701). Resolved \hi maps, available for two of our objects (NGC3898, NGC4772), reveal that the \hi is distributed in extended low surface density disks, exceeding significantly the typical column density of 1-2 M⊙ pc-2 only in correspondence of the star forming rings. Thus, in these cases, star formation is reduced not because the \hi has been stripped but just because the gas is not able to collapse into stars efficiently. This is likely due to the fact that the gas reservoir has a typical column density well below the critical density necessary to convert \hi into molecular hydrogen and onset the star formation (Krumholz et al. 2009).
The presence of UV rings becomes more intriguing when \hi-normal galaxies in the ‘NUV red sequence’ are also taken into account (5 galaxies in total, see Table 1, Fig. 9 and Appendix A for a description of these objects). The four galaxies with clear star formation activity (NGC4203, NGC4262, NGC4698, NGC4866) have star-forming regions mainly arranged in structures which are suggestive of one or multiple rings (see Fig. 9). In the case of NGC4203 and NGC4698, \hi maps reveal a morphology similar to the one observed in \hi-normal transition objects with extended low surface density \hi disks and peaks of column density in correspondence of UV star-forming regions. The only known exception is represented by NGC4262, where the \hi is mainly segregated in the UV star forming ring. Interestingly, NGC4262 and NGC4698 could be immediately reclassified as transition region galaxies if the outer UV rings are included in the estimate of the UV flux. All this observational evidence strongly suggests that the evolutionary paths leading these objects to the transition region have been significantly different from the one followed by \hi-deficient galaxies.
5.2.1 Past and future evolution in the colour-mass diagram
The main piece of information necessary to understand the recent evolutionary history of these unusual ‘gas-rich’ systems, is the origin of their gas reservoir. Has the gas an external origin (e.g, accretion, infall, merging, shells, etc.) or was it always part of the galactic halo but has not been efficiently converted into stars? The origin of the gas can in fact not only provide clues on the past history of these objects (i.e., whether they are really migrating from the blue to the red sequence) but also may help in predicting their future evolution in the colour-mass diagram. In the following, we combine the information available for HI-normal transition and red sequence galaxies to determine whether these systems have recently left the blue sequence after a quenching episode or are migrating back from the red sequence to the transition region thanks to a recent accretion event.
As discussed in Appendix A, many galaxies in our sample show direct or indirect evidence of past gas accretion/infall events (e.g, warps, counter-rotating or decoupled components, stellar shells). Among the best candidates for an external origin of all the \hi observed, there are NGC4262 and NGC4203 in the red sequence and NGC3619 in the transition region (van Driel & van Woerden 1991). However, it is interesting to note that the acquisition mechanisms (and therefore the evolution) of the three systems is likely to be different. In the case of NGC3619, we are likely witnessing a minor merger with a gas-rich satellite. The \hi is segregated well within the optical radius, roughly coinciding with the star forming disk observed in UV, suggesting that a satellite has sunk into the center initiating an episode of star formation. Given that the stellar populations have ages and metallicities typical of unperturbed ellipticals (Howell 2006), the most plausible scenario is that NGC3619 has left the red sequence after the merging event. Interestingly, at the current SFR (0.1 M⊙ yr-1), the amount of atomic hydrogen present within the optical disk (7108 M⊙) is sufficient to sustain the star formation for several billion years. Thus, NGC3619 will either remain in the transition region for a long time or, in case of a significant increase of the SFR, may be able to temporarily rejoin the blue cloud in a UV-near-infrared colour magnitude diagram. A similar evolutionary path could also have been followed by the dust-lane early-type NGC4370. However, the lack of detailed \hi maps prevent us from drawing any conclusion.
On the contrary, the infall of \hi into NGC4203 and NGC4262 has likely followed less ‘violent’ paths. In NGC4262, the presence of a ring composed only of \hi and newly formed stars is strongly suggestive of recent accretion, apparently ruling out that the ring has been formed from galactic material through bar instability. An interesting possibility is that the bar could still be responsible for the peculiar configuration of the \hi, preventing the newly accreted gas to collapse into the center. What remains unclear is whether the gas in the ring has been accreted from the intergalactic medium (as proposed in the case of polar ring galaxies; e.g., Macciò et al. 2006) or during an interaction with another galaxy (Vollmer et al. 2005b). As for NGC3619, the gas reservoir in the ring is sufficient to keep the galaxy in the transition region for several Gyr or to move it back to the blue cloud, building-up a new stellar disk/ring. To this regard, it is tempting to consider NGC4262 the ancestor of Hoag-type objects like NGC5701, thus implying that these two systems may be on their way back to the UV blue cloud. However, at this stage it is impossible to determine whether these two systems are at different stages of the same evolutionary path.
A migration back to the transition region appears instead very unlikely in the case of NGC4203. Despite its huge \hi reservoir, this galaxy shows only weak traces of recent star formation activity and at this rate the integrated colour will not be significantly affected, leaving this object in the red sequence. A similar scenario could also be valid for NGC5107 and NGC4886 which already are in the red sequence. However, additional observations are required to unveil the evolutionary history of these systems.
In summary, for at least a few cases, observations seem to suggest that \hi-normal red galaxies
have recently acquired atomic hydrogen and have started a new cycle of star formation activity leaving,
at least temporarily, the red sequence.
For other transition galaxies, this scenario appears extremely unlikely. This is particularly the case of NGC3898, NGC4772 and NGC4698. These three systems have very similar properties: i.e., Sa/Sab type with a significant bulge component (bulge-to-total ratio 0.2-0.4; Drory & Fisher 2007), \hi mainly distributed in two rings, one inside and one outside the optical radius, corresponding to the sites of recent star formation activity. HST images reveal that all three galaxies harbor a classical bulge (Drory & Fisher 2007), consistent with a ‘violent’ and quick bulge formation in the past through mergers or clump coalescence in primordial disks (e.g., Noguchi 1999; Kormendy & Kennicutt 2004; Elmegreen et al. 2008). In addition, the presence of a decoupled core (NGC4698) or a counter-rotating gas disk (NGC4772) is suggestive of a more recent accretion event (e.g., minor merger) supporting an external origin for at least part of the \hi in these objects. The preferred explanation for the properties of NGC4698 is in fact a later formation of the disk through the acquisition of material by a completely formed spheroid. Thus, it would be natural to argue that we are witnessing the build-up of the disk and that these galaxies are gradually moving from the red to the blue cloud, following a path consistent with what expected by hierarchical models (Baugh et al. 1996; Kauffmann 1996). However, a rough time-scale argument rules out this hypothesis. All three galaxies harbor massive stellar disks (M1-31010 M⊙ depending on the mass-to-light ratio difference between bulge and disk) and a SFR of 0.7-2 M⊙ yr-1 during the last Hubble time is thus necessary to form the observed disks. These SFRs are more typical of blue-cloud galaxies and a factor 10 larger than the SFR observed in these systems (0.07-0.2 M⊙ yr-1). While minor mergers have probably affected these systems, we can exclude that a great part of the stellar disk is composed of ‘accreted stars’, since the whole stellar component of the satellite is supposed to collapse into the center, contributing to the growth of the bulge (Hopkins et al. 2009). Although the uncertainties in the estimate of stellar masses and SFR are still quite significant, the large discrepancy between the observed and expected SFR suggests that the existing stellar disks are too massive to have been formed at the current SFR. Of course, we cannot exclude multiple transitions from the blue to the red sequence and vice-versa (Birnboim et al. 2007), but given the low amount of observational constraints available, we prefer not to include such scenario in our analysis. We thus propose that the SFR in the disks was higher in the past or, in other words, that these galaxies have probably migrated from the blue cloud. A reduction in the SFR is likely due to the low \hi column density in these systems: on average below the threshold for the onset of star formation. What caused this reduction is still unclear and only more detailed theoretical models and simulations will help us to solve this mystery. The same mechanism is probably behind the ring-like structures observed in both \hi and UV. Both internal (e.g, bar instability) or external (e.g. accretion, merging) processes can be responsible for such features. However the absence of strong bars, the presence of decoupled/counter rotating components and the size-ratio of the inner and outer rings (3.3-3.6, i.e. different from the typical value expected for Lindblad resonances 2.2, although not completely inconsistent; Athanassoula et al. 1982; Buta 1995), favour an external mechanism behind the unusual properties of these systems. Since all these galaxies harbour an AGN, it is natural to think about AGN-feedback. However, these are generally low-energetic AGNs and no direct evidence (e.g., jets) supporting this scenario has been found so far. Moreover, it is not clear how star-forming rings and low surface density \hi disks can be formed via AGN-feedback.
Finally, it is important to note that, whatever the past evolutionary history of these systems, the hydrogen reservoir available can sustain the current star formation activity in these galaxies for at least 2-5 Gyrs (ignoring molecular hydrogen, helium and recycling). Thus, if star formation will remain as efficient as it is now, it will take a long time for these galaxies to reach the red sequence in a UV-optical/near-infrared colour-mass diagram.
Unfortunately, no speculation can be made about the past evolutionary history of NGC4324 and NGC4378 given the lack of multiwavelength observations.
6 Discussion
Our analysis provides definitive evidence that galaxies in the transition region of the colour-mass diagram are a heterogeneous population. This result strongly suggests that galaxies lying between the blue and red sequence have followed different evolutionary paths, not always going towards redder colours.
We remind the reader that the difference in number density between \hi-deficient and \hi-normal transition galaxies must be taken with a grain of salt. Although our sample is magnitude- and volume-limited, it might be biased towards high-density environments. Nearly half of the galaxies in our sample lies in fact within the Virgo cluster, which might not be a fair representation of the local universe.
Interestingly, external (i.e., environmental) mechanisms are almost always behind the peculiar properties of transition galaxies, both \hi-deficient and \hi-normal objects. Although the majority of high-mass (1010 M⊙) transition galaxies harbour an AGN, feedback from accreting super-massive black holes appears not to be necessary to explain their properties. As discussed in HC09, the presence of AGNs in transition galaxies does not automatically imply a physical link between nuclear activity and quenching. Moreover, we do not find any direct observational evidence (e.g., jets, radio lobes, etc.) supporting an interaction between the central black hole and the galaxy’s gas reservoir.
6.1 The migration to the red sequence of \hi-deficient galaxies
-deficient transition galaxies constitute the majority of the transition population in our sample. By extending the analysis presented in HC09, we have shown that these galaxies not only are mainly found in the Virgo cluster but they also are the only population which is clearly migrating from the blue towards the red sequence. While environmental effects are certainly able to strip the gas from the disk, reducing the star formation in just a few hundreds million years and forcing the galaxy to leave the blue cloud, less clear is the last leg of the journey, i.e. the migration from the transition region to the red sequence. The complete suppression of the star formation requires at least a few billion years. This ‘two-step’ migration is more dramatic, and perhaps only visible, in a UV-near-infrared colour-mass diagram whereas in optical the first stripping event is sufficient to make the colours almost as red as an early-type galaxy.
At this stage, it is very tempting to use our data to quantify the current ‘migration’ rate and, consequently, the mass accretion rate of the red sequence. Unfortunately, the large uncertainties in both observables and on the typical time-scale of the migration (at least a factor 2) make this exercise not very useful. For example, a quenching time of 3 Gyr would suggest that, at the current rate, the red sequence in our sample could have been built by the migration of objects from the blue cloud in a Hubble time, consistent with previous works (e.g., Arnouts et al. 2007; Martin et al. 2007b; Schiminovich et al. 2007). However, at the same time, we are not able to reject scenarii in which either the observed rate is able to build-up the red sequence in half a Hubble time or the observed migration is not able to explain the growth of the quiescent galaxy population in the last 13 Gyr. Thus, no additional constraints on the evolution of the colour-stellar mass diagram are imposed by the estimate of the stellar mass accretion rate observed in our sample.
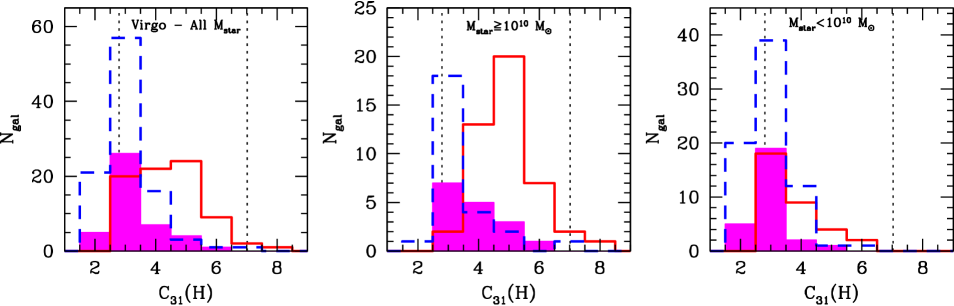
A more interesting exercise is to look for any morphological transformation during the migration towards the red sequence. The crucial question here is whether the red sequence is fed with bulge dominated or disk galaxies. The answer is clear from Fig. 10, where we compare the distribution of the concentration index in H-band for galaxies in the Virgo cluster. In the transition region, we show only Virgo \hi-deficient galaxies. Overall (Fig. 10, left panel), \hi-deficient transition galaxies have a concentration index much more similar to blue than red-sequence systems. However, such difference is only evident at stellar masses higher than 1010 Mstar (Fig. 10, central panel) whereas for smaller galaxies (right panel) the distribution of does not significantly vary across the whole range of colours, reflecting the fact that dwarf ellipticals have exponential light profiles like dwarf irregulars (e.g.,Binggeli & Cameron 1991). This result implies that, while \hi-deficient transition galaxies are likely the progenitors of cluster low-mass red objects (see also Haines et al. 2008; Boselli et al. 2008), this is not completely true at high stellar masses. This is additionally supported by the fact that the vast majority of high-mass transition galaxies are early-type spirals and almost no ellipticals are present (Fig 2 and 5). The vast majority of galaxies in the process of reaching the red sequence are thus disk systems, significantly different from ellipticals or bulge-dominated galaxies characterizing high-mass, quiescent objects at low redshift.
Since a significant fraction of \hi-deficient transition galaxies appears to have recently infalled into the center of Virgo and will likely spend a few Gyr in the transition region (see § 5.1), it may be possible that a morphological transformation still takes place before reaching the red sequence. Although we cannot completely exclude this scenario, we consider it unlikely. Given the long time required to halt the star formation, galaxies with increased bulge component should be present in our sample. Moreover, since gas stripping appears not to significantly increase the bulge component in early type galaxies (e.g., Boselli et al. 2006), an additional environmental effect (different from the one responsible for the quenching of the star formation) must be invoked.
Thus, the fact that transition galaxies are not morphologically transformed before reaching the red sequence may have two different implications: either 1) galaxies are morphologically transformed once already in the red sequence, or 2) the mechanism controlling the accretion of stellar mass into the red sequence at 0 is not the one responsible for the creation of the red sequence in the first place. Although it is possible that the bulge component is enhanced in some red galaxies via gravitational interactions, such scenario seems unlikely to explain the growth of the red sequence. Firstly, the mechanism responsible for the morphological transformation should be efficient only on giants and not on dwarf systems, which seems inconsistent with what known about environmental effects (Boselli & Gavazzi 2006). Secondly, the major mergers required to significantly increase the bulge component are extremely rare in today’s clusters of galaxies. Thirdly, the presence of red-sequence galaxies in isolation (e.g., HC09) implies that star formation has been suppressed also outside clusters of galaxies. Although our sample could be biased against isolated objects, the fact that we do not find a field population which is clearly migrating from the blue sequence may suggest that in low density environments the red sequence has been mainly populated in the past. Finally, if the morphological transformation takes place in the red sequence, the number of bulge-dominated/elliptical galaxies should decrease at increasing redshift, which does not seem to be the case (Postman et al. 2005; Desai et al. 2007). Thus, the most favourite scenario emerging from our analysis is that the red sequence is currently accreting mass, at all masses, mainly via disk galaxies. No significant structural modification takes place during the journey from the blue cloud to the red sequence. The main process responsible for the suppression of the star formation in nearby galaxies is thus not the same responsible for the formation of the red sequence at high redshift.
6.2 The \hi-normal side of the transition region
While in the case of \hi-deficient objects it seems plausible to associate transition galaxies with objects that are migrating from the blue to red sequence, this is not always the case for \hi-normal transition galaxies. The discovery of such systems is probably the most exciting result of this work. They represents 12% of our transition galaxy population, and are only found at high stellar masses (1010 Mstar).
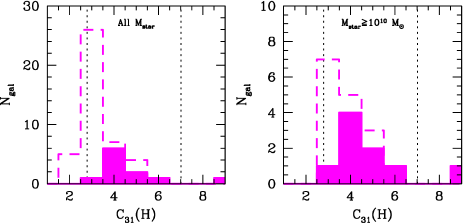
As shown in Fig. 11, these galaxies are mainly disks with a significant bulge component (they are in fact all Sa or S0 galaxies) and, despite the low number statistics, it seems clear that, , contrary to the \hi-deficient population, in this family we find very few ‘disk-only’ galaxies. Despite their different properties, a great fraction of these galaxies show active star-forming regions and \hi segregated in one or multiple ring-like structures. The picture emerging from our analysis is quite complex and exciting at the same time, showing that the transition region can be fed with galaxies from both sequences.
Red sequence galaxies can acquire new gas supply and restart their star formation activity, as predicted by cosmological simulations. However, it is unlikely that the red galaxies in our sample will re-build a significant stellar disk (see also Hau et al. 2008). Merging, accretion of gas-rich satellites and exchange of material during close encounters are among the likely responsible for this rejuvenation. Such processes are more frequent in low density environments, where red-sequence galaxies are rarer, perhaps reducing the chances to observe such phenomenon.
When a suppression of the star formation is the most likely scenario to explain \hi-normal transition galaxies, the process behind such migration is still unclear. In this case, star formation must be reduced by making the \hi stable against fragmentation (e.g., by decreasing the \hi column density below the threshold for star formation) and not via \hi stripping as observed in \hi-deficient objects. Starvation (Larson et al. 1980) by removing any extended gaseous halo surrounding the galaxy, preventing further infall, could be a possibility. This would imply a longer time-scale (several Gyr) for the migration from the blue cloud (Boselli et al. 2006, 2008) than the one observed in the case of \hi stripping (a few hundreds million years). However, the evidence for accretion/interaction in some of these objects may suggest that starvation, if efficient, is not the only mechanism at work.
Martig et al. (2009) have recently proposed a ‘morphological quenching’ to explain the origin of gas-rich bulge-dominated objects. The idea behind this mechanism is that the presence of a bulge could inhibit the collapse of a gas disk. However, the ‘morphological quenching’ appears only to be effective when the disk stellar component is negligible, which is not the case for the majority of the systems in our sample.
Finally, the fact that the majority of these objects show some level of nuclear activity, might indicate a link between AGN activity and their position in the colour stellar mass diagram. However, although we cannot exclude that recent accretion events may have triggered the AGN, we do not find any direct observational evidence suggesting that AGN-feedback is playing a significant role in the recent star formation history of these objects (see also HC09).
Thus, the past evolutionary history of \hi-normal transition galaxies has still to be unravelled. Whatever is the path followed to get to the transition region, \hi-normal systems currently have enough fuel to sustain star formation at the current rate for almost another Hubble time. This is an unexpected result, implying that such systems could remain in the transition region for a very long time and that the colour range 4.56 mag does not automatically correspond to a snapshot in the star formation history of nearby galaxies.
7 Summary & Conclusion
In this paper, we have combined UV, \hi and near-infrared observations to investigate
the properties of local transition galaxies.
Our main results are as follows.
i) We confirm that the reddening of the galaxy colour is accompanied by a decrease in the
\hi gas-fraction. However we show that, while in the blue cloud colour and gas-fraction
are tightly correlated, in the transition region and red sequence such correlation is more
scattered. Transition region galaxies can thus be divided into two main families according to
their \hi-content.
ii) \hi-deficient transition objects reside in high-density environments and environmental
effects are the likely cause for the loss of gas. Star formation is rapidly suppressed after the gas
stripping and the transition region is reached in less than a billion years.
However, once in the transition region, massive galaxies are still forming stars
and will not immediately reach the red sequence. A subsequent quenching is thus required to
reach the red sequence, implying that the total migration time-scale is, at least, a few billion
years.
iii) Although \hi-deficient galaxies represents the bulk of the migrating population
in our sample, they are apparently not responsible for the formation of the red sequence in the first place.
The gas stripping is in fact ‘polluting’ the red sequence mainly with disk galaxies and no morphological
transformation is observed during the quenching of the star formation.
iv) Contrary to \hi-deficient systems, \hi-normal transition galaxies (12% of the whole transition
population in our sample) represent an heterogeneous population
of objects, at least two of which are probably following the inverse path, migrating back from the red sequence.
The high hydrogen content in these systems is, at least in some cases, due to external
accretion/interaction events. The detailed evolution of these objects is still unclear, but it is likely
that they will remain in the transition region for several billion years. Thus, a connection
between transition region and migration from the blue to the red sequence may not always be true.
The discovery of a \hi-normal population in the transition region has only been possible thanks to the combination of UV imaging (necessary to properly separate blue and red sequence at all masses) and \hi single-dish observations (to quantify the atomic hydrogen content). The results here presented have inevitably lead to several questions we have not been able to answer in the current work. Is accretion really playing a crucial role in the evolution of these objects? Which mechanism suppressed star formation without removing the gas? How frequent are such objects? etc. To be able to answer these questions, both detailed theoretical and observational studies of individual objects and statistical investigations of larger samples are mandatory. Luckily, we are currently in an exciting time for UV and 21 cm astronomy. Particularly promising for this topic is the GALEX Arecibo SDSS Survey (GASS, Catinella et al. 2008b) which is currently making a census of the \hi content in a complete sample of 1000 massive galaxies (1010 M⊙), ideal to investigate the role of gas and accretion on the evolution of transition galaxies. Thus, we are probably not too far from being able to unravel some of the mysteries still surrounding \hi-normal galaxies in the transition region.
Acknowledgments
We are greatly indebted to Alessandro Boselli for his support and encouragement in carrying out this analysis and for providing part of the data before publication. We wish to thank Alessandro Boselli, Barbara Catinella, Jonathan Davies and Rory Smith for useful discussions and helpful comments on the manuscript. We thank the anonymous referee for useful comments which helped to improve this paper. LC thanks the hospitality of the Max Planck Institute for Astrophysics where part of this paper was written. LC and TMH are supported by the UK Science and Technology Facilities Council.
This publication makes use of data products from the Two Micron All Sky Survey, which is a joint project of the University of Massachusetts and the Infrared Processing and Analysis Center/California Institute of Technology, funded by the National Aeronautics and Space Administration and the National Science Foundation, from the GALEX mission, developed in cooperation with the Centre National d’Etudes Spatiales of France and the Korean Ministry of Science and Technology, from the NASA/IPAC Extragalactic Database (NED) which is operated by the Jet Propulsion Laboratory, California Institute of Technology, under contract with the National Aeronautics and Space Administration and from the GOLDMine data base.
This research has made extensive use of NASA’s Astrophysics Data System and of the astro-ph preprint aechive at http://arXiv.org.
References
- Arnouts et al. (2007) Arnouts, S., Walcher, C. J., Le Fèvre, O., et al. 2007, A&A, 476, 137
- Athanassoula et al. (1982) Athanassoula, E., Bosma, A., Creze, M., & Schwarz, M. P. 1982, A&A, 107, 101
- Baldry et al. (2004) Baldry, I. K., Glazebrook, K., Brinkmann, J., et al. 2004, ApJ, 600, 681
- Baugh et al. (1996) Baugh, C. M., Cole, S., & Frenk, C. S. 1996, MNRAS, 283, 1361
- Bell et al. (2003) Bell, E. F., McIntosh, D. H., Katz, N., & Weinberg, M. D. 2003, ApJS, 149, 289
- Bell et al. (2007) Bell, E. F., Zheng, X. Z., Papovich, C., et al. 2007, ApJ, 663, 834
- Bertola et al. (1988) Bertola, F., Buson, L. M., & Zeilinger, W. W. 1988, Nature, 335, 705
- Bertola et al. (1999) Bertola, F., Corsini, E. M., Vega Beltrán, J. C., et al. 1999, ApJL, 519, L127
- Bettoni et al. (1993) Bettoni, D., Galletta, G., & Sage, L. J. 1993, A&A, 280, 121
- Binggeli & Cameron (1991) Binggeli, B. & Cameron, L. M. 1991, A&A, 252, 27
- Binggeli et al. (1985) Binggeli, B., Sandage, A., & Tammann, G. A. 1985, AJ, 90, 1681
- Birnboim et al. (2007) Birnboim, Y., Dekel, A., & Neistein, E. 2007, MNRAS, 380, 339
- Blanton (2006) Blanton, M. R. 2006, ApJ, 648, 268
- Borch et al. (2006) Borch, A., Meisenheimer, K., Bell, E. F., et al. 2006, A&A, 453, 869
- Boselli et al. (2008) Boselli, A., Boissier, S., Cortese, L., & Gavazzi, G. 2008, ApJ, 674, 742
- Boselli et al. (2005a) Boselli, A., Boissier, S., Cortese, L., et al. 2005a, ApJL, 623, L13
- Boselli et al. (2006) Boselli, A., Boissier, S., Cortese, L., et al. 2006, ApJ, 651, 811
- Boselli et al. (2005b) Boselli, A., Cortese, L., Deharveng, J. M., et al. 2005b, ApJ, 629, L29
- Boselli & Gavazzi (2006) Boselli, A. & Gavazzi, G. 2006, PASP, 118, 517
- Boselli et al. (2001) Boselli, A., Gavazzi, G., Donas, J., & Scodeggio, M. 2001, AJ, 121, 753
- Boselli et al. (2002) Boselli, A., Lequeux, J., & Gavazzi, G. 2002, A&A, 384, 33
- Brosch (1985) Brosch, N. 1985, A&A, 153, 199
- Brown et al. (2007) Brown, M. J. I., Dey, A., Jannuzi, B. T., et al. 2007, ApJ, 654, 858
- Bruzual & Charlot (2003) Bruzual, G. & Charlot, S. 2003, MNRAS, 344, 1000
- Buat et al. (2008) Buat, V., Boissier, S., Burgarella, D., et al. 2008, A&A, 483, 107
- Buta (1995) Buta, R. 1995, ApJS, 96, 39
- Byrd et al. (1994a) Byrd, G., Freeman, T., & Howard, S. 1994a, AJ, 108, 2078
- Byrd et al. (1994b) Byrd, G., Rautiainen, P., Salo, H., Buta, R., & Crocher, D. A. 1994b, AJ, 108, 476
- Catinella et al. (2008a) Catinella, B., Haynes, M. P., Giovanelli, R., Gardner, J. P., & Connolly, A. J. 2008a, ApJL, 685, L13
- Catinella et al. (2008b) Catinella, B., Schiminovich, D., & Kauffmann, G. 2008b, in American Institute of Physics Conference Series, Vol. 1035, The Evolution of Galaxies Through the Neutral Hydrogen Window, ed. R. Minchin & E. Momjian, 252–255
- Cimatti et al. (2006) Cimatti, A., Daddi, E., & Renzini, A. 2006, A&A, 453, L29
- Conroy et al. (2009) Conroy, C., Gunn, J. E., & White, M. 2009, ApJ, 699, 486
- Cortese et al. (2006) Cortese, L., Boselli, A., Buat, V., et al. 2006, ApJ, 637, 242
- Cortese et al. (2008a) Cortese, L., Boselli, A., Franzetti, P., et al. 2008a, MNRAS, 386, 1157
- Cortese et al. (2004) Cortese, L., Gavazzi, G., Boselli, A., Iglesias-Paramo, J., & Carrasco, L. 2004, A&A, 425, 429
- Cortese et al. (2008b) Cortese, L., Minchin, R. F., Auld, R. R., et al. 2008b, MNRAS, 383, 1519
- Cowie & Barger (2008) Cowie, L. L. & Barger, A. J. 2008, ApJ, 686, 72
- Cowie & Songaila (1977) Cowie, L. L. & Songaila, A. 1977, Nature, 266, 501
- Crowl & Kenney (2008) Crowl, H. H. & Kenney, J. D. P. 2008, AJ, 136, 1623
- Decarli et al. (2007) Decarli, R., Gavazzi, G., Arosio, I., et al. 2007, MNRAS, 381, 136
- Dekel & Birnboim (2006) Dekel, A. & Birnboim, Y. 2006, MNRAS, 368, 2
- Desai et al. (2007) Desai, V., Dalcanton, J. J., Aragón-Salamanca, A., et al. 2007, ApJ, 660, 1151
- Driver et al. (2006) Driver, S. P., Allen, P. D., Graham, A. W., et al. 2006, MNRAS, 368, 414
- Driver et al. (2007a) Driver, S. P., Allen, P. D., Liske, J., & Graham, A. W. 2007a, ApJL, 657, L85
- Driver et al. (2007b) Driver, S. P., Popescu, C. C., Tuffs, R. J., et al. 2007b, MNRAS, 379, 1022
- Drory & Fisher (2007) Drory, N. & Fisher, D. B. 2007, ApJ, 664, 640
- Duprie & Schneider (1996) Duprie, K. & Schneider, S. E. 1996, AJ, 112, 937
- Elmegreen et al. (2008) Elmegreen, B. G., Bournaud, F., & Elmegreen, D. M. 2008, ApJ, 688, 67
- Faber et al. (2007) Faber, S. M., Willmer, C. N. A., Wolf, C., et al. 2007, ApJ, 665, 265
- Franzetti et al. (2007) Franzetti, P., Scodeggio, M., Garilli, B., et al. 2007, A&A, 465, 711
- Fumagalli et al. (2009) Fumagalli, M., Krumholz, M. R., Prochaska, J. X., Gavazzi, G., & Boselli, A. 2009, ApJ, 697, 1811
- Gadotti & de Souza (2003) Gadotti, D. A. & de Souza, R. E. 2003, ApJL, 583, L75
- Garcia (1993) Garcia, A. M. 1993, A&AS, 100, 47
- Gavazzi et al. (2002) Gavazzi, G., Bonfanti, C., Sanvito, G., Boselli, A., & Scodeggio, M. 2002, ApJ, 576, 135
- Gavazzi et al. (2003) Gavazzi, G., Boselli, A., Donati, A., Franzetti, P., & Scodeggio, M. 2003, A&A, 400, 451
- Gavazzi et al. (1999) Gavazzi, G., Boselli, A., Scodeggio, M., Pierini, D., & Belsole, E. 1999, MNRAS, 304, 595
- Girardi et al. (1998) Girardi, M., Giuricin, G., Mardirossian, F., Mezzetti, M., & Boschin, W. 1998, ApJ, 505, 74
- Gunn & Gott (1972) Gunn, J. E. & Gott, J. R. I. 1972, ApJ, 176, 1
- Haines et al. (2008) Haines, C. P., Gargiulo, A., & Merluzzi, P. 2008, MNRAS, 385, 1201
- Hau et al. (2008) Hau, G. K. T., Bower, R. G., Kilborn, V., et al. 2008, MNRAS, 385, 1965
- Haynes & Giovanelli (1984) Haynes, M. P. & Giovanelli, R. 1984, AJ, 89, 758
- Haynes et al. (2000) Haynes, M. P., Jore, K. P., Barrett, E. A., Broeils, A. H., & Murray, B. M. 2000, AJ, 120, 703
- Hoag (1950) Hoag, A. A. 1950, AJ, 55, 170
- Hopkins et al. (2009) Hopkins, P. F., Cox, T. J., Younger, J. D., & Hernquist, L. 2009, ApJ, 691, 1168
- Howell (2006) Howell, J. H. 2006, AJ, 131, 2469
- Hughes & Cortese (2009) Hughes, T. M. & Cortese, L. 2009, MNRAS, 396, L41
- Kannappan (2004) Kannappan, S. J. 2004, ApJL, 611, L89
- Kauffmann (1996) Kauffmann, G. 1996, MNRAS, 281, 487
- Kaviraj et al. (2007) Kaviraj, S., Schawinski, K., Devriendt, J. E. G., et al. 2007, ApJS, 173, 619
- Kenney et al. (2008) Kenney, J. D. P., Tal, T., Crowl, H. H., Feldmeier, J., & Jacoby, G. H. 2008, ApJL, 687, L69
- Kennicutt et al. (1994) Kennicutt, R. C., Tamblyn, P., & Congdon, C. E. 1994, ApJ, 435, 22
- Kereš et al. (2005) Kereš, D., Katz, N., Weinberg, D. H., & Davé, R. 2005, MNRAS, 363, 2
- Kochanek et al. (2001) Kochanek, C. S., Pahre, M. A., Falco, E. E., et al. 2001, ApJ, 560, 566
- Kojima & Noguchi (1997) Kojima, M. & Noguchi, M. 1997, ApJ, 481, 132
- Kormendy & Kennicutt (2004) Kormendy, J. & Kennicutt, Jr., R. C. 2004, ARA&A, 42, 603
- Kroupa et al. (1993) Kroupa, P., Tout, C. A., & Gilmore, G. 1993, MNRAS, 262, 545
- Krumholz et al. (2009) Krumholz, M. R., McKee, C. F., & Tumlinson, J. 2009, ApJ, 693, 216
- Krumm et al. (1985) Krumm, N., van Driel, W., & van Woerden, H. 1985, A&A, 144, 202
- Larson et al. (1980) Larson, R. B., Tinsley, B. M., & Caldwell, C. N. 1980, ApJ, 237, 692
- Macciò et al. (2006) Macciò, A. V., Moore, B., & Stadel, J. 2006, ApJL, 636, L25
- Martig et al. (2009) Martig, M., Bournaud, F., Teyssier, R., & Dekel, A. 2009, ArXiv e-prints:0905.4669
- Martin et al. (2005) Martin, D. C., Fanson, J., Schiminovich, D., et al. 2005, ApJL, 619, L1
- Martin et al. (2007a) Martin, D. C., Small, T., Schiminovich, D., et al. 2007a, ApJS, 173, 415
- Martin et al. (2007b) Martin, D. C., Wyder, T. K., Schiminovich, D., et al. 2007b, ApJS, 173, 342
- Miller et al. (1999) Miller, E. D., Knezek, P. M., & Bregman, J. N. 1999, ApJL, 510, L95
- Minchin et al. (2007) Minchin, R., Davies, J., Disney, M., et al. 2007, ApJ, 670, 1056
- Noguchi (1999) Noguchi, M. 1999, ApJ, 514, 77
- Noordermeer et al. (2005) Noordermeer, E., van der Hulst, J. M., Sancisi, R., Swaters, R. A., & van Albada, T. S. 2005, A&A, 442, 137
- Noordermeer et al. (2007) Noordermeer, E., van der Hulst, J. M., Sancisi, R., Swaters, R. S., & van Albada, T. S. 2007, MNRAS, 376, 1513
- Nulsen (1982) Nulsen, P. E. J. 1982, MNRAS, 198, 1007
- O’Connell (1999) O’Connell, R. W. 1999, ARA&A, 37, 603
- Oosterloo et al. (2002) Oosterloo, T. A., Morganti, R., Sadler, E. M., Vergani, D., & Caldwell, N. 2002, AJ, 123, 729
- Pahre et al. (2004) Pahre, M. A., Ashby, M. L. N., Fazio, G. G., & Willner, S. P. 2004, ApJS, 154, 229
- Panuzzo et al. (2003) Panuzzo, P., Bressan, A., Granato, G. L., Silva, L., & Danese, L. 2003, A&A, 409, 99
- Patil et al. (2009) Patil, M. K., Pandey, S. K., Kembhavi, A., & Sahu, D. K. 2009, ArXiv e-prints:0901.1747
- Pérez-González et al. (2008) Pérez-González, P. G., Rieke, G. H., Villar, V., et al. 2008, ApJ, 675, 234
- Pignatelli et al. (2001) Pignatelli, E., Corsini, E. M., Vega Beltrán, J. C., et al. 2001, MNRAS, 323, 188
- Postman et al. (2005) Postman, M., Franx, M., Cross, N. J. G., et al. 2005, ApJ, 623, 721
- Quinn et al. (1993) Quinn, P. J., Hernquist, L., & Fullagar, D. P. 1993, ApJ, 403, 74
- Roberts (1963) Roberts, M. S. 1963, ARA&A, 1, 149
- Sandage & Bedke (1994) Sandage, A. & Bedke, J. 1994, The Carnegie atlas of galaxies (Washington, DC: Carnegie Institution of Washington with The Flintridge Foundation, —c1994)
- Schawinski et al. (2009) Schawinski, K., Virani, S., Simmons, B., et al. 2009, ApJL, 692, L19
- Schiminovich et al. (2007) Schiminovich, D., Wyder, T. K., Martin, D. C., et al. 2007, ApJS, 173, 315
- Schlegel et al. (1998) Schlegel, D. J., Finkbeiner, D. P., & Davis, M. 1998, ApJ, 500, 525
- Schwarz (1984) Schwarz, M. P. 1984, MNRAS, 209, 93
- Schweizer et al. (1987) Schweizer, F., Ford, W. K. J., Jederzejewski, R., & Giovanelli, R. 1987, ApJ, 320, 454
- Scodeggio et al. (2002) Scodeggio, M., Gavazzi, G., Franzetti, P., et al. 2002, A&A, 384, 812
- Seigar (2005) Seigar, M. S. 2005, MNRAS, 361, L20
- Skrutskie et al. (2006) Skrutskie, M. F., Cutri, R. M., Stiening, R., et al. 2006, AJ, 131, 1163
- Solanes et al. (1996) Solanes, J. M., Giovanelli, R., & Haynes, M. P. 1996, ApJ, 461, 609
- Springob et al. (2005) Springob, C. M., Haynes, M. P., & Giovanelli, R. 2005, ApJ, 621, 215
- Tully et al. (1982) Tully, R. B., Mould, J. R., & Aaronson, M. 1982, ApJ, 257, 527
- van den Bergh (1976) van den Bergh, S. 1976, ApJ, 206, 883
- van Driel et al. (1989) van Driel, W., Balkowski, C., & van Woerden, H. 1989, A&A, 218, 49
- van Driel & van Woerden (1991) van Driel, W. & van Woerden, H. 1991, A&A, 243, 71
- van Driel et al. (1988) van Driel, W., van Woerden, H., Schwarz, U. J., & Gallagher, III, J. S. 1988, A&A, 191, 201
- Vega Beltrán et al. (2001) Vega Beltrán, J. C., Pizzella, A., Corsini, E. M., et al. 2001, A&A, 374, 394
- Vollmer et al. (2005a) Vollmer, B., Braine, J., Combes, F., & Sofue, Y. 2005a, A&A, 441, 473
- Vollmer et al. (2005b) Vollmer, B., Huchtmeier, W., & van Driel, W. 2005b, A&A, 439, 921
- Whitmore et al. (1990) Whitmore, B. C., Lucas, R. A., McElroy, D. B., et al. 1990, AJ, 100, 1489
- Wyder et al. (2007) Wyder, T. K., Martin, D. C., Schiminovich, D., et al. 2007, ApJS, 173, 293
- Xu & Buat (1995) Xu, C. & Buat, V. 1995, A&A, 293, L65
- Zhang et al. (2009) Zhang, W., Li, C., Kauffmann, G., et al. 2009, MNRAS, 397, 1243
Appendix A: Notes on individual objects
\hi-normal transition galaxies
NGC3619 is a S0 galaxy, member of a group composed of at least five systems (Garcia 1993). The \hi distribution is asymmetric and much concentrated in the center (van Driel et al. 1989), where star formation is taking place and dust lanes are clearly visible. The extent of the \hi roughly matches the UV star-forming disk, i.e., half the optical radius. In optical, the galaxy shows prominent outer stellar shells, suggesting a recent minor-merging/accretion event. Numerical simulations predict that the stars from a satellite make a system of shells several 108 yr after the end of the merging event which can last for more than 1 Gyr (Kojima & Noguchi 1997). The accretion scenario is also supported by the spectroscopic analysis performed by Howell (2006). He finds that the age, metallicity, and -enhancement ratios of NGC3619 are consistent with those of a representative sample of unperturbed nearby elliptical galaxies, contrary to what expected in the case of a recent major merger and supporting a minor merger with a gas-rich dwarf satellite. Thus, all the observational evidence is consistent with an external origin for the atomic hydrogen and residual star formation observed in NGC3619.
NGC3898 is a Sa galaxy in the Ursa major group. In the Hubble Atlas it is described as the prototype of Sa galaxy: i.e., with a prominent bulge component and multiple spiral arms. HST observations reveal that the bulge is a ‘classical bulge’ (Drory & Fisher 2007), consistent with a major merger/accretion event in the past. UV observations show that active star formation is mainly segregated in a ring well within the optical radius, although star-forming regions are also found at the edge of the optical disk. The atomic hydrogen is distributed in a low column density (1-2 M⊙ pc-2) disk extending up to 4 times the radius containing 80% of the B-band light (Noordermeer et al. 2005). The highest \hi column density is observed in correspondence with the UV star-forming regions, suggesting that only in these few regions the \hi can condensate into molecular hydrogen and initiate the star formation cycle (Krumholz et al. 2009). The \hi disk appears to be warped in the inner parts and shows some ‘wiggles’ with an amplitude of 30-50 km s-1 (Noordermeer et al. 2007). Although H long-slit spectroscopy (Pignatelli et al. 2001; Vega Beltrán et al. 2001) and 21 cm \hi line interferometry (Noordermeer et al. 2005, 2007) suggest that both ionized and atomic hydrogen have a regular velocity field and a smooth distribution, Noordermeer et al. (2005) suggest that this galaxy may have experienced a recent interaction/accretion event. However, the basis for this interpretation is not completely clear.
NGC4324 is a Sa galaxy belonging to the Virgo S cloud (Gavazzi et al. 2003). Star formation is segregated in a ring, also visible in SDSS images, distinct from the central bulge component. Although \hi maps are not available, Duprie & Schneider (1996) detect \hi up to 2 optical diameters suggesting that the atomic hydrogen is not only concentrated in the star-forming ring.
NGC4370 is an early type galaxy member of the Virgo B cloud (Gavazzi et al. 2003) forming a non-interacting pair with NGC4365. Its detailed morphological classification is rather uncertain, varying from Sa (Binggeli et al. 1985) to elliptical (Bertola et al. 1988). This is mainly due to the presence of a prominent dust lane along the equatorial plane of the galaxy. Although active star-forming regions are not clearly evident from UV and H images, we cannot exclude that we are observing an analogous of the Sombrero galaxy (NGC4594) completely edge-on. Excluding the prominent dust lane, no other evidence for interaction/accretion is found and the gas and stars in the galaxy are co-rotating (Bertola et al. 1988). Surprisingly, Bertola et al. (1988) interpret the co-rotation in NGC4370 as a sign of possible accretion, suggesting that the gas present in this galaxy has an external origin. Although the basis for this interpretation may be debatable, the same conclusion has been recently reached by Patil et al. (2009), who investigated the dust content in NGC4370. They propose that the amount of dust observed in the galaxy can not have been formed in situ and that at least part of the material must have been accreted during an interaction event. An external origin for the atomic hydrogen content in this galaxy is thus not excluded, as observed in other \hi-rich dust-lane elliptical galaxies (Oosterloo et al. 2002).
NGC4378 is a Sa galaxy belonging to the Virgo S cloud. It has a prominent nuclear bulge surrounded by a low surface brightness disk which contains a single, tightly-wound, spiral arm. Given the low surface brightness of the disk component, van den Bergh (1976) classified this object as an early-type anemic spiral, although we now know that its atomic hydrogen content is not significantly different from the one in high surface brightness disks. UV star formation is clearly visible across all the disk. Numerical simulations (Byrd et al. 1994a) suggest that the unusual one-armed spiral structure in NGC4378 is in reality an impulsive trailing arm created by the recent passage (200 Myr) of a small companion (1/30 the galaxy’s mass). Since the satellite is supposed to survive the interaction, it seems unlikely that a significant fraction of the \hi present in NGC4378 has been recently accreted. The low SSFR of NGC4378 may therefore have an internal origin. By studying a sample of nearby galaxies, Seigar (2005) recently found a correlation between the average shear rate in disks and their SSFR, suggesting the existence of a shear-threshold above which star formation is inhibited. Interestingly, NGC4378 has a shear rate (0.690.03) just below the threshold value (0.700.09) suggested by Seigar (2005). If this is the case, the internal dynamical properties of NGC4378 may be responsible for the low star formation efficiency observed in this object.
NGC4772 is a Sa galaxy in the Virgo S cloud. Recently, Haynes et al. (2000) carried out a detailed multiwavelength analysis of this object, showing that it is probably the result of a minor merger event. The main observational evidence supporting such scenario is: 1) the presence of dynamically decoupled central gas and stellar components, in particular in correspondence of the star forming ring visible in UV (Fig. 8) and H, 2) the unusual \hi distribution, which is segregated in two concentric rings, the inner one where star formation is taking place and 3) the presence of a warp in the outer \hi ring. The most likely scenario is that NGC4772 is at the end stage of a prograde merger in which the transfer of angular momentum leads to an outward spread of the disk (Quinn et al. 1993; Haynes et al. 2000).
NGC5701 is the bluest object in the transition region. We classified this galaxy as an Sa (NED gives S0/a). However its peculiar morphology, characterized by a central bulge surrounded by a faint and apparently detached star-forming ring, makes NGC5701 a possible Hoag-type object (Hoag 1950). In this case the central condensation is a bar, not a ‘bulge or elliptical’ (Hoag 1950) and Gadotti & de Souza (2003) dubbed this object ‘a barred galaxy without a disk’. The origin of Hoag-type objects is still a puzzle, but two different scenarii seem to be the most commonly accepted: a) accretion of small satellites (Schweizer et al. 1987), or b) a strong bar instability (Brosch 1985), which destroys the disk and builds up a ring (e.g. Schwarz 1984; Byrd et al. 1994b). The lack of detailed dynamical and spectroscopic data prevent us from driving a conclusion on the origin of the ring in NGC5701, but it is quite likely that the bar is playing an important role either destroying the disk or preventing the accreted gas from infalling into the center.
\hi-normal red-sequence galaxies
NGC4203 is an, apparently isolated, barred S0 galaxy. UV images show low level star-formation at least in the south-east part of the galaxy, corresponding to the outer edge of the warm-dust spiral structure detected at 8m in the galaxy center (Pahre et al. 2004). Despite its low star formation activity, NGC4203 has a large reservoir of atomic hydrogen, distributed in a peculiar, filamentary structure and extended up to 2.2 optical radii (van Driel et al. 1988; Noordermeer et al. 2005). The atomic gas has a general sense of motion around the center, but it is clearly not on regular circular orbits (Noordermeer et al. 2005). Again, the \hi is mainly found in two ring structures: an inner ring (in correspondence with the UV features) and an outer ring which is likely rotating on a different plane (van Driel et al. 1988). The peculiar dynamics of NGC4203 is thus suggestive of an accretion event (van Driel et al. 1988). The \hi disk of NGC4203 is also one of the nearest damped Lyman alpha systems. Miller et al. (1999) found that the metallicity of the gas is significantly lower than the one observed in galaxies of the same luminosity. If confirmed, this would represent a strong observational evidence supporting the external origin for the \hi.
NGC4262 is a barred S0 galaxy belonging to the Virgo main cloud A. No star formation is observed within the optical radius. However, UV images reveal the presence of a UV star-forming ring extended up to 2.5 optical radii. Although faint UV emission is marginally visible all across the ring, great part of the star formation is taking place in the south-west. This roughly coincides with the peak in \hi distribution as revealed in the maps presented by Krumm et al. (1985) and Minchin et al. (2007). Moreover, all the \hi is segregated into a ring and no low surface density \hi disk is detected. Krumm et al. (1985) and van Driel & van Woerden (1991) suggested that the ring has probably an external origin and more recently Vollmer et al. (2005b) tentatively proposed that the \hi could have been accreted during an interaction between NGC4262 and NGC4254. Being a barred system plus a ring, NGC4262 shows some similarities with the Hoag-type object NGC5701. If this is the case, NGC4262 is probably at an earlier evolutionary stage, since its ring is only visible in UV whereas the ring in NGC5701 is evident also in optical, suggesting an older age for the stellar populations. We note that, if we integrate the UV light up to the extent of the ring, NGC4262 would move from the red sequence to the transition region.
NGC4698 is a bulge-dominated Sa galaxy in the Virgo E cloud. The Carnegie Atlas (Sandage & Bedke 1994) describes it as an elliptical-like bulge in which there is no evidence of recent star formation or spiral structure, plus a low-surface-brightness disk with spiral arms become prominent only in the outer part of the disk. HST observations reveal that the bulge is a ‘classical bulge’ (Drory & Fisher 2007), consistent with a major merger/accretion event in the past. Once again, UV images reveal that star formation is segregated into two ‘almost perfect’ rings: one within and the other outside the optical radius. Interestingly, the two rings are not concentric: the inner ring is centered on the nucleus, whereas the outer one is offset 20 arcsec to the north. The peculiarity of NGC4698 becomes more evident when the dynamical properties of the bulge and disk component are compared. Bertola et al. (1999) showed that the rotation axis of the disk and of the bulge are almost perpendicular. They interpret this unusual geometry as an evidence of a later formation of the disk through the acquisition of material by a completely formed spheroid. Also in this case, the galaxy moves back to the transition region if the outer ring is included in the estimate of the UV flux.
NGC4866 is an isolated, highly inclined, S0 galaxy (although Sandage & Bedke 1994 classify it as Sa). Very few data are available in the literature, and the only unusual feature is the presence, once again, of a UV star-forming ring at the edge of the optical disk.
NGC5103 is an isolated Sab galaxy. As for NGC3414, no recent star formation activity is clearly visible in the UV image and the galaxy resembles an edge-on polar ring/disk system: Whitmore et al. (1990) classifies NGC5103 as possible candidate for polar-ring galaxy. No high-resolution \hi maps are available for this object.
Finally, a visual inspection of galaxies in the red sequence reveals the presence of two other objects with UV rings: NGC3945 and NGC4643. Unfortunately, no \hi observations are available and they are thus excluded from the discussion in the text.