Unusually Wide Binaries: Are They Wide or Unusual?
Abstract
We describe an astrometric and spectroscopic campaign to confirm the youth and association of a complete sample of candidate wide companions in Taurus and Upper Sco. Our survey found fifteen new binary systems (3 in Taurus and 12 in Upper Sco) with separations of 3-30″ (500-5000 AU) among all of the known members with masses of 2.5-0.012 . The total sample of 49 wide systems in these two regions conforms to only some expectations from field multiplicity surveys. Higher-mass stars have a higher frequency of wide binary companions, and there is a marked paucity of wide binary systems near the substellar regime. However, the separation distribution appears to be log-flat, rather than declining as in the field, and the mass ratio distribution is more biased toward similar-mass companions than the IMF or the field G dwarf distribution. The maximum separation also shows no evidence of a limit at 5000 AU until the abrupt cessation of any wide binary formation at system masses of 0.3 . We attribute this result to the post-natal dynamical sculpting that occurs for most field systems; our binary systems will escape to the field intact, but most field stars are formed in denser clusters and do not. In summary, only wide binary systems with total masses 0.3 appear to be “unusually wide”.
Subject headings:
stars:binaries:visual, stars:formation, stars:pre-main-sequence1. Introduction
The frequency and properties of multiple star systems are important diagnostics for placing constraints on star formation processes. This motivation has prompted numerous attempts to characterize the properties of nearby binary systems in the field. These surveys (e.g. Duquennoy & Mayor 1991; Fischer & Marcy 1992; Close et al. 2003; Bouy et al. 2003; Burgasser et al. 2003) have found that binary frequencies and properties are very strongly dependent on mass. Solar-mass stars have high binary frequencies (60%) and maximum separations of up to 104 AU. By contrast, M dwarfs have moderately high binary frequencies (30-40%) and few binary companions with separations of more than 500 AU, while brown dwarfs have low binary frequencies (15% for all companions with separations 2-4 AU) and few companions with separations 20 AU.
The mass-dependent decline in the maximum observed binary separation (or binding energy) has been described by Reid et al. (2001) and Burgasser et al. (2003) with an empirical function that is exponential at high masses and quadratic at low masses. The mechanism that produces the mass dependence is currently unknown. Simulations show that the empirical limit is not a result of dynamical evolution in the field (e.g. Burgasser et al. 2003; Weinberg et al. 1987) since the rates of binary disruption (due to single stellar encounters with small impact parameters) and evolution in the separation distribution (due to many encounters at large impact parameters) are far too low. This suggests that the limit must be set early in stellar lifetimes, either as a result of the binary formation process or during early dynamical evolution in relatively crowded natal environments.
Studies of nearby young stellar associations have identified several candidate systems which might be unusually wide binaries (Chauvin et al. 2004; Caballero et al. 2006; Jayawardhana & Ivanov 2006; Luhman et al. 2006a, 2007; Close et al. 2007; Kraus & Hillenbrand 2007b). However, there are several factors that must be considered when interpreting these discoveries. Most were identified serendipitously and not as part of a survey, so the actual frequency of these candidates is not well constrained. Further, several of these systems do not seem to be unusual in comparison to field systems of similar mass. Finally, many of these systems have not been surveyed at high angular resolution, so they could be hierarchical multiples with higher total masses.
We began addressing these problems by using archival 2MASS data to systematically search for candidate wide binary systems among all of the known members of three nearby young associations (Upper Sco, Taurus-Auriga, and Chamaeleon-I; Kraus & Hillenbrand 2007a, hereafter KH07a). Our results broadly agreed with the standard paradigm; there is a significant deficit of wide systems among very low-mass stars and brown dwarfs as compared to their more massive brethren. However, we also found that most of these wide systems were concentrated in the very sparsest T associations, Taurus and Cham-I. Upper Sco is not significantly more dense than either of these associations, so it is unclear why it might have such a meager wide binary population. We also found a few candidate systems which appeared to be unusually wide for their mass. However, photometric criteria alone are not sufficient to reject all background stars.
In this paper, we describe our astrometric and spectroscopic followup campaign to confirm or reject the youth and association of our new sample of candidate binary companions. In Section 2, we describe the compilation of our sample of candidate wide binary systems. In Section 3, we describe the observations and analysis conducted for our survey, and in Section 4, we evaluate this evidence in order to distinguish association members from field stars. Finally, in Section 5, we describe the mass-dependent binary frequency, mass ratio distribution, and separation distribution of these systems, plus we examine the criteria that might define an “unusually wide” binary system.
2. Sample
We drew the sample from our previous companion search (KH07a), which used 2MASS photometry to identify candidate companions to members of Taurus, Upper Sco, and Cham-I. The survey used PSF-fitting photometry of the 2MASS atlas images to identify close (1-5″) companions and archival data from the 2MASS Point Source Catalog to identify well-resolved (5″) companions. For this study, we do not include any of the candidates in Cham-I or the southern subgroup of Upper Sco (USco-B) since our observations were all conducted from northern sites. We consider every candidate in the other two associations with a separation of 3″ (out to a limit of 30″) and a flux ratio of 3 (corresponding to mass ratios 0.1). We also considered all 14 candidates in Taurus with larger flux ratios, yielding a complete sample down to the 10 flux limit of 2MASS (); we were not able to gather sufficient information to consider one of the 3 candidates with large flux ratios in Upper Sco.
We list all of the previously-unconfirmed candidate companions in our sample in Table 1. Some of the sources in our sample have been identified previously in the literature as either field stars or association members based on a wide variety of characteristics: proper motions, the presence of a disk, low surface gravity, or the presence of lithium. We summarize these identifications in Tables 2 and 3, respectively. Table 3 also includes all of the systems we identified in a similar compilation in KH07a.
Finally, in Tables 1-3 we have compiled updated spectral types for all members of our sample. Our original survey used the spectral types assigned in the discovery survey or in compilation papers (e.g. Kenyon & Hartmann 1995), but a significant number of system components have had more precise spectral type estimates published since their discovery. Unless otherwise noted, the masses were estimated using the methods described in Section 3.4. In hierarchical multiple systems where components are themselves known to be multiple from previous AO, speckle, or RV surveys, we have noted the known or estimated spectral type of each, and report the corresponding known or estimated system mass. We also have updated the spectral types and multiplicity (and therefore the masses) for all sample members that do not have wide companions, so the analysis in Section 5 is performed with a uniform sample.
| Known Member | Candidate Companion | Sep | PA | aaEntries with multiple spectral types denote components which are themselves known to be multiple; if the spectral type for a component has not been measured, it is listed as “?”. | Ref | |
|---|---|---|---|---|---|---|
| (″) | (deg) | (mag) | ||||
| Taurus | ||||||
| 2M04414489+2301513 | 2M04414565+2301580 | 12.37 | 57.3 | -3.31 | M8.25 | 1 |
| 2M04080782+2807280 | 2M04080771+2807373 | 9.43 | 351.1 | -1.96 | M3.75 | 1 |
| LkCa 15 | 2M04391795+2221310 | 27.62 | 4.6 | -1.14 | K5 | 4 |
| FW Tau | 2M04292887+2616483 | 12.22 | 246.7 | 0.03 | M5.5+? | 3 |
| GM Aur | 2M04551015+3021333 | 28.31 | 202.2 | 0.28 | K7 | 4 |
| 2M04161885+2752155 | 2M04161754+2751534 | 28.04 | 218.2 | 0.60 | M6.25 | 1 |
| CFHT-Tau-7 | 2M04321713+2421556 | 21.76 | 207.2 | 0.82 | M5.75 | 1 |
| HBC 427 | 2M04560252+3020503 | 14.90 | 154.0 | 0.89 | K5+? | 5 |
| I04158+2805 | 2M04185906+2812456 | 25.34 | 28.9 | 0.98 | M5.25 | 1 |
| JH 112 | 2M04324938+2253082 | 6.56 | 34.3 | 1.03 | K7 | 7 |
| V710 Tau AB | 2M04315968+1821305 | 27.97 | 105.7 | 1.39 | M0.5+M2 | 9 |
| CFHT-Tau-21 | 2M04221757+2654364 | 23.31 | 152.1 | 2.06 | M2 | 1 |
| V410 X-ray1 | 2M04175109+2829157 | 27.95 | 137.4 | 2.66 | M4 | 8 |
| 2M04213460+2701388 | 2M04213331+2701375 | 17.18 | 265.7 | 2.70 | M5.5 | 2 |
| I04385+2550 | 2M04413842+2556448 | 18.94 | 343.3 | 3.03 | M0.5 | 6 |
| DO Tau | 2M04382889+2611178 | 28.75 | 8.4 | 3.28 | M0 | 7 |
| CFHT 4 | 2M04394921+2601479 | 24.40 | 72.9 | 3.56 | M7 | 18 |
| I04216+2603 | 2M04244376+2610398 | 27.96 | 337.0 | 3.66 | M0 | 7 |
| V410 X-ray 5a | 2M04190271+2822421 | 13.27 | 47.7 | 3.67 | M5.5 | 21 |
| V410 X-ray 6 | 2M04190223+2820039 | 26.49 | 34.4 | 4.22 | M5.5 | 21 |
| MHO-Tau-2 | 2M04142440+2805596 | 26.32 | 269.9 | 4.32 | M2.5+M2.5 | 20 |
| V410 X-ray 2 | 2M04183574+2830254 | 17.72 | 105.6 | 4.47 | M0 | 22 |
| IS Tau | 2M04333746+2609550 | 10.85 | 57.4 | 4.82 | M0+M3.5 | 19 |
| CoKu Tau/3 | 2M04354076+2411211 | 12.60 | 349.2 | 4.97 | M1 | 7 |
| FM Tau | 2M04141556+2812484 | 26.21 | 91.7 | 4.98 | M0 | 7 |
| LkCa 4 | 2M04162839+2807278 | 8.86 | 154.6 | 5.25 | K7 | 7 |
| IS Tau | 2M04333467+2609447 | 28.73 | 261.1 | 5.64 | M0+M3.5 | 19 |
| FO Tau | 2M04144741+2812219 | 26.19 | 250.8 | 5.98 | M3.5+M3.5 | 19 |
| DG Tau | 2M04270370+2606067 | 16.43 | 234.3 | 6.71 | K2 | 6 |
| Upper Sco | ||||||
| SCH160758.50-203948.90 | 2M16075796-2040087 | 21.52 | 200.7 | -4.78 | M6 | 13 |
| USco80 | 2M15583621-2348018 | 12.27 | 15.2 | -1.89 | M4 | 17 |
| DENIS162041.5-242549.0 | 2M16204196-2426149 | 26.73 | 164.5 | -1.28 | M7.5 | 10 |
| SCH161511.15-242015.56 | 2M16151239-2420091 | 17.96 | 69.8 | -1.04 | M6 | 13 |
| UScoJ160700.1-203309 | 2M16065937-2033047 | 11.65 | 293.1 | -0.40 | M2 | 16 |
| SCH161825.01-233810.68 | 2M16182365-2338268 | 24.73 | 229.1 | -0.20 | M5 | 13 |
| SCH162135.91-235503.41 | 2M16213638-2355283 | 25.65 | 165.3 | -0.19 | M6 | 13 |
| ScoPMS048 | ScoPMS 048 B | 3.05 | 192.1 | 0.25 | K2+M4 | 15 |
| SCH160758.50-203948.90 | 2M16075693-2039424 | 22.94 | 285.5 | 1.39 | M6 | 13 |
| RXJ 1555.8-2512 | 2M15554839-2512174 | 8.91 | 318.4 | 1.71 | G3 | 12 |
| RXJ 1558.8-2512 | 2M15585415-2512407 | 11.35 | 130.1 | 1.88 | M1 | 12 |
| GSC 06213-01459 | GSC 06213-01459 B | 3.18 | 305.5 | 2.14 | K5 | 11 |
| UScoJ160936.5-184800 | 2M16093658-1847409 | 19.97 | 2.2 | 2.22 | M3 | 16 |
| ScoPMS042b | 2M16102177-1904021 | 4.58 | 6.8 | 2.31 | M3 | 14 |
| RXJ 1602.8-2401B | 2M16025116-2401502 | 7.22 | 352.9 | 2.69 | K4 | 12 |
| UScoJ160245.4-193037 | 2M16024735-1930294 | 28.19 | 72.9 | 2.74 | M5 | 16 |
| GSC 06784-00997 | 2M16101888-2502325 | 4.81 | 240.4 | 2.90 | M1 | 11 |
| GSC 06785-00476 | 2M15410726-2656254 | 6.30 | 82.6 | 3.04 | G7 | 11 |
| UScoJ161031.9-191305 | 2M16103232-1913085 | 5.71 | 114.0 | 3.74 | K7 | 16 |
| RXJ 1555.8-2512 | 2M15554788-2512172 | 14.61 | 298.1 | 4.24 | G3 | 12 |
| GSC 06784-00039 | 2M16084438-2602139 | 13.53 | 77.5 | 5.12 | G7 | 11 |
Note. — The astrometry and photometry for each candidate system have been adopted from our re-reduction of the 2MASS atlas images (KH07a). References: (1) Luhman (2006a), (2) Luhman (2004), (3) White & Ghez (2001), (4) Simon et al. (2000), (5) Steffen et al. (2001), (6) White & Hillenbrand (2004), (7) Kenyon & Hartmann (1995), (8) Strom & Strom (1994), (9) Hartigan et al. (1994), (10) Martín et al. (2004), (11) Preibisch et al. (1998), (12) Kunkel (1999), (13) Slesnick et al. (2006a), (14) Walter et al. (1994), (15) Prato et al. (2002a), (16) Preibisch et al. (2002), (17) Ardila et al. (2000), (18) Martín et al. (2001), (19) Hartigan & Kenyon (2003), (20) Briceno et al. (1998), (21) Luhman (1999), (22) Luhman & Rieke (1998).
| Known Member | Field Star | Sep | PA | Evidence | Ref | |
|---|---|---|---|---|---|---|
| (″) | (deg) | (mag) | ||||
| IP Tau | NLTT 13195 | 15.75 | 55.7 | 5.08 | Proper Motion | Salim & Gould (2003) |
| V410 Anon 20 | V410 Anon 21 | 22.71 | 115.3 | 0.62 | Early SpT | Luhman (2000) |
| USco160428.4-190441 | GSC06208-00611 | 24.15 | 134.3 | 0.51 | Lithium | Preibisch et al. (1998) |
| USco161039.5-191652 | SIPS1610-1917 | 14.95 | 183.2 | 1.98 | Proper Motion | Deacon & Hambly (2007)aaDeacon & Hambly (2007) identified SIPS1610-1917 as USco161039.5-191652, but inspection of the original photographic plates shows that SIPS1610-1917 is the candidate companion that we identified in KH07a (2M16103950-1917073). Its high proper motion demonstrates that it is a field star, not a bound companion. |
Note. — The astrometry and photometry for each pair of stars have been adopted from our re-reduction of the 2MASS atlas images (KH07a).
| Primary | Secondary | Sep | PA | aaEntries with multiple spectral types denote components which are themselves known to be multiple; if the spectral type for a component has not been measured, it is listed as “?”. Sources labeled ”cont” only exhibit continuum emission from accretion and disk emission, with no recognizeable spectral features. | aaEntries with multiple spectral types denote components which are themselves known to be multiple; if the spectral type for a component has not been measured, it is listed as “?”. Sources labeled ”cont” only exhibit continuum emission from accretion and disk emission, with no recognizeable spectral features. | Refs | |
|---|---|---|---|---|---|---|---|
| (″) | (deg) | (mag) | |||||
| Taurus | |||||||
| 2M04554757+3028077 | 2M04554801+3028050 | 6.31 | 115.7 | 2.18 | M4.75 | M5.5 | 1 |
| DH Tau | DI Tau | 15.23 | 126.0 | 0.21 | M0+M7.5 | M0+? | 2, 3, 4 |
| FS Tau | Haro 6-5B | 19.88 | 275.8 | 3.57 | M0+M3.5 | K5 | 5, 6 |
| FV Tau | FV Tau/c | 12.29 | 105.7 | 1.43 | K5+cont | M2.5+M3.5 | 2, 3, 5 |
| FZ Tau | FY Tau | 17.17 | 250.5 | 0.70 | K7 | M0 | 2 |
| GG Tau Aab | GG Tau Bab | 10.38 | 185.1 | 2.61 | K7+M0.5 | M5.5+M7.5 | 7 |
| GK Tau | GI Tau | 13.14 | 328.4 | 0.42 | K7+cont | K5 | 2, 8 |
| HBC 352 | HBC 353 | 8.97 | 70.8 | 0.28 | G5 | K3 | 2 |
| HBC 355 | HBC 354 | 6.31 | 298.3 | 0.91 | K2 | K2 | 2 |
| HN Tau A | HN Tau B | 3.10 | 18.7 | 3.19 | K5 | M4.5 | 8, 9 |
| HP Tau-G2 | HP Tau | 21.30 | 296.9 | 0.40 | G0 | K3 | 2, 10 |
| HP Tau-G2 | HP Tau-G3 | 10.09 | 243.4 | 1.57 | G0 | K7+? | 2, 10 |
| HV Tau AB | HV Tau C | 3.76 | 43.9 | 4.35 | M2+? | K6 | 6, 11 |
| J1-4872 Aab | J1-4872 Bab | 3.38 | 232.9 | 0.69 | M0+M0 | M1+M1 | 8 |
| LkHa332-G1 | LkHa332-G2 | 25.88 | 254.5 | 0.28 | M1+? | M0.5+M2.5 | 2, 5, 12 |
| MHO-Tau-1 | MHO-Tau-2 | 3.93 | 153.9 | 0.01 | M2.5 | M2.5 | 13 |
| UX Tau AC | UX Tau Bab | 5.856 | 269.7 | 2.22 | K2+M3 | M2+? | 8 |
| UZ Tau Aab | UZ Tau Bab | 3.56 | 273.5 | 0.24 | M1+? | M2+M3 | 2, 5, 14, 15 |
| V710 Tau A | V710 Tau B | 3.03 | 178.5 | -0.13 | M0.5 | M2 | 9 |
| V773 Tau | 2M04141188+2811535 | 23.38 | 215.9 | 5.43 | K2+K5+M0.5+? | M6.25 | 1, 15 |
| V807 Tau | GH Tau | 21.77 | 195.2 | 0.83 | K5+M2+? | M2+M2 | 5, 25 |
| V928 Tau | CFHT-Tau-7 | 18.25 | 228.2 | 2.27 | M0.5+? | M5.75 | 2, 16, 17 |
| V955 Tau | LkHa332-G2 | 10.51 | 35.3 | 0.01 | K7+M2.5 | M0.5+M2.5 | 2, 5, 12 |
| XZ Tau | HL Tau | 23.31 | 271.2 | 0.12 | M2+M3.5 | K5 | 2, 5 |
| Upper Sco | |||||||
| RXJ1558.1-2405A | RXJ1558.1-2405B | 18.15 | 254.4 | 2.10 | K4+? | M5+? | 18, 19 |
| RXJ1604.3-2130A | RXJ1604.3-2130B | 16.22 | 215.9 | 0.92 | K2 | M2+? | 18, 19 |
| ScoPMS 052 | RXJ1612.6-1859 | 19.06 | 269.5 | 1.62 | K0+M2 | M1 | 20, 21 |
| UScoJ160428.4-190441 | UScoJ160428.0-19434 | 9.77 | 321.3 | 1.73 | M3+? | M4 | 22, 23 |
| UScoJ160611.9-193532 A | UScoJ160611.9-193532 B | 10.78 | 226.5 | 0.76 | M5+M5 | M5 | 22, 24 |
| UScoJ160707.7-192715 | UScoJ160708.7-192733 | 23.45 | 140.4 | 1.37 | M2+? | M4 | 22 |
| UScoJ160822.4-193004 | UScoJ160823.2-193001 | 13.47 | 71.4 | 0.41 | M1 | M0 | 22 |
| UScoJ160900.7-190852 | UScoJ160900.0-190836 | 18.92 | 326.5 | 1.81 | M0 | M5 | 22 |
| UScoJ161010.4-194539 | UScoJ161011.0-194603 | 25.59 | 160.8 | 0.97 | M3 | M5 | 22 |
Note. — The astrometry and photometry for each candidate system have been adopted from our re-reduction of the 2MASS atlas images (KH07a). References: (1) Luhman (2004), (2) Kenyon & Hartmann (1995), (3) Ghez et al. (1993), (4) Itoh et al. (2005), (5) Hartigan & Kenyon (2003), (6) White & Hillenbrand (2004), (7) White et al. (1999), (8) Duchene et al. (1999), (9) Hartigan et al. (1994), (10) Simon et al. (1995), (11) Stapelfeldt et al. (2003), (12) White & Ghez (2001), (13) Briceno et al. (1998), (14) Prato et al. (2002b), (15) Correia et al. (2006), (15) Boden et al. (2007), (16) Simon et al. (1996), (17) Luhman (2006), (18) Kunkel (1999), (19) Köhler et al. (2000), (20) Walter et al. (1994), (21) Prato (2007), (22) Preibisch et al. (2002), (23) Kraus et al. (2008), (24) Kraus & Hillenbrand (2007b), (25) Schaefer et al. (2006).
3. Observations and Analysis
3.1. Optical Spectroscopy
We obtained intermediate-resolution optical spectra for 14 Taurus candidates and 8 Upper Sco candidates that were wide enough to be easily resolved and optically bright enough to be observed with short (10 min) exposures. These spectra were measured with the Double Spectrograph (Oke & Gunn 1982) on the Hale 5m telescope at Palomar Observatory in December 2006 and May 2007. The spectra presented here were obtained with the red channel using a 316 l/mm grating and a 2.0″ slit, yielding a spectral resolution of 1250 over a wavelength range of 6400-8800 angstroms. Wavelength calibration was achieved by observing a standard lamp after each science target, and flux normalization was achieved by periodic observation of spectrophotometric standard stars from the compilation by Massey et al. (1988). We summarize all of the observations in Table 4.
The spectra were processed using standard IRAF111IRAF is distributed by the National Optical Astronomy Observatories, which are operated by the Association of Universities for Research in Astronomy, Inc., under cooperative agreement with the National Science Foundation. tasks; we used the IRAF task SPLOT to measure equivalent widths of spectral lines. Several of the fainter candidates have very noisy spectra because we recognized from short preliminary exposures that they were heavily reddened background stars and not late-type association members; given their brightness and color, these candidates would possess deep TiO bands if they were members.
| Candidate | Instrument | |
|---|---|---|
| Companion | (sec) | |
| 2M04080771+2807373 | DBSP | 300 |
| 2M04161754+2751534 | DBSP | 300 |
| 2M04213331+2701375 | DBSP | 600 |
| 2M04414565+2301580 | DBSP | 300 |
| 2M04394921+2601479 | NIRSPEC | 300 |
| 2M04221757+2654364 | DBSP | 300 |
| 2M04321713+2421556 | DBSP | 300 |
| 2M04354076+2411211 | NIRSPEC | 300 |
| 2M04382889+2611178 | NIRSPEC | 300 |
| 2M04141556+2812484 | NIRSPEC | 300 |
| 2M04292887+2616483 | DBSP | 300 |
| 2M04551015+3021333 | DBSP | 30 |
| 2M04560252+3020503 | DBSP | 240 |
| 2M04185906+2812456 | DBSP | 300 |
| 2M04244376+2610398 | NIRSPEC | 300 |
| 2M04333746+2609550 | NIRSPEC | 300 |
| 2M04324938+2253082 | DBSP | 600 |
| 2M04391795+2221310 | DBSP | 60 |
| 2M04162839+2807278 | NIRSPEC | 300 |
| 2M04142440+2805596 | NIRSPEC | 300 |
| 2M04190271+2822421 | NIRSPEC | 300 |
| 2M04175109+2829157 | DBSP | 300 |
| 2M04183574+2830254 | NIRSPEC | 300 |
| 2M04315968+1821305 | DBSP | 600 |
| 2M04190223+2820039 | NIRSPEC | 300 |
| 2M16204196-2426149 | DBSP | 300 |
| 2M15554839-2512174 | DBSP | 300 |
| 2M16075796-2040087 | DBSP | 60 |
| 2M16151239-2420091 | DBSP | 300 |
| 2M16182365-2338268 | DBSP | 300 |
| 2M16213638-2355283 | DBSP | 300 |
| 2M15583621-2348018 | DBSP | 180 |
| 2M16065937-2033047 | DBSP | 60 |
3.2. Near-Infrared Spectroscopy
We obtained intermediate-resolution near-infrared spectra for 11 of our Taurus candidates that were too faint and red for optical spectroscopy. These spectra were obtained using NIRSPEC on the Keck-II 10m telescope on JD 2454398 with the NIRSPEC-7 (K) filter using the low-resolution grating and a 0.76″ slit. The corresponding spectral resolution is 1500 spanning 1.95-2.37 microns, though variations in the deep telluric absorption features shortward of 2.05 m limit the useful range to 2.05 m. Wavelength calibration was achieved with respect to standard Ne lamps, and telluric correction was achieved by observing a bright F star, HD 26784.
All spectra were obtained in an ABBA nod pattern to allow for sky subtraction. As for the optical spectra above, the infrared spectra were processed using standard IRAF tasks, and we used the IRAF task SPLOT to measure equivalent widths of spectral lines. We summarize the observations in Table 4.
3.3. Imaging
We obtained high-precision astrometric measurements for a subset of our candidate companion sample in the course of several adaptive optics observing runs at the Keck-2 10m telescope and the Palomar Hale 200” telescope. All observations were obtained using the facility adaptive optics imagers, NIRC2 and PHARO. Most of our targets were observed using natural guide star adaptive optics (NGSAO), but several faint targets were observed at Keck with laser guide star adaptive optics (LGSAO; Wizinowich et al. 2006). We also observed a small number of targets with seeing-limited imaging during periods of moderate cloud cover that prevented the use of adaptive optics. We summarize all of these observations in Table 5.
For faint targets, images were obtained using the filter at Keck or the filter at Palomar. For brighter targets, we used the filter, which attenuates flux by a factor of 10 relative to broadband filters. All of our NIRC2 observations were obtained in the 10 mas pix-1 or 40 mas pix-1 modes, depending on whether the binary could fit in the narrow-frame FOV (10.18″) or required the wide-frame FOV (40.64″). All PHARO observations were obtained with the 25 mas pix-1 mode (). All Palomar image sets were obtained in a five-point box dither pattern. At Keck, all NGSAO observations and early LGSAO observations were obtained in a three-point box dither pattern (designed to avoid the bottom-left quadrant, which suffers from high read noise); later LGSAO observations were obtained in a diagonal two-point dither pattern because experience showed that dithers degrade the AO correction until several exposures have been taken with the Low-Bandwidth Wavefront Sensor, imposing a significant overhead.
Most of the targets are relatively bright and require very short integration times to avoid nonlinearity, so most exposures were taken in correlated double-sampling mode, for which the array read noise is 38 electrons read-1. Where possible, we observed targets in multiple correlated double-sampling mode, where multiple reads are taken at the beginning and ending of each exposure; this choice reduces the read noise by approximately the square root of the number of reads. In most cases, the read noise is negligible compared to the signal from the science targets. The read noise is negligible (10 electrons read -1) in all PHARO exposures.
The data were flat-fielded and dark- and bias-subtracted using standard IRAF procedures. The NIRC2 images were distortion-corrected using new high-order distortion solutions (Cameron 2008) that deliver a significant performance increase as compared to the solutions presented in the NIRC2 pre-ship manual222http://www2.keck.hawaii.edu/realpublic/inst/nirc2/; the typical absolute residuals are 4 mas in wide camera mode and 0.6 mas in narrow camera mode. The PHARO images were distortion-corrected using the solution derived by Metchev (2005). We adopted the NIRC2 narrow-field plate scale (9.963 0.003 mas pix-1) and y-axis PA (in degrees east of north; +0.13 0.01 deg) reported by Ghez et al. (2008). As we will report in a future publication (Kraus, Ireland, et al., in prep), we then used observations of the M5 core (e.g. Cameron et al. 2009) to extrapolate corresponding values for the NIRC2 wide-field camera (39.83 0.04 mas pix-1 and +0.340.02 deg) and the PHARO narrow-field camera (25.190.04 mas pix-1 and +2.150.10 deg, assuming the Cassegrain ring is set at +335 deg). The rotation for PHARO might change over time and this value has only been confirmed for 2007, so new calibrations will be needed for any other epochs. The values for PHARO also differ from those adopted in Kraus et al. (2008), where we used old values of the plate scale and rotation, so we have recalibrated the previous results to match the updated values.
We measured photometry and astrometry for our sources using the IRAF package DAOPHOT (Stetson 1987). For systems with small or moderate separations, we used the PSF-fitting ALLSTAR routine. For systems with wider separations, where anisoplanatism produced significantly different PSFs, we used the PHOT package. We analyzed each frame separately in order to estimate the uncertainty in individual measurements and to allow for the potential rejection of frames with inferior AO correction; our final results represent the mean value for all observations in a filter. For observations where the primary star was single or the secondary was close to on-axis (5″), we used that source to produce individual template PSFs for each image. In the few cases where a source was itself a close binary, we measured photometry and astrometry for each close component using the PSF reconstruction technique that we described in Kraus & Hillenbrand (2007b), then combined the values to find the photocenter.
We calibrated our photometry using the known 2MASS magnitudes for each of our science targets; in cases where the binary system was not resolved in the 2MASS PSC, we invoked the estimated magnitudes for each component from our discovery survey (KH07a). Our broadband photometry was obtained using both and filters, but previous comparisons have shown that the filter zero points differ by 0.01 mag for objects with typical stellar colors (Carpenter 2001; Kim et al. 2005). We tested the systematic uncertainty for late-type objects by convolving template spectra from the IRTF Spectral Library (Rayner et al., in prep) with the filter profiles; our results show that the zero point for the filter is 0.05 mag fainter than for at a spectral type of M7. The midpoint of the narrow filter is very close to the midpoint of typical filters (2.166), so its calibration uncertainty should be similar.
The calibration process could introduce larger systematic uncertainties (0.1–0.2 mag) if any of the sources are variable, as many pre-main sequence stars tend to be, but these cases can be identified if the calibrated flux ratios for candidate binary components do not agree with previous measurements. For systems observed with the filter, there could also be a systematic error if one component shows line emission (likely due to accretion) while the other does not; the magnitude of the error would then depend on the line flux relative to the continuum flux.
Finally, we note that one target (the candidate companion to USco80) was resolved to be a close equal-flux pair. Our analysis for the system reflects this discovery, and we will describe this observation in more detail in a future publication that summarizes our ongoing survey of the multiplicity of very low-mass stars and brown dwarfs.
| Candidate | Telescope/ | Scale | Epoch(JD- | |
|---|---|---|---|---|
| Companion | Mode | (sec) | (mas) | 2400000) |
| 2M04080771+2807373 | Keck/NGS | 40 | 40 | 54069 |
| GSC 06213-01459 B | Keck/NGS | 120 | 10 | 54187 |
| 2M16101888-2502325 | Keck/NGS | 160 | 10 | 54188 |
| 2M15410726-2656254 | Pal/NGS | 50 | 25 | 54198 |
| 2M15554839-2512174 | Pal/NGS | 297 | 25 | 54198 |
| 2M16151239-2420091 | Keck/LGS | 20 | 40 | 54188 |
| 2M16182365-2338268 | Pal/Seeing | 1427 | 25 | 54199 |
| 2M16213638-2355283 | Pal/Seeing | 1308 | 25 | 54199 |
| 2M15583621-2348018 | Keck/LGS | 120 | 40 | 54188 |
3.4. Archival Astrometry
We retrieved relative astrometry for our wide companion sample from several all-sky imaging surveys: the Two-Micron All-Sky Survey (2MASS; Skrutskie et al. 2006), the Deep Near Infrared Survey (DENIS; Epchtein et al. 1999), and the United States Naval Observatory B1.0 survey (USNOB; Monet et al. 2003). The DENIS and 2MASS source catalogues are based on wide-field imaging surveys conducted in the optical/NIR ( and , respectively) using infrared array detectors, while USNOB is based on a digitization of photographic plates from the Palomar Observatory Sky Surveys.
In our discovery survey (KH07a), we presented 2MASS astrometry for each filter that was measured directly from the processed atlas images, so we have adopted those values. We extracted DENIS astrometry from the source catalog, which contains the average value for all three filters. The USNOB source catalog reports processed astrometry as well as individual astrometric measurements for each epoch; we have chosen to work with the individual measurements since it is unclear how the USNOB astrometric pipeline weighted individual measurements or rejected potentially erroneous measurements.
Both 2MASS and DENIS quote astrometric uncertainties of 70-100 mas for individual sources spanning the brightness range of our sample, while USNOB reports uncertainties of 200-300 mas in each epoch. However, the quoted uncertainties include significant systematic terms resulting from the transformation to an all-sky reference frame. We have conducted tests with our known binary systems with existing high-precision measurements (Table 3) which suggest that narrow-angle astrometry on angular scales of 1′ is accurate to 70 mas for 2MASS/DENIS and 100-200 mas for USNOB, depending on brightness, so we adopt these lower values as the astrometric uncertainties for all measurements.
We also collated all of the astrometric observations reported in the literature for our wide companion sample. Most of these measurements were obtained using high-resolution imaging techniques: lunar occultation interferometry, speckle interferometry, and adaptive optics imaging. However, some were also obtained with seeing-limited imaging. In each case, we adopt the uncertainties reported in the literature, but it is unclear in many cases whether all possible sources of systematic error (such as geometric distortion or unresolved multiplicity) have been assessed.
3.5. Stellar and Companion Properties
Stellar properties can be difficult to estimate from observed properties, particularly for young stars, since pre-main-sequence stellar evolutionary models are not well-calibrated. The masses of a given sample could be systematically uncertain by as much as 20% (e.g. Hillenbrand & White 2004), and individual masses could be uncertain by factors of 50% or more due to unresolved multiplicity or the intrinsic variability that accreting young stars often display. These caveats suggest that any prescription for determining stellar properties should be treated with caution.
We estimated the properties of our sample members using the methods described in our original discovery survey (KH07a). This procedure calculates component masses by combining the 2- or 5-Myr isochrones of Baraffe et al. (1998) and the M dwarf temperature scale of Luhman et al. (2003) to convert observed spectral types to masses. Relative properties (mass ratios ) are calculated by combining the Baraffe isochrones and Luhman temperature scale with the empirical NIR colors of Bessell & Brett (1998) and the K-band bolometric corrections of Leggett et al. (1998) to estimate from the observed flux ratio . The observed flux ratio is not sensitive to the distance or extinction for a system (unless differential extinction is present), so the relative system properties should not be affected by these potential sources of error. We also used these techniques to estimate masses for all single stars and confirmed binary pairs in our sample.
For all binary systems without spatially resolved spectra, we have adopted the previously-measured (unresolved) spectral type for the brightest component and inferred its properties from that spectral type. This assumption should be robust since equal-flux binary components will have similar spectral types and significantly fainter components would not have contributed significant flux to the original discovery spectrum. The properties of all fainter binary components were then inferred using the methods described in the previous paragraph. When we compute mass-dependent properties (mass ratios and total system masses) for our samples, we sum the masses of all sub-components of our wide ”primary” and ”secondary”.
Projected spatial separations are calculated assuming the mean distance for each association, 145 pc (de Zeeuw et al. 1999; Torres et al. 2007). If the total radial depth of each association is equal to its angular extent (15o or 40 pc), then the unknown depth of each system within its association implies an uncertainty in the projected spatial separation of 15%. The systematic uncertainty due to the uncertainty in the mean distance of each association is negligible in comparison (5%).
4. Results
4.1. Optical Spectroscopy
The spectra show that our candidate companions can be divided into three groups: background dwarfs, background GK giants, and young association members. We plot the corresponding spectra in Figures 1-3, respectively, and we summarize our spectral classifications in Table 8.
4.1.1 Background Dwarfs
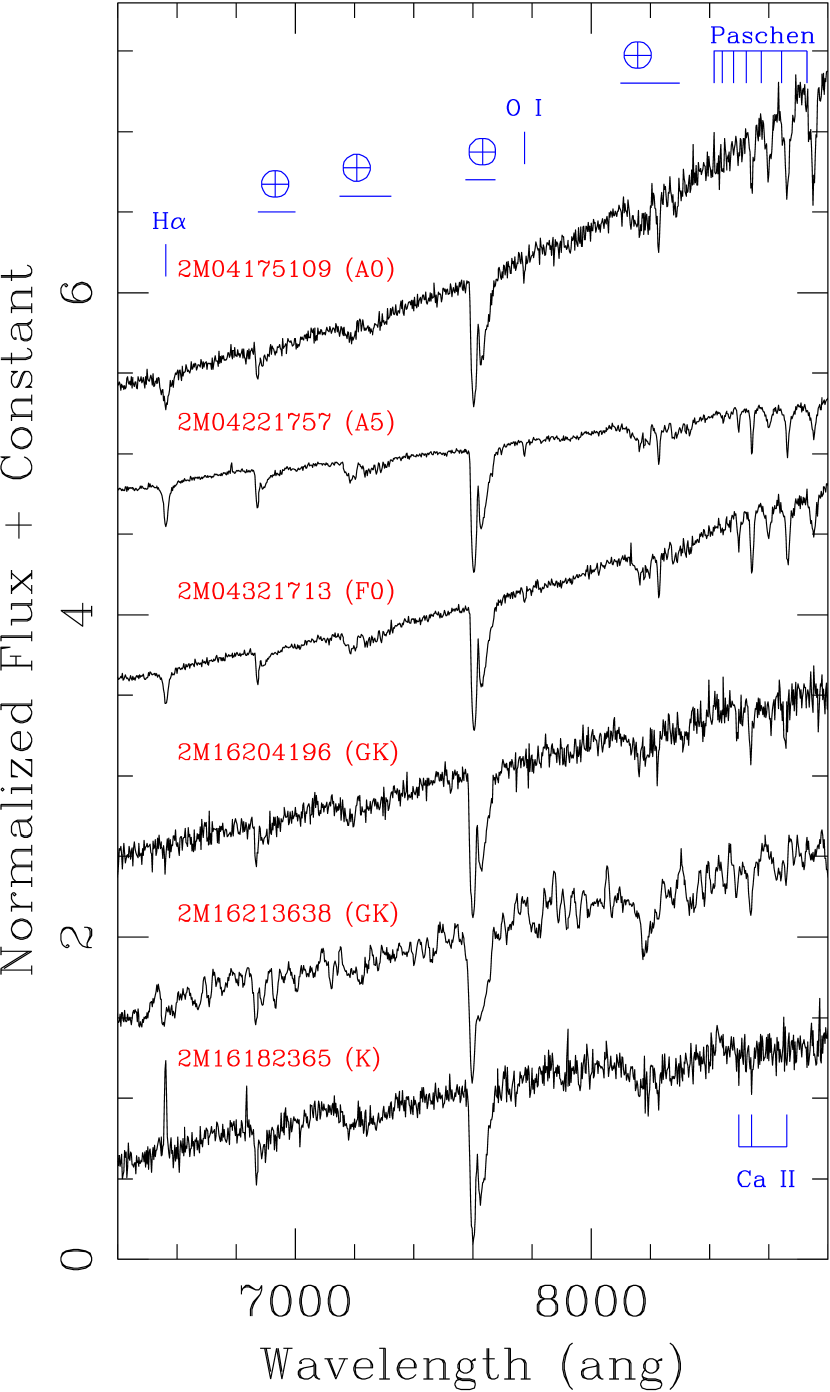
Early-type A and F dwarfs are easily identified by the presence of the Paschen series at 8400 angstroms, and specifically by the Paschen-12 and -14 lines at 8595 and 8748 angstroms. The Paschen sequence fades and the CaII infrared triplet grows between late A and late F, so the relative depths of Paschen-14 and the CaII triplet provide an excellent diagnostic for temperature in this range. We identified three sources with these key features, and we determined approximate spectral types for each source by comparing our spectra to the standard stars of Torres-Dodgen & Weaver (1993) and Allen & Strom (1995).
All three of the A-F stars that we observed are faint (11-12) and reddened to varying degrees ( for 2M04321713+2421556 and for the other two stars). Assuming their dereddened colors are , these colors suggest extinctions of and , respectively, according the reddening law of Schlegel et al. (1997). The corresponding dereddened apparent magnitudes are far too faint () to denote association members, suggesting that these stars are located beyond the association at a distance of 1 kpc.
We also identified two additional candidates, 2M16204196-2426149 and 2M16213638-2355238, that also appear to be reddened dwarfs. The Ca II infrared triplet is clearly detected for the former, but there is no convincing evidence of the Paschen series or TiO absorption bands, suggesting that it has a spectral type between early G and mid K. As we will describe in the next subsection, background giants possess a significant CN band at 7900A that this star appears to lack, suggesting that it is a dwarf. The spectral type of 2M16213638-2355238 is more difficult to assess due to the higher noise, but the absence of the TiO absorption bands suggests a spectral type of M0.
Like the A-F stars, these candidate companions are faint and reddened ( to 12.5, , ). If they have the dereddened colors of a G-K star (, ; Bessell & Brett 1988), then these colors suggest an extinction of 0.6 and corresponding dereddened apparent magnitudes of 11 to 12. This flux is far too faint to identify either source as a G-K type Upper Sco member, but is approximately consistent with a dwarf at a distance of 200-500 pc. This interpretation would normally be suspect for an object located behind Upper Sco since most of the interstellar material in the region has been dispersed, but both of these objects are located close to the edge of Ophiuchus, so the presence of interstellar material is not surprising. For example, Bouy et al. (2007) noted that extinction is locally higher along the line of sight to DENIS162041.5-242549.0 ( or ).
Finally, 2M16182365-2338268 appears to be a K dwarf in the background of the association; the absence of TiO absorption at 6700 angstroms and the CaII infrared triplet at 8500 angstroms suggest that the spectral type is not K7 or K0, and the shape of the continuum indicates moderate reddening that would not occur if it were in the foreground. As in the previous cases, it is faint and red (, , ). If its intrinsic colors are and , then the apparent colors suggest an extinction of 4 and a dereddened apparent magnitude of . This flux places the candidate well below the association sequence, but is consistent with a K5V star at a distance of 300 pc.
The presence of moderate emission makes this identification somewhat arguable since emission is a key indicator of accretion (and youth). However, it could also indicate the presence of an (unresolved) active M dwarf companion, so it is not conclusive by itself. As I will describe in Section 4.2, this candidate’s relative proper motion is also inconsistent with comovement, which supports the spectroscopic identification of this candidate as a nonmember.
4.1.2 Background Giants
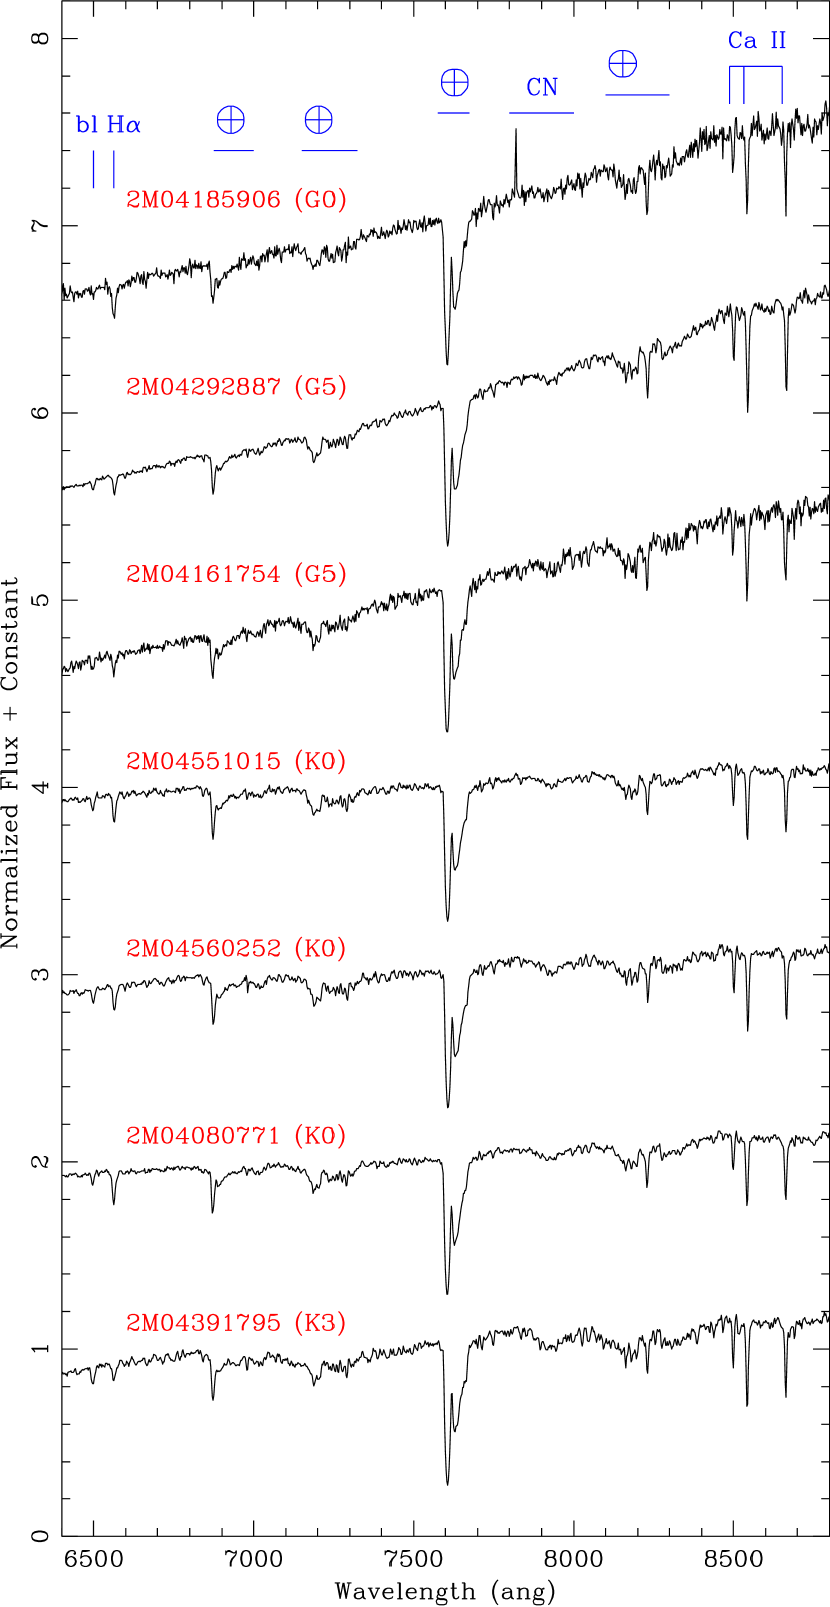
Background giants can also be easily identified, most readily by the presence of a broad CN absorption band at 7900 angstroms. It has long been known (e.g. White & Wing 1978; MacConnell et al. 1992; Torres-Dodgen & Weaver 1993) that this CN band is extremely sensitive to luminosity class: very deep for supergiants, shallow for giants, and completely absent for dwarfs. This result suggests that any source with detectable CN absorption is a luminous, distant background giant rather than an association member. The depth of the CN band has been characterized via the narrowband photometric system first described by Wing (1971), but that system is calibrated using fluxes beyond the red limit of our spectra, so we could not implement it without significant modification. Our only goal is to identify background giants and remove them from further consideration, so we opted simply to identify the presence of CN absorption by visual inspection. The deep, narrow absorption lines in the CaII infrared triplet also support our identifications.
There are few spectral type indicators in this wavelength range for G-K stars, and most are poorly calibrated, but we have used them to assess approximate spectral types with respect to the standard stars of Torres-Dodgen & Weaver (1993) and Allen & Strom (1995). We can rule out spectral types of K4 for all of these stars since TiO absorption appears and grows with decreasing temperature. The relative depths of H and the metal blend at 6497 angstroms gradually change across the G and K spectral types, with the blend appearing at G0 and equaling the depth of H at K3, so we used their relative depths to assess stars as spectral type G0, G5, K0, or K3. Residual absorption in the Paschen-14 line can also persist as late as G5, which also helped us to distinguish between G giants and K giants.
4.1.3 Young Stars
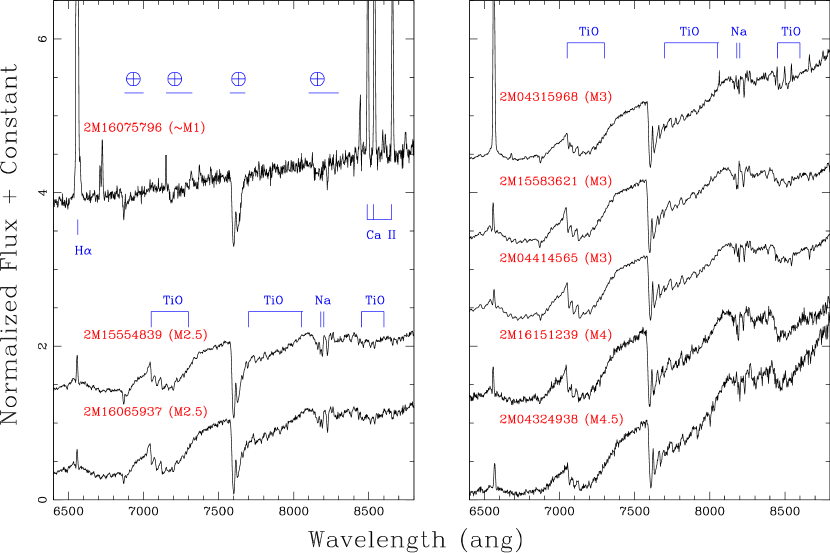
Stellar youth is most commonly inferred from three major classes of spectroscopic features: accretion signatures like H, HeI, and CaII emission, low-gravity diagnostics like shallow absorption from the Na-8189 doublet, or lithium absorption at 6708A. The spectral resolution of our observations (1200) can detect lithium only at very high S/N. Surface gravity can be assessed for stars later than M1 by the depth of the Na-8189 doublet, but all of the standard gravity indicators for K stars have wavelengths shorter than the blue limit of our spectra, so for K stars, our only option is to search for accretion signatures. We identified one K-M star based on its accretion and 7 M stars based on their surface gravity.
The optical classification of M stars is very straightforward due to their numerous and distinct molecular bands. Across the wavelength range of our spectra, early M stars are most distinctly classified by the depth of the TiO bandhead at 7050 angstroms, while mid-M stars are more distinctively classified by the depth of the TiO bandhead at 8500 angstroms. We have assessed all spectral types using the spectral indices TiO7140 and TiO8465 (Slesnick et al. 2006a), supported by a visual inspection of each spectrum. We adopted our spectral standards from a list originally observed by Slesnick et al. (2006a,2006b) using DBSP with identical instrument settings. We assessed the surface gravity using the Na8189 index developed by Slesnick et al. (2006a), confirming that each source was young by comparing its TiO7140 and Na8189 indices to the dwarf, young star, and giant results that they reported for their survey. As we show in Figure 3, qualitative inspection of the Na-8189 doublet for all seven M stars in our sample indicated that it was shallower than the field, but roughly similar to known members of Taurus or Upper Sco.
The other young star in our optical spectroscopy sample, 2M16075796-2040087, is easily identified by the obvious presence of accretion signatures; as we demonstrate in Figure 3, it shows tremendous H emission ( angstroms) and significant emission from the CaII infrared triplet (-30.0, -31.8, and -25.4 angstroms at 8500, 8542, and 8664 angstroms). Several other emission line features indicate that a jet is being driven by the accretion process. The absence of absorption features makes it impossible to place an early limit on the star’s spectral type. Its band magnitude (), which should be least affected by optical veiling or NIR disk emission, is roughly consistent with other M0-M2 members, so we have assigned a preliminary spectral type of M1. Emission from the CaII infrared triplet indicates that 2M04315968+1821305 is accreting as well, but it lacks the forbidden emission lines that are present for 2M16075796-2040087.
4.2. Near-Infrared Spectroscopy
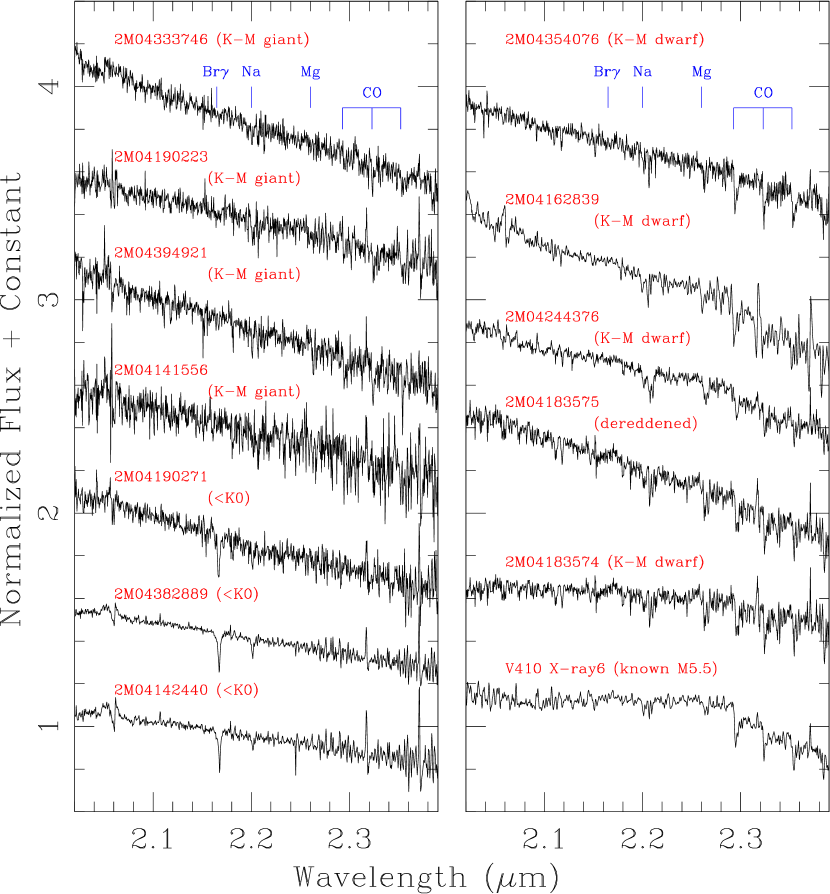
K-band spectra include several key features that are useful for stellar classification (e.g. Slesnick et al. 2004). The Br absorption line at 2.166 microns is ubiquitous for all stars with spectral types earlier than K, but disappears entirely by mid-K. Conversely, the CO absorption bandheads at 2.3 microns are present (with similar depths) for all late-type stars, but they start to weaken at mid-K and disappear entirely for stars earlier than late-G. Both Br and the CO bandheads can also appear in emission for young stars. A broad steam absorption band at 2 microns is also a key indicator for identifying M stars with low S/N spectra since it grows with decreasing temperature, though its depth is gravity sensitive; at a given spectral type, it is deeper for dwarfs than for giants. The depths of the Na and Mg doublets (at 2.2 and 2.26 microns) are also useful for distinguishing the luminosity classes of stars because they increase with surface gravity, though the identification requires good . Finally, our efforts are aided significantly by the faintness of our targets; any candidates with spectral types earlier than mid-M must fall significantly below the association sequence on an HR diagram.
We plot all of our K-band spectra in Figure 4, including a spectrum of the known member V410 X-ray 6 (M5.5) to demonstrate the expected morphology for young low-mass stars or brown dwarfs. Three of our candidate companions show clear Br absorption, indicating that the sources are background stars with early spectral types (K0). The other 8 targets all show some degree of absorption in the CO bandheads, indicating spectral types of K-M. However, seven of these targets clearly show no evidence of steam absorption, indicating that the sources are either background K-M giants or dwarfs with spectral types M1. In either case, all sources are too faint for their dereddened magnitudes to fall along the Taurus sequence, so we have divided them into giants or dwarfs based on the strength of their Na and Mg doublets. These classifications are preliminary due to the low S/N of many spectra, but they are sufficient to rule out the possibility of membership.
The eighth K-M star (2M04183574+2830254, the neighbor of V410 X-ray 2) is significantly reddened, which complicates its classification. Its NIR colors (, ) suggest a visual extinction of 20 (matching the value for V410 X-ray 2 itself, based on its 2MASS colors), so we removed this effect with the IRAF task deredden. As we show in Figure 4, the dereddened spectrum possesses significant Na and Mg absorption, but no steam absorption, suggesting that it is a field dwarf with spectral type M1 and that it is located behind the material that obscures V410 X-ray 2.
4.3. Astrometry
The other standard method for confirming candidate binary companions is to test for common proper motion. This test is less useful for young stars because other (gravitationally unbound) association members are also comoving to within the limits of our observational uncertainties. However, proper motion analysis can still be used to eliminate foreground and background stars that coincidentally fall along the association color-magnitude sequence but possess distinct kinematics.
In Table 6, we list the relative astrometric measurements for each candidate binary pair that we obtained from the literature and from our observations. We computed relative proper motions by using a weighted least squares fit to determine the relative motion in each dimension, rejecting the worst-fitting measurement if it differed from the fit by more than 3 (where is the observational error, not the dispersion in the fit). A cutoff of 3 in a bivariate normal distribution corresponds to a confidence level of 99%, so we do not expect many valid measurements to be flagged. We did not reject multiple measurements that differ by 3 because the high scatter could indicate an astrophysical source for the poor astrometric fit (such as further unresolved multiplicity).
In Table 7, we list the proper motions that we derived for each candidate companion. In Figure 5, we plot the relative proper motion of each candidate companion with respect to its corresponding known association member. For each association, there are two major concentrations: one group centered on the origin, corresponding to comoving young association members, and one group centered on the inverse proper motion for that association, corresponding to nonmoving background stars. There are also several objects which fall outside both concentrations, which could correspond to either independently moving field dwarfs or objects with erroneous astrometry. We also specifically mark those objects which were spectroscopically confirmed to be members or nonmembers; all 5 spectroscopic members and only 1 of 9 confirmed nonmembers fall in the cluster of sources centered on the origin (12 mas yr-1).
We find that 7 of the 15 candidates without spectra fall inside this limit, which suggests that no more than 1 of them is also comoving by chance. We therefore treat all candidates which are comoving to 12 mas yr-1 as likely companions and all other candidates as likely contaminants. We have opted not to use more rigorous selection criteria (based on our formal uncertainties) because the distribution of likely members seems too large for our uncertainties to be accurate, even among our spectroscopically confirmed subsample alone. Given the many astrophysical and observational sources of systematic uncertainty that can influence high-precision astrometry, all of our proper motion uncertainties are probably underestimated by a factor of 2 (the multiplier needed to bring our uncertainties in line with the observed scatter).
We list all of our membership assessments in Table 8, denoting likely companions and likely contaminants with ”Y?” and ”N?”, respectively. Spectroscopic membership analysis should generally supercede these determinations, and given the value of directly determining a companion’s stellar properties, followup observations for all of these likely companions should be a high priority. However, the existing data should suffice for studying the bulk properties of our sample.
| Known Member | Candidate Companion | Epoch | Sep | PA | Ref |
|---|---|---|---|---|---|
| (JD-2400000) | (mas) | (deg) | |||
| New | |||||
| 2M04080782+2807280 | 2M04080771+2807373 | 54069 | 950815 | 351.150.02 | Keck-NGS |
| DG Tau | 2M04270370+2606067 | 54434 | 1632229 | 235.350.11 | Palomar-NGS |
| GSC 06213-01459 | GSC 06213-01459 B | 54187 | 32132 | 306.30.02 | Keck-NGS |
| GSC 06784-00997 | 2M16101888-2502325 | 54188 | 48962 | 241.240.02 | Keck-NGS |
| GSC 06785-00476 | 2M15410726-2656254 | 54198 | 627010 | 82.650.1 | Palomar-NGS |
| RXJ 1555.8-2512 | 2M15554839-2512174 | 54198 | 887714 | 319.730.1 | Palomar-NGS |
| RXJ 1555.8-2512 | 2M15554788-2512172 | 54198 | 1452423 | 299.270.1 | Palomar-NGS |
| SCH161511.15-242015.56 | 2M16151239-2420091 | 54188 | 1788522 | 70.240.07 | Keck-LGS |
| SCH161825.01-233810.68 | 2M16182365-2338268 | 54199 | 2451050 | 229.870.12 | Palomar-Seeing |
| USco80 | 2M15583621-2348018 | 54188 | 1227423 | 15.590.04 | Keck-LGS |
| Archival | |||||
| 2M04080782+2807280 | 2M04080771+2807373 | 50781 | 943270 | 351.00.4 | 2MASS H |
| 2M04080782+2807280 | 2M04080771+2807373 | 50781 | 942070 | 350.70.4 | 2MASS J |
| 2M04080782+2807280 | 2M04080771+2807373 | 50781 | 941670 | 351.70.4 | 2MASS K |
| 2M04080782+2807280 | 2M04080771+2807373 | 35403 | 7850200 | 353.21.5 | USNOB B1 |
| 2M04080782+2807280 | 2M04080771+2807373 | 48896 | 8620200 | 351.01.3 | USNOB B2 |
| 2M04161885+2752155 | 2M04161754+2751534 | 50782 | 2806370 | 218.30.1 | 2MASS H |
| 2M04161885+2752155 | 2M04161754+2751534 | 50782 | 2803370 | 218.30.1 | 2MASS J |
| 2M04161885+2752155 | 2M04161754+2751534 | 48896 | 27760200 | 217.50.4 | USNOB B2 |
| 2M04161885+2752155 | 2M04161754+2751534 | 50337 | 27970200 | 218.70.4 | USNOB I2 |
| 2M04161885+2752155 | 2M04161754+2751534 | 35403 | 28630200 | 215.90.4 | USNOB R1 |
| 2M04161885+2752155 | 2M04161754+2751534 | 47827 | 28000200 | 218.30.4 | USNOB R2 |
Note. — The full version of this table will be available in the online version of ApJ.
| Known Member | Candidate Companion | Relative Motion | μ | |
|---|---|---|---|---|
| (mas yr-1) | ||||
| 2M04080782+2807280 | 2M04080771+2807373 | -7 | 24 | 3 |
| 2M04161885+2752155 | 2M04161754+2751534 | -15 | 27 | 5 |
| 2M04213460+2701388 | 2M04213331+2701375 | 6 | 17 | 4 |
| CFHT-Tau-21 | 2M04221757+2654364 | -11 | 5 | 3 |
| CFHT-Tau-7 | JH90 | -4 | 20 | 4 |
| DG Tau | 2M04270370+2606067 | 2 | 22 | 5 |
| FO Tau | 2M04382889+2611178 | -44 | 98 | 5 |
| FW Tau | 2M04292887+2616483 | -2 | 28 | 3 |
| GM Aur | 2M04551015+3021333 | -2 | 25 | 3 |
| HBC 427 | 2M04560252+3020503 | 58 | -83 | 5 |
| I04385+2550 | 2M04413842+2556448 | 8 | 23 | 4 |
| IS Tau | 2M04333467+2609447 | -10 | 33 | 4 |
| V710 Tau AB | 2M04315968+1821305 | -1 | 8 | 3 |
| GSC 06213-01459 | GSC 06213-01459 B | 0 | 8 | 5 |
| GSC 06784-00997 | 2M16101888-2502325 | -4 | 10 | 5 |
| GSC 06785-00476 | 2M15410726-2656254 | 0 | -12 | 4 |
| RXJ 1555.8-2512 | 2M15554788-2512172 | 16 | 19 | 5 |
| RXJ 1555.8-2512 | 2M15554839-2512174 | 6 | 11 | 5 |
| RXJ 1558.8-2512 | 2M15585415-2512407 | 10 | 19 | 3 |
| RXJ 1602.8-2401B | 2M16025116-2401502 | 11 | 3 | 5 |
| SCH160758.50-203948.90 | 2M16075693-2039424 | 19 | 21 | 4 |
| SCH161511.15-242015.56 | 2M16151239-2420091 | -4 | -2 | 4 |
| SCH161825.01-233810.68 | 2M16182365-2338268 | -6 | 43 | 5 |
| ScoPMS042b | 2M16102177-1904021 | 2.7 | 0.5 | 1 |
| ScoPMS048 | ScoPMS 048 B | -2 | 3.9 | 0.8 |
| UScoJ160245.4-193037 | 2M16024735-1930294 | 55 | -2 | 4 |
| UScoJ160700.1-203309 | 2M16065937-2033047 | -5 | 3 | 3 |
| UScoJ160936.5-184800 | 2M16093658-1847409 | 29 | 13 | 3 |
| UScoJ161031.9-191305 | 2M16103232-1913085 | -9 | -5 | 5 |
| USco80 | 2M15583621-2348018 | 1 | 0 | 3 |
Note. — As we discuss in Section 4.3, many of the proper motions that rely on high-precision astrometry could be more uncertain due to uncorrected systematic effects (such as detector distortion) and astrophysical jitter (such as from unresolved high-order multiplicity). A factor of 2 increase in the proper motion uncertainty would bring our uncertainties in line with the observed scatter.

4.4. Association Members and Background Stars
| Known Member | Candidate Companion | Spectroscopic | Astrometric | Final | Spectral | EW(H) |
|---|---|---|---|---|---|---|
| Determination | Determination | Determination | Class | |||
| 3 | ||||||
| 2M040807.82+280728.0 | 2M04080771+2807373 | N | N? | N | K0 III | 2.1 |
| 2M041618.85+275215.5 | 2M04161754+2751534 | N | N? | N | G5 III | 1.6 |
| 2M042134.60+270138.8 | 2M04213331+2701375 | .. | N? | N | .. | .. |
| 2M044144.89+230151.3 | 2M04414565+2301580 | Y | . | Y | M3 | -5.7 |
| CFHT-Tau-21 | 2M04221757+2654364 | N | Y? | N | A5 | 4.8 |
| CFHT-Tau-7 | 2M04321713+2421556 | N | N? | N | F5 | 5.5 |
| FW Tau | 2M04292887+2616483 | N | N? | N | G5 III | 1.5 |
| GM Aur | 2M04551015+3021333 | N | N? | N | K0 III | 1.8 |
| HBC 427 | 2M04560252+3020503 | N | N? | N | K0 III | 1.7 |
| I04158+2805 | 2M04185906+2812456 | N | .. | N | G0 III | 3 |
| I04385+2550 | 2M04413842+2556448 | .. | N? | N | .. | .. |
| JH 112 | 2M04324938+2253082 | Y | .. | Y | M4.5 | -22 |
| LkCa 15 | 2M04391795+2221310 | N | .. | N | K3 III | 1.3 |
| V410 X-ray1 | 2M04175109+2829157 | N | .. | N | A0 | 9.8 |
| V710 Tau AB | 2M04315968+1821305 | Y | Y? | Y | M3 | -120 |
| DENIS162041.5-242549.0 | 2M16204196-2426149 | N | .. | N | G-K V | 1.6 |
| GSC 06213-01459 | GSC 06213-01459 B | .. | Y? | Y | .. | .. |
| GSC 06784-00997 | 2M16101888-2502325 | .. | Y? | Y | .. | .. |
| GSC 06785-00476 | 2M15410726-2656254 | .. | Y? | Y | .. | .. |
| RXJ 1555.8-2512 | 2M15554839-2512174 | Y | Y? | Y | M2.5 | -6.6 |
| RXJ 1558.8-2512 | 2M15585415-2512407 | .. | N? | N | .. | .. |
| RXJ 1602.8-2401B | 2M16025116-2401502 | .. | Y? | Y | .. | .. |
| SCH160758.50-203948.90 | 2M16075693-2039424 | .. | N? | N | .. | .. |
| SCH160758.50-203948.90 | 2M16075796-2040087 | Y | .. | Y | M1 | .. |
| SCH161511.15-242015.56 | 2M16151239-2420091 | Y | Y? | Y | M4 | -14.8 |
| SCH161825.01-233810.68 | 2M16182365-2338268 | N? | N? | N | K V | -6.9 |
| SCH162135.91-235503.41 | 2M16213638-2355283 | N | .. | N | G-K V | .. |
| ScoPMS042b | 2M16102177-1904021 | .. | Y? | Y | .. | .. |
| ScoPMS048 | ScoPMS 048 B | .. | Y? | Y | .. | .. |
| UScoJ160245.4-193037 | 2M16024735-1930294 | .. | N? | N | .. | .. |
| UScoJ160700.1-203309 | 2M16065937-2033047 | Y | Y? | Y | M2.5 | -5.9 |
| UScoJ160936.5-184800 | 2M16093658-1847409 | .. | N? | N | .. | .. |
| USco80 | 2M15583621-2348018 | Y | Y? | Y | M3 | -9.9 |
| 3 | ||||||
| CFHT 4 | 2M04394921+2601479 | N | .. | N | K-M III | .. |
| CoKu Tau/3 | 2M04354076+2411211 | N | .. | N | K-M V | .. |
| DG Tau | 2M04270370+2606067 | .. | N? | N | .. | .. |
| DO Tau | 2M04382889+2611178 | N | .. | N | K | .. |
| FM Tau | 2M04141556+2812484 | N | .. | N | K-M V | .. |
| FO Tau | 2M04144741+2812219 | .. | N? | N | .. | .. |
| I04216+2603 | 2M04244376+2610398 | N | .. | N | K-M V | .. |
| IS Tau | 2M04333746+2609550 | N | .. | N | K-M III | .. |
| IS Tau | 2M04333467+2609447 | .. | N? | N | .. | .. |
| LkCa 4 | 2M04162839+2807278 | N | .. | N | K-M III | .. |
| MHO-Tau-2 | 2M04142440+2805596 | N | .. | N | K | .. |
| V410 X-ray 2 | 2M04183574+2830254 | N | .. | N | K-M V | .. |
| V410 X-ray 5a | 2M04190271+2822421 | N | .. | N | K | .. |
| X410 X-ray 6 | 2M04190223+2820039 | N | .. | N | K-M III | .. |
| GSC 06784-00039 | 2M16084438-2602139 | .. | .. | .. | .. | .. |
| RXJ 1555.8-2512 | 2M15554788-2512172 | .. | N? | N | .. | .. |
| UScoJ161031.9-191305 | 2M16103232-1913085 | .. | Y? | Y | .. | .. |
| Primary | Secondary | aaFor hierarchical multiple systems, we computed the mass ratio by summing the individual stellar masses in all sub-components of the wide ”primary” and ”secondary”. | |||
|---|---|---|---|---|---|
| () | () | () | (AU) | ||
| Known | |||||
| 2M04554757+3028077 | 2M04554801+3028050 | 0.20 | 0.14 | 0.70 | 915 |
| DH Tau | DI Tau | 0.64+0.044 | 0.64+(0.08) | 1.06 | 2208 |
| FS Tau | Haro 6-5B | 0.64+0.33 | 0.82 | 0.85 | 2883 |
| FV Tau | FV Tau/c | 0.82+(0.62) | 0.45+0.33 | 0.54 | 1782 |
| FZ Tau | FY Tau | 0.72 | 0.64 | 0.89 | 2490 |
| GG Tau Aab | GG Tau Bab | 0.72+0.60 | 0.14+0.044 | 0.14 | 1505 |
| GK Tau | GI Tau | 0.72+(0.027) | 0.82 | 1.09 | 1905 |
| HBC 352 | HBC 353 | 2.26 | 0.94 | 0.42 | 1301 |
| HBC 355 | HBC 354 | 1.2 | 1.2 | 1.00 | 915 |
| HN Tau A | HN Tau B | 0.82 | 0.22 | 0.27 | 450 |
| HP Tau-G2 | HP Tau | 2.49 | 0.94 | 0.38 | 3089 |
| HP Tau-G2 | HP Tau-G3 | 2.49 | 0.72+(0.10) | 0.33 | 1463 |
| HV Tau AB | HV Tau C | 0.50+(0.31) | 0.77 | 0.95 | 545 |
| J1-4872 Aab | J1-4872 Bab | 0.64+0.64 | 0.57+0.57 | 0.89 | 490 |
| LkHa332-G1 | LkHa332-G2 | 0.57+(0.57) | 0.60+0.45 | 0.92 | 3753 |
| MHO-Tau-1 | MHO-Tau-2 | 0.45 | 0.45 | 1.00 | 570 |
| UX Tau AC | UX Tau Bab | 1.20+0.40 | 0.50+(0.40) | 0.56 | 849 |
| UZ Tau Aab | UZ Tau Bab | 0.57+(0.16) | 0.50+0.40 | 1.23 | 516 |
| V710 Tau A | V710 Tau B | 0.60 | 0.50 | 0.83 | 439 |
| V773 Tau | 2M04141188+2811535 | 1.20+0.94+0.60+(0.58) | 0.09 | 0.027 | 3390 |
| V807 Tau | GH Tau | 0.82+0.50+(0.50) | 0.50+0.50 | 0.55 | 3157 |
| V928 Tau | CFHT-Tau-7 | 0.60+(0.60) | 0.12 | 0.10 | 2646 |
| V955 Tau | LkHa332-G2 | 0.74+0.45 | 0.60+0.45 | 0.88 | 1524 |
| XZ Tau | HL Tau | 0.50+0.33 | 0.82 | 0.99 | 3380 |
| RXJ1558.1-2405A | RXJ1558.1-2405B | 0.95+(0.14) | 0.13+(0.03) | 0.15 | 2632 |
| RXJ1604.3-2130A | RXJ1604.3-2130B | 1.12 | 0.49+(0.36) | 0.76 | 2352 |
| ScoPMS 052 | RXJ1612.6-1859 | 1.35+0.49 | 0.60 | 0.33 | 2764 |
| UScoJ160428.4-190441 | UScoJ160428.0-19434 | 0.36+(0.36) | 0.24 | 0.33 | 1417 |
| UScoJ160611.9-193532 A | UScoJ160611.9-193532 B | 0.13+0.13 | 0.13 | 0.50 | 1563 |
| UScoJ160707.7-192715 | UScoJ160708.7-192733 | 0.49+(0.08) | 0.24 | 0.42 | 3400 |
| UScoJ160822.4-193004 | UScoJ160823.2-193001 | 0.60 | 0.68 | 1.13 | 1953 |
| UScoJ160900.7-190852 | UScoJ160900.0-190836 | 0.68 | 0.13 | 0.19 | 2743 |
| UScoJ161010.4-194539 | UScoJ161011.0-194603 | 0.36 | 0.13 | 0.36 | 3711 |
| New | |||||
| 2M04414565+2301580 AbbSeveral newly-identified companions appear to be more massive than the known member, suggesting that the known member is the binary secondary. In cases where the known member had a generic name (i.e. USco80), we have appropriated that name for the new member to avoid name proliferation in the literature. For systems with coordinate-based names, we have used the 2MASS name of the new member to avoid confusion over coordinates. | 2M04414565+2301580 B | 0.40 | 0.027 | 0.07 | 1794 |
| JH112 A | JH112 B | 0.72 | 0.22 | 0.31 | 951 |
| V710 Tau AB | V710 Tau C | 0.60+0.50 | 0.40 | 0.36 | 4056 |
| GSC06213-01459 A | GSC06213-01459 B | 0.87 | (0.17) | 0.19 | 461 |
| GSC 06785-00476 A | GSC 06785-00476 B | 1.51 | (0.20) | 0.13 | 914 |
| GSC 06784-00997 A | GSC 06784-00997 B | 0.60 | (0.05) | 0.09 | 697 |
| RXJ1555.8-2512 A | RXJ1555.8-2512 B | 1.65 | 0.43 | 0.26 | 1292 |
| RXJ1602.8-2401B | RXJ1602.8-2401B | 0.95 | (0.11) | 0.12 | 1047 |
| 2M16075796-2040087 AbbSeveral newly-identified companions appear to be more massive than the known member, suggesting that the known member is the binary secondary. In cases where the known member had a generic name (i.e. USco80), we have appropriated that name for the new member to avoid name proliferation in the literature. For systems with coordinate-based names, we have used the 2MASS name of the new member to avoid confusion over coordinates. | 2M16075796-2040087 B | 0.7 | 0.074 | 0.10 | 3120 |
| 2M16151239-2420091 AbbSeveral newly-identified companions appear to be more massive than the known member, suggesting that the known member is the binary secondary. In cases where the known member had a generic name (i.e. USco80), we have appropriated that name for the new member to avoid name proliferation in the literature. For systems with coordinate-based names, we have used the 2MASS name of the new member to avoid confusion over coordinates. | 2M16151239-2420091 B | 0.24 | 0.074 | 0.31 | 2604 |
| ScoPMS042b A | ScoPMS042b B | 0.36 | (0.05) | 0.14 | 664 |
| ScoPMS048 A | ScoPMS048 B | 1.12+0.24 | (1.06) | 0.78 | 442 |
| 2M16065937-2033047 AbbSeveral newly-identified companions appear to be more massive than the known member, suggesting that the known member is the binary secondary. In cases where the known member had a generic name (i.e. USco80), we have appropriated that name for the new member to avoid name proliferation in the literature. For systems with coordinate-based names, we have used the 2MASS name of the new member to avoid confusion over coordinates. | 2M16065937-2033047 B | 0.49 | 0.43 | 0.88 | 1689 |
| UScoJ161031.9-191305 A | UScoJ161031.9-191305 B | 0.77 | (0.033) | 0.043 | 828 |
| USco80 AabbbSeveral newly-identified companions appear to be more massive than the known member, suggesting that the known member is the binary secondary. In cases where the known member had a generic name (i.e. USco80), we have appropriated that name for the new member to avoid name proliferation in the literature. For systems with coordinate-based names, we have used the 2MASS name of the new member to avoid confusion over coordinates. | USco80 B | 0.36+(0.36) | 0.24 | 0.33 | 1779 |
Note. — Masses for all members with known spectral types were estimated using the mass-SpT relations described in Section 3.5, while masses in parentheses (for sources without spectral types) were estimated using the estimated mass of the system primary and the measured flux ratio. The references for these flux ratios are listed in Tables 1 and 3. Our model-dependent masses are uncertain to 20%, and the mass ratios and projected separations have typical uncertainties of 10%. Finally, some hierarchical multiple systems have mass ratios 1, where the combined mass for all components of B is higher than that of A. We preserve the existing naming scheme for continuity, but will invert this mass ratio during our analysis (Section 5) to reflect that B is the most massive component.
In Table 8, we summarize our spectroscopic and astrometric membership assessments for each candidate young stars in our sample, along with the final membership assessments that we will use in our subsequent statistical arguments. We found that 11 of the 18 USco candidates and 3 of the 15 Taurus candidates with separations of 3-30 and flux ratios 3 are comoving young stars, while most of the candidates that we considered with more extreme flux ratios are not associated. We were not able to test the association of one USco candidates with a larger flux ratio, and even though another appears comoving, its faintness and the high density of stars in the direction of Upper Sco (and thus the bulge) suggests that cutting our statistical analysis at 3 would be prudent.
The total number of confirmed background stars (28 in Taurus and 9 in Upper Sco) is consistent within 2 with the number that we projected in our original survey (366 and 164). In Table 9, we list the stellar properties for each pair of newly-confirmed young stars, plus all of the pairs listed in Table 3; we derived these properties using the methods described in Section 3.4. The mass ratios for hierarchical triple systems were computed by summing all sub-components within each member of the wide pair.
5. The Properties of Wide Binary Systems
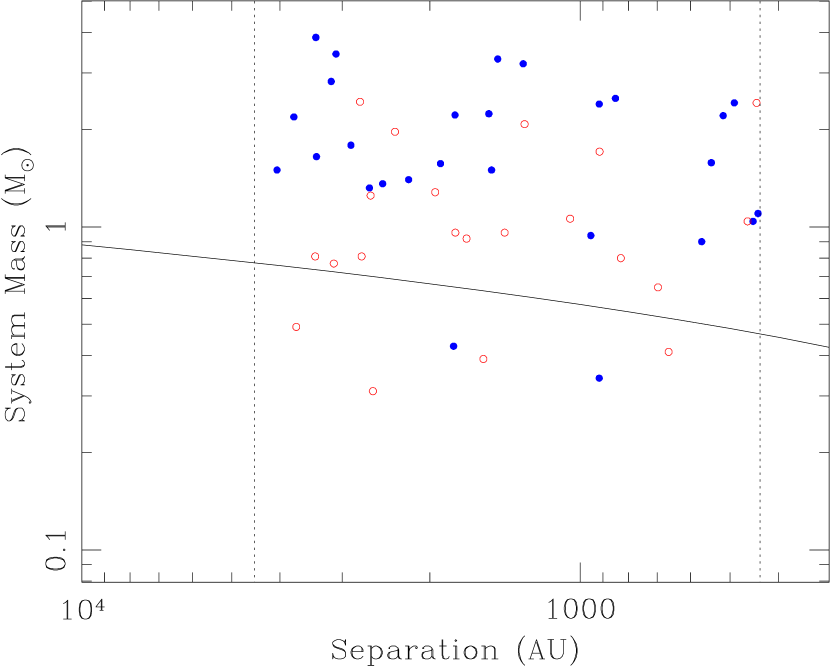
In the following subsections, we explore the implications of our survey of wide (500–5000) multiplicity. In Section 5.1, we examine the mass-dependent frequency of wide binary systems for each association and discuss the differences between Taurus and Upper Sco. In Sections 5.2 and 5.3, we examine the mass ratio distributions and separation distributions for each association and in two different mass ranges, then compare them to functional forms that might be expected. Finally, in Section 5.4, we examine the separation as a function of mass for our new binary systems and compare our sample to the empirical upper limit that has been suggested based on field multiplicity surveys.
As we described in our preliminary survey (KH07a, Section 3.3 and Figure 2) and in Section 4, our census of this separation range is complete for all candidate companions brighter than (15 in Taurus or 20 in Upper Sco), except for two candidate companions in Upper Sco with 3.75 (, if they are associated) that we were not able to observe. Our survey also could not reach fainter than 5.5 at separations of 3-5″ so it is possible that some close candidate companions with extreme mass ratios might have been missed around the highest-mass stars. However, there is only one such companion at separations 5″ in Taurus (2M04141188+2811535), which suggests that the probability is low. We note that there is one triple system (the nonhierarchical HP Tau-G2, HP Tau, and HP Tau-G3) where all three components fall in this separation range; we will treat HP Tau and HP Tau-G3 as independent companions to HP Tau-G2 for statistical purposes. There is also a probable triple system (the possibly hierarchical V955 Tau, LkHa332-G1, and LkHa332-G2) where LkHa332-G2 is 11″ away from V955 Tau and 26″ away from LkHa332-G1, but V955 Tau and LkHa332-G1 are 30″ apart. Since all three of these objects have very similar masses (1.05-1.20 , all being close binary pairs) and it’s not clear if the system is truly hierarchical, we will consider this triplet as a closer 11″ pair and a wider 26″ pair. Finally, for all hierarchical systems, we have treated each component of the wide pair as a single object with the summed mass of all sub-components.
5.1. The Mass Dependence of the Wide Binary Frequency
Field surveys have shown that the binary frequency and binary separation distribution both decline with decreasing mass, implying that the wide (500-5000 AU) binary frequency should strongly decline over the mass range of our sample. Our preliminary survey paper (KH07a) also found this trend at young ages, suggesting that it is a primordial effect. However, we also found the wide binary frequency for a given mass to be higher in the lowest-density regions, like Taurus and Chamaeleon-I, than in moderately denser regions like Upper Sco.
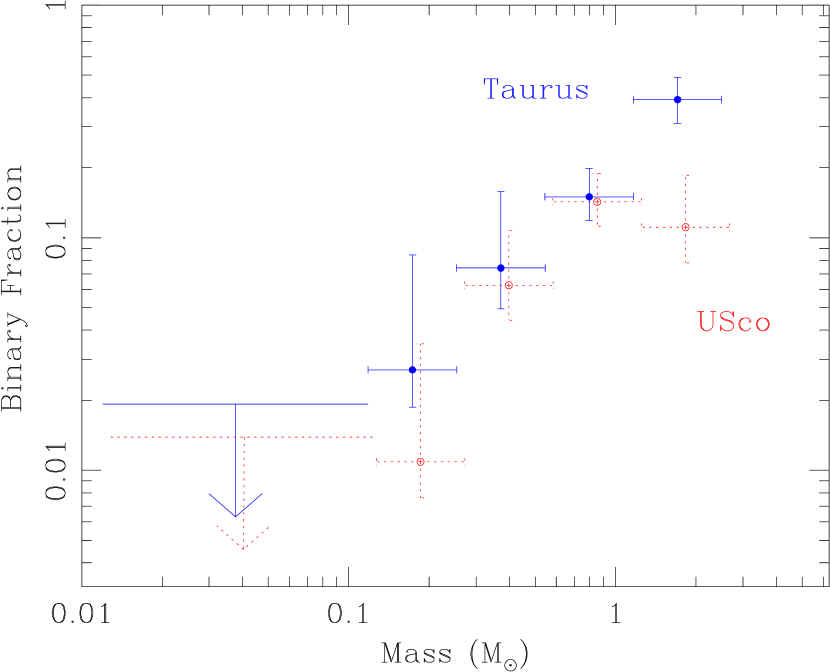
In Figure 6, we plot the mass-dependent binary frequency for four sets of masses in the stellar regime, plus all sources near and below the substellar boundary. The complete sample comprises all of the stars that we considered in our original survey (KH07a), with all confirmed binary systems drawn from Table 9 of this work. In both associations, the binary frequency clearly declines over the full mass range; we found frequencies of 10% for stars more massive than 1 , declining to upper limits of 1-2% in the substellar regime. This decline appears to be relatively smooth and monotonic in Taurus, but it is unclear whether Upper Sco features a shallower version of the decline or a more abrupt shift from a high value to a low value at 0.5 .
The binary frequency is similar across most of the mass range for these two associations. This result differs from our initial statistical sample, but adding additional systems with larger separations or mass ratios drove the two distributions closer together in our updated analysis. However, we have again found a significantly higher binary frequency among the highest-mass stars in Taurus as compared to their brethren in Upper Sco; this result was the only highly significant difference in our initial analysis, and our updated results find it to be a 4 effect.
This regional difference among the higher-mass stars in our sample is difficult to explain in terms of binary destruction processes. Dynamical disruption (perhaps due to a more crowded natal environment) should preferentially destroy low-mass binaries before high-mass binaries. The similarity between the two environments in the lower-mass regime seems to rule disruption out. However, observations of mass segregation at very young ages (e.g. Hillenbrand & Hartmann 1998; Sirianni et al. 2002) indicate that perhaps stars might be primordially mass-segregated, with higher-mass stars forming preferentially in denser parts of their natal environment. Binary disruption in these denser regions should be significantly enhanced as compared to the sparse outer reaches of a collapsing molecular cloud. High-mass stars are significantly less common than their lower-mass counterparts, so even if these dense central areas also caused the disruption of lower-mass binaries, it might not be strongly reflected in the overall binary population (which could be dominated by a majority of systems that form outside the densest concentrations).
5.2. The Mass Ratio Distribution of Wide Binaries
Field surveys have also suggested that the mass ratio distribution varies significantly with primary mass. DM91 found that G dwarfs tend to have lower mass companions (with a modal mass ratio of 0.3), while surveys of M dwarfs by FM92 and RG97 found a flat distribution and several recent surveys of brown dwarfs (e.g. Close et al. 2003; Burgasser et al. 2003; Bouy et al. 2003) found that their mass ratios are sharply peaked toward unity. By contrast, surveys of young associations have found that flat mass ratio distributions seem to dominate across a range of system masses, from 2 to at least as low as 0.5 (e.g. Kraus et al. 2008 for Upper Sco), though a distribution biased toward unity seems to be universal among the lowest-mass stars and brown dwarfs (Kraus et al. 2006; Ahmic et al. 2007).
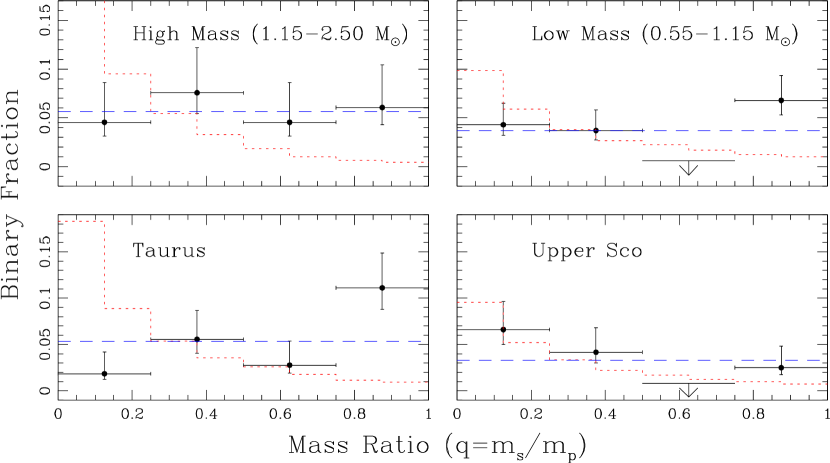
In Figure 7, we plot the mass ratio distribution for four subsets of our sample. In the top panels, we show the distribution spanning both associations for the highest-mass bin (1.15-2.50 ) as compared to the intermediate-mass bin (0.55-1.15 ), while in the bottom panels, we show the distribution for both mass bins as determined individually in Taurus and Upper Sco. We also show two possible mass ratio distributions: a flat distribution and a distribution where companions are randomly drawn from the IMF. We adopted our IMF from the spectroscopic membership surveys of Upper Sco by Preibisch et al. (1998, 2002) and Slesnick et al. (2006a); this function is defined as a broken power law (Scalo 1998; Kroupa 2002): , where for , for , and for . This broken power law mass function is rougly equivalent to the continuous log-normal mass function that has also been suggested (Miller & Scalo 1979; Chabrier 2001). Several other possible mass ratio distributions have been suggested, including a truncated Gaussian (DM91) and a log-normal distribution (Kraus et al. 2008), but the first has been largely discounted by now and the latter does not differ significantly from a flat distribution given our sample size. The wider array of possible mass ratio distributions has been summarized and weighed by Kouwenhoven et al. (2009), but our sample size does not allow most of the fine distinctions found in that paper.
We have found that drawing companions from the IMF produces a very poor fit in most cases; a one-sample Kolmogorov-Smirnov test finds a normalized maximum difference (with respect to the model) of for the high-mass subset (1.15-2.50 ), for the intermediate-mass subset (0.55-1.15 ), for the Taurus subset, and for the Upper Sco subset. The first three results all imply disagreement at 99%, but the Upper Sco subset (which is smallest, ) is not inconsistent (80%). The flat distribution yields , , , and , respectively, or confidence values of 80%, 90%, 99%, and 99%. The goodness of fit for the Upper Sco subsample is significantly worse than for the IMF-derived distribution, but the others all have better goodness of fit (though the low-mass and Taurus results still indicate disagreement).
Our results for Taurus and for both mass ranges are similiar to those that we reported for close binaries in Upper Sco (Kraus et al. 2008), with similar-mass companions typically over-represented compared to the IMF. Our results for wide binaries in Upper Sco show little evidence of this trend, but the sample is also smaller than for Taurus. We also note that among the low-mass subsample, Taurus binaries have predominantly similar masses (9/12 with 0.75) while Upper Sco binaries tend to have low-mass secondaries (6/11 with 0.25). Dividing the sample this finely reduces the significance of our results even further, especially since most of the solar-type stars in Upper Sco remain unidentified and the current census could be subject to some unknown bias, but this difference in the mass ratio distributions presents an intriguing hint of an environmental effect. As a whole, though, our results argue against a mechanism that forms binaries via random pairing, including their formation in entirely separate cloud cores. Our results also suggest that the masses of binary companions could be selected via a similar process across a wide range of separations, given that the mass ratio distribution is mostly similar at separations spanning 5 to 5000 AU.
Finally, we note that this distribution could be replicated by forming wide binaries out of small-N clusters, since dynamical interactions could force out the lower-mass members and leave the two highest-mass members as a bound pair. However, other features of pre-main sequence stars place strict limits on the amount of dynamical sculpting in these early groups. Most young stars in this mass range have disks at ages of 1-2 Myr, including many wide binary components (e.g. Furlan et al. 2006; Scholz et al. 2006), which suggests that they have not been involved in any energetic interactions. Also, many lower-mass stars (0.4-0.7 ) are found in binaries with separations of 10-500 AU (e.g. Kraus et al. 2008), and few such binaries would survive in a dynamically active environment. These observations seem to suggest that a dynamical solution can not simultaneously satisfy all of the data.
5.3. The Separation Distribution of Wide Binaries
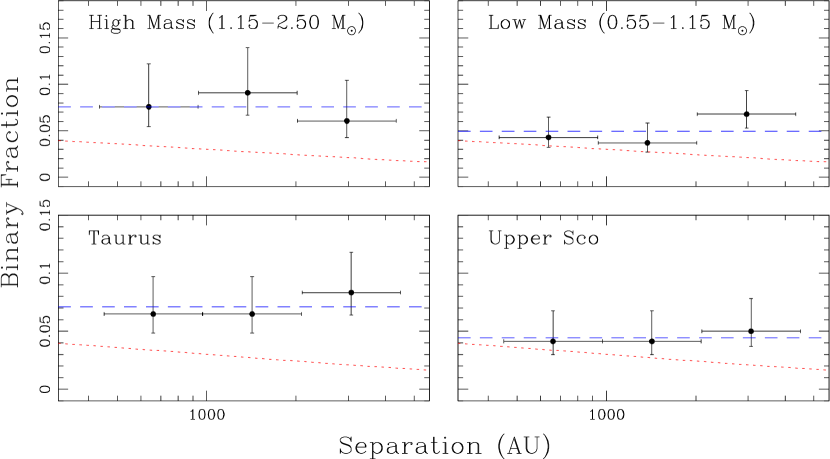
Finally, the binary parameter that varies most distinctly among field systems is the separation distribution. DM91 found that G dwarfs have a mean separation of 30 AU and some systems are as wide as 104 AU, while the recent substellar surveys have found a mean separation of 4 AU and very few systems wider than 20 AU, and the M dwarf surveys of FM92 and RG97 seem to suggest intermediate properties. Our results for smaller separations in Upper Sco (Kraus et al. 2008) are not strongly indicative because that survey spanned the peak of the DM91 distribution (where it is approximately flat in log-separation), but it appears that there is no significant difference in the separation distribution between 0.5 and 2 across a range of 5-500 AU. In Figure 8, we plot the separation distribution of our sample of wide binary systems, spanning separations of 500-5000 AU, as well as the separation distribution suggested by DM91 (a log-normal function) and a log-constant distribution. As for Figure 7, we compare our high-mass and intermediate-mass samples (top) and our Taurus and Upper Sco samples (bottom).
In all cases, it appears that the companion frequency increases or is flat with increasing separation. When we test the log-constant distribution with a one-sample Kolmogorov-Smirnov test, we typically find good agreement with normalized maximum cumulative differences of , , , and for the high-mass, low-mass, Taurus, and Upper Sco subsets. In all cases, the confidence level is 85%. This is not unexpected; our results for two-point correlation functions indicate that the separation distribution function is approximately log-flat out to even larger separations (20,000 AU; Kraus & Hillenbrand 2008). Kouwenhoven et al. (2007) also reported that the log-flat separation distribution produces a satisfactory fit for higher-mass binaries in Sco-Cen.
When we test the DM91 separation distribution with a one-sample Kolmogorov-Smirnov test, we find results that are less consistent, but not necessarily inconsistent: , , , and . The high-mass, Taurus, and Upper Sco subsamples are not inconsistent (85%), but the low-mass sample disagrees at 96%. However, given our results for two-point correlation functions that support the log-flat distribution conclusively at larger separations, we find it preferable to the log-normal distribution. We also note that the DM91 distribution is independently normalized by the DM91 binary frequency, and K-S tests ignore the binary frequencies by implicitly renormalizing them to the same value. It is illustrative to preserve this normalization by using a 2 test. We found fit parameters of for the high-mass subset, for the low-mass subset, for the Taurus subset, and for the Upper Sco subset. The high-mass and Taurus subsets disagree at very high confidence (99.9%, while the low-mass subset disagrees at 99% and the Upper Sco subset disagrees at 90%. We therefore confirm the well-known result that the DM91 binary frequency is less than the binary frequency for these young stellar populations, indicating that binary companions are over-abundant with respect to the field (e.g. Ghez et al. 1994; Kouwenhoven et al. 2007).
The presence of a log-flat primordial separation distribution suggests that the field separation distribution may be a result of post-natal dynamical evolution. The stars in these associations should escape to the field with no further sculpting, and the dynamical simulations of Weinberg et al. (1987) suggest that the field stellar density is too low to affect binaries closer than AU. However, it has been suggested that many (or perhaps even most) stars are born in much denser clusters (Lada & Lada 2003), though there are also arguments to the contrary (Adams & Myers 2001). If this model is true, then the majority of stars could linger in a relatively high-density environment for up to several Gyr. Observations suggest that the cluster environment is typically dense enough to remove most of the binaries with separations of 100 AU (e.g. Praesepe, Patience et al. 2002; Coma Ber, Kraus et al., in prep).
Therefore, the field population almost certainly represents a mix of binary populations, a suggestion discussed by Kroupa (1998) and Kroupa et al. (1999). Those stars which are born in T associations and OB associations enter the field almost immediately, with their wide binary population nearly intact. In contrast, stars that form in clusters are stripped of their outer binary companions, with the degree of stripping depending on the density of the cluster environment, the density evolution over time, and the elapsed time until a typical star is tidally removed and joins the field (Kroupa et al. 2001; Kroupa & Bouvier 2003). A survey of wide binary systems in young clusters like the ONC or IC348 should directly reveal this sculpting process, but the crowded environment makes it difficult to distinguish bound binary systems from chance alignments (e.g. Simon 1997; Köhler et al. 2006).
We must add a caveat that the primordial multiplicity of dense clusters is still not well-constrained for wide separations, especially at 500 AU where it is impossible to distinguish bound companions from chance alignments. The absence of wide binary systems in open clusters does not necessarily indicate that they form and are disrupted; a primordial deficiency of wide binary systems could also explain the data. Studies of the ONC by Köhler et al. (2006) and Reipurth et al. (2007) find that the binary frequency at smaller separations (60–600 AU) is a factor of 2 lower than in Taurus-Auriga and Sco-Cen, though low number statistics forced their measurements to span a wide range of primary masses that might not be equally represented in the surveys of closer associations. Köhler et al. further suggest that there is little evidence of a density dependence between the core and halo of the ONC, arguing against a dynamical origin of the lower binary frequency. However, the larger sample studied by Reipurth et al. shows a steep decrease in the separation distribution at 225 AU that is most pronounced in the cluster core, indicating a possible signature of dynamical disruption for wider binary systems. In addition, both of these results depend on the membership census of the ONC (e.g. Jones & Walker 1988; Hillenbrand 1997), which is still uncertain for many candidates.
The most compelling argument for an environmental difference in the primordial binary properties was set forth by Durisen & Sterzik (1994) and Sterzik et al. (2003), who predicted that regions with a higher gas temperature should have a binary separation distribution that is biased to smaller values. One source of this heating could be nearby high-mass stars, which would naturally predict the absence of high-mass binary systems in dense clusters with numerous OB stars. However, feedback from these high-mass stars should dispel the natal gas and shut down star formation, so delicate timing would be required in order for this effect to play a significant role. An indirect test of the primordial binary properties was attempted by Kroupa et al. (1999) by using N-body simulations to evolve several candidate proto-ONC clusters forward to the present day. They concluded that in order to fit the current dynamical state, a binary frequency lower than in Taurus-Auriga was required. However, they only tested six model populations, so their simulation results could include significant degeneracy between choices of parameters. There have also been numerous observational advances in the past decade, and the simulated results of Kroupa et al. should be confronted with these new findings.
Finally, if the separation distribution is truly log-flat for Taurus and Upper Sco, then there is at most a moderate decrement with respect to the binary separation distribution at smaller separations. Our previous high-resolution imaging survey of Upper Sco (Kraus et al. 2008) found that for separations of 5-500 AU and primary masses of 0.5-2.0 , the binary frequency is 19% per decade of separation. In our wide binary sample spanning 500-5000 AU, the corresponding frequencies are 23% for the high-mass subsample, 15% for the low-mass subsample, 21% for the Taurus subsample, and 13% for the Upper Sco subsample. A comprehensive multiplicity survey of Taurus will be required to place these statistics in context, but we find it intriguing that the binary frequency is so similar across three decades of separation (or 9 decades of mean density in the original cloud core). Either a single binary formation process operates across the full range of length scales, or several binary formation processes all yield similar frequencies.
5.4. Unusually Wide Binary Systems
As we described above, the separation distribution in the field seems to be strongly mass-dependent. Field surveys also suggest an empirical relation between the total mass of a system and its maximum possible separation, where the relation is logarithmic in the solar-mass regime ( if 0.3 ; Reid et al. 2001) and quadratic in the low-mass regime ( if 0.3 ; Burgasser et al. 2003). This relation also provides a good working definition for what might be considered an “unusually wide” binary system; many such systems have been reported in nearby star-forming regions, but the absence of a rigorous definition has led to much confusion regarding their true uniqueness.
Our results suggest that the binary frequency is strongly mass-dependent for young stars, but the form of the separation distribution may not change significantly. If the field - relation is genuinely primordial, then our separation-limited (500-5000 AU) sample should include no binary systems with masses of 0.5 and a limited range of separations for 0.50.8 . However, if the field star population (which mostly forms in clusters) is sculpted by post-natal dynamical interactions in those clusters, then these limits might not be present in our sample.
In Figure 9, we plot the projected separation and total mass of each of the systems in our survey, plus the empirical - relation observed in the field. As we noted in the previous section, there is a genuine paucity of wide systems among the lowest-mass members, so any additional systems discovered with 0.3 should be considered genuinely “unusual”. However, we see six intermediate-mass systems that seem to exceed this limit, and no evidence of an outer envelope. Our sample includes six systems that all have a total mass of 0.3-0.4 , and even they seem to span the full separation range of our survey. Some of these systems could be chance alignments of two low-mass stars, but this number must be small because there are none among the least-massive third of our sample (0.3 ). Based on our analysis of the associations’ two-point correlation functions (Kraus & Hillenbrand 2008), we expect 2 chance alignments in Upper Sco and 1 chance alignments in Taurus for all unassociated pairs of members with 0.4 , whereas we actually observe four and two, respectively. We would also expect chance alignments to be concentrated at the largest separations, not distributed evenly in logarithmic separation, and to include more pairs with a total mass 0.3 .
Our survey shows that in a dynamically unevolved population like Taurus or Upper Sco, 6% (Taurus 2/31, USco 4/65) of all single stars or binary systems with a total mass of 0.250.50 have a companion with a projected separation of 500–5000 AU. As a result, at least this many systems exceed the field - limit. By contrast, 0.4% (Taurus 0/89, USco 0/167) of all binary systems or single stars with a total mass of 0.25 have such a wide companion. The first result implies that the field - relation is another consequence of dynamical sculpting for the majority of field stars that form in dense clusters. Systems with lower binding energy are more prone to disruption in a dense environment, so high-mass systems can maintain wider binary components than their lower-mass brethren. However, dynamical sculpting can not explain the sharp paucity of primordial wide systems below 0.3 , or that wide systems seem to decline rapidly in frequency below 0.7-0.8 . This result could indicate a critical mass limit for large-scale fragmentation of a collapsing cloud core.
6. Summary
In this paper, we have presented an astrometric and spectroscopic followup campaign to confirm the youth and association of a complete sample of wide binary companions to intermediate- and low-mass stars (2.50.02 . Our survey found fifteen new wide binary companions with separations of 3-30″ (500–5000 AU), 3 in Taurus and 12 in Upper Sco, raising the total number of such systems to 49. Our survey should be complete for all companions with masses 15-20 and mass ratios 0.02-0.04.
In some respects, this wide binary population conforms to expectations from field multiplicity surveys; higher-mass stars have a higher frequency of wide binary companions, and there is a marked paucity of wide binary systems near and below the substellar regime. However, this wide binary population also deviates significantly from other established properties of field binary systems. The separation distribution appears to be nearly log-flat across a very wide range of separations (5-5000 AU), and the mass ratio distribution seems more biased toward similar-mass companions than would be expected for an IMF-shaped distribution or from the field G-dwarf distribution. Finally, the maximum binary separation also shows markedly different behavior, with no evidence of a mass-dependent separation limit for system masses 0.3 and abrupt cessation of any wide binary formation (for separations 500 AU) below this limit.
We attribute these differences to the post-natal dynamical sculpting that occurs for most field systems. All of the systems in our sample, which come from unbound low-density associations, will escape to the field without further dynamical evolution. However, most stars seem to form in denser clusters; even if a wide binary population forms for these stars, it will most likely be stripped before the stars can escape into the field. This explanation suggests that the properties of wide binary systems in the field are not representative of their formation process.
Finally, we note that wide (500-5000 AU) binary systems with total masses of 0.3 appear to be very rare at all ages, suggesting that any system in this range of parameter space is indeed “unusually wide”. However, additional followup is required to determine the true total mass of a system, as there are many hierarchical multiple systems (e.g. USco80 and UScoJ160611.9-193533) that could masquerade as “unusually wide low-mass binaries” until AO and radial velocity surveys discover their higher-order multiplicity.
References
- Adams & Myers (2001) Adams, F. & Myers, P. 2001, ApJ, 553, 744
- Ahmic et al. (2007) Ahmic, M., Jayawardhana, R., Brandeker, A., Scholz, A., van Kerkwijk, M., Delgado-Donate, E., & Froebrich, D. 2007, ApJ, 671, 2074
- Allen & Strom (1995) Allen, L. & Strom, S. 1995, AJ, 109, 1379
- Ardila et al. (2000) Ardila, D., Martín, E., & Basri, G. 2000, AJ, 120, 479
- Baraffe et al. (1998) Baraffe, I., Chabrier, G., Allard, F. & Hauschildt, P.H. 1998, A&A, 337, 403
- Bate et al. (1998) Bate, M., Clarke, C., & McCaughrean, M. 1998, MNRAS, 297, 1163
- Bessell & Brett (1988) Bessell, M. & Brett, J. 1988,PASP, 100, 1134
- Boden et al. (2007) Boden, A. et al. 2007, ApJ, 670, 1214
- Bonnarel et al. (2000) Bonnarel, F. et al. 2000, A&AS,143, 33
- Bouy et al. (2003) Bouy, H., Brandner, W., Martín, E., Delfosse, X., Allard, F., & Basri, G. 2003, AJ, 126, 1526
- Bouy et al. (2007) Bouy, H., Huelamo, N., Martín, E., Barrado y Navascues, D., Sterzik, M., & Pantin, E. 2007, A&A, 463, 641
- Briceno et al. (1998) Briceno, C., Hartmann, L., Stauffer, J., & Martín, E. 1998, AJ, 115, 2074
- Burgasser et al. (2003) Burgasser, A., Kickpatrick, J.D., Reid, I.N., Brown, M., Miskey, C., & Gizis, J. 2003, ApJ, 125, 850
- Caballero et al. (2006) Caballero, J., Martín, E., Dobbie, P., & Barrado y Navascues, D. 2006, A&A, 460, 635
- Cameron et al. (2009) Cameron, P.B., Britton, M., & Kulkarni, S. 2009, AJ, 137, 83
- Cameron (2008) Cameron, P.B. 2008, PhDT
- Carpenter (2001) Carpenter, J. 2001, AJ, 121, 2851
- Chabrier (2001) Chabrier, G. 2001, ApJ, 554, 1274
- Chauvin et al. (2004) Chauvin, G., Lagrange, A., Dumas, C., Zuckerman, B., Mouillet, D., Song, I., Beuzit, J., & Lowrance, P. 2004, A&A, 425, 29
- Close et al. (2003) Close, L., Siegler, N., Freed, M., & Biller, B. 2003, ApJ, 587, 407
- Close et al. (2007) Close, L. et al. 2007, ApJ, 660, 1492
- Correia et al. (2006) Correia, S., Zinnecker, H., Ratzka, Th., & Sterzik, M. 2006, A&A, 459, 909
- de Zeeuw et al. (1999) de Zeeuw, P., Hoogerwerf, R., de Bruijne, J., Brown, A., & Blaauw, A. 1999, AJ, 117, 354
- Deacon & Hambly (2007) Deacon, N. & Hambly, N. 2007, A&A, 468, 163
- Duchene et al. (1999) Duchene, G., Monin, J.-L., Bouvier, J., & Menard, F. 1999, A&A, 351, 954
- Duquennoy & Mayor (1991) Duquennoy, A. & Mayor, M. 1991, A&A, 248, 485
- Durisen & Sterzik (1994) Durisen, R. & Sterzik, M. 1994, A&A, 286, 84
- Elmegreen (2008) Elmegreen, B. 2008, ApJ, 672, 1006
- Epchtein et al. (1999) Epchtein, N. et al. 1999, A&A, 349, 236
- Fischer & Marcy (1992) Fischer, D. & Marcy, G. 1993, ApJ, 396, 178
- Frink et al. (1997) Frink, S., Roser, S, Neuhauser, R., & Sterzik, M. 1997, A&A, 325, 613
- Furlan et al. (2006) Furlan, E. et al. 2006, ApJS, 165, 568
- Ghez et al. (1993) Ghez, A., Neugebauer, G., & Matthews, K. 1993, AJ, 106, 2005
- Ghez et al. (2008) Ghez, A. et al. 2008, ApJ, 689, 1044
- Gomez et al. (1993) Gomez, M., Hartmann, L., Kenyon, S., & Hewett, R. 1993, AJ, 105, 1927
- Guenther et al. (2007) Guenther, E., Esposito, M., Mundt, R., Covino, E., Alcala, J., Cusano, F., & Stecklum, B. 2007, A&A, 467, 1147
- Hambly et al. (2001) Hambly, N. et al. 2001, MNRAS, 326, 1279
- Hartigan et al. (1994) Hartigan, P., Strom, K., & Strom, S. 1994, ApJ, 427, 961
- Hartigan & Kenyon (2003) Hartigan, P. & Kenyon, S. 2003, ApJ, 583, 334
- Hewett (1981) Hewett, P. 1982, MNRAS, 201, 867
- Hillenbrand (1997) Hillenbrand, L. 1997, AJ, 113, 1733
- Hillenbrand & Hartmann (1998) Hillenbrand, L. & Hartmann, L. 1998, ApJ, 492, 540
- Hillenbrand & White (2004) Hillenbrand, L. & White, R. 2004, ApJ, 604, 741
- Itoh et al. (2005) Itoh, Y. et al. 2005, ApJ, 620, 984
- Jayawardhana & Ivanov (2006) Jayawardhana, R. & Ivanov, V. 2006, Science, 313, 1279
- Jones & Walker (1988) Jones, B. & Walker, M. 1988, AJ, 95, 1755
- Kenyon & Hartmann (1995) Kenyon, S. & Hartmann, L. 1995, ApJS, 101, 117
- Kim et al. (2005) Kim, S., Figer, D., Lee, M., & Oh, S. 2005, PASP, 117, 445
- Kiminki et al. (2007) Kiminki, D. et al. 2007, ApJ, 664, 1102
- Köhler et al. (2000) Köhler, R. et al. 2000, A&A, 356, 541
- Köhler et al. (2006) Köhler, R., Petr-Gotzens, M., McCaughrean, M., Bouvier, J., Duchêne, G., Quirrenbach, A., & Zinnecker, H. 2006, A&A, 458, 461
- Kouwenhoven et al. (2007) Kouwenhoven, M.B.N., Brown, A.G.A., & Kaper, L. 2007, A&A, 464, 581
- Kouwenhoven et al. (2009) Kouwenhoven, M.B.N., Brown, A.G.A., Goodwin, S.P., Portegies Zwart, S.F., & Kaper, L. 2009, A&A, 493, 979
- Kraus & Hillenbrand (2007a) Kraus, A. & Hillenbrand, A. 2007, ApJ, 662, 413 (KH07a)
- Kraus & Hillenbrand (2007b) Kraus, A. & Hillenbrand, A. 2007, ApJ, 664, 1167
- Kraus et al. (2008) Kraus, A., Ireland, M., Martinache, F., & Lloyd, J. 2008, ApJ, in press
- Kroupa (1998) Kroupa, P. 1998, MNRAS, 298, 231
- Kroupa et al. (1999) Kroupa, P., Petr, M., & McCaughrean, M. 1999, New Astronomy, 4, 495
- Kroupa et al. (2001) Kroupa, P., Aarseth, S., & Hurley, J. 2001, MNRAS, 321, 699
- Kroupa (2002) Kroupa, P. 2002, Science, 295, 82
- Kroupa & Bouvier (2003) Kroupa, P. & Bouvier, J. 2003, /mnras, 346, 343
- Kunkel (1999) Kunkel, M. 1999, PhDT
- Lada & Lada (2003) Lada, J. & Lada, E. 2003, ARA&A, 41, 57
- Larson (1995) Larson, R. 1995, MNRAS, 272, 213
- Leinert et al. (1993) Leinert, Ch. et al. 1993, A&A, 278, 129
- Luhman & Rieke (1998) Luhman, K. & Rieke, G. 1998, ApJ, 497, 354
- Luhman (1999) Luhman, K. 1999, ApJ, 525, 466
- Luhman (2000) Luhman, K. 2000, ApJ, 544, 1044
- Luhman et al. (2003) Luhman, K., Stauffer, J., Muench, Al, Rieke, G., Lada, E., Bouvier, J., & Lada, C. 2003, ApJ, 593, 1093
- Luhman (2004) Luhman, K. 2004, ApJ, 617, 1216
- Luhman et al. (2006a) Luhman, K. et al. 2006a, ApJ, 649, 894
- Luhman et al. (2006b) Luhman, K., Whitney, B., Meade, M., Babler, B., Indebetouw, R., Bracker, S., & Churchwell, E. 2006b, ApJ, 647, 1180
- Luhman (2006) Luhman, K. 2006, ApJ, 645, 676
- Luhman et al. (2007) Luhman, K., Allers, K., Jaffe, D., Cushing, M., Williams, K., Slesnick, C., & Vacca, W. 2007, ApJ, 659, 1629
- MacConnell et al. (1992) MacConnell, D., Wing, R., & Costa, E. 1992, AJ, 104, 821
- Martín et al. (2001) Martín, E., Dougados, C., Magnier, E., Menard, F., Magazzu, A., Cuillandre, J., & Delfosse, X. 2001, ApJ, 561, 195
- Martín et al. (2004) Martín, E., Delfosse, X., & Guieu, S. 2004, AJ, 127, 449
- Massarotti et al. (2005) Massarotti, A., Latham, D., Torres, G., Brown, R., & Oppenheimer, B. 2005,AJ, 129, 2294
- Massey et al. (1988) Massey, P., Strobel, K., Barnes, J., & Anderson, E. 1988, ApJ, 328, 315
- Metchev (2005) Metchev, S. 2005, PhD thesis(http://etd.caltech.edu/etd/available/etd-08262005-160055/)
- Miller & Scalo (1979) Miller, G. & Scalo, J. 1979, ApJS, 41, 513
- Monet et al. (2003) Monet, D. et al. 2003, AJ, 125, 984
- Oke & Gunn (1982) Oke, B. & Gunn, J. 1982, PASP, 94, 586
- Padgett et al. (2006) Padgett, D. et al. 2006, BAAS, 209, 3016
- Patience et al. (2002) Patience, J. et al. 2002, AJ, 123, 1570
- Peebles (1980) Peebles, J. 1980, The Large Scale Structure of the Universe (Princeton: Princeton Univ. Press)
- Prato et al. (2002a) Prato, L., Simon, M., Mazeh, T., McLean, I., Norman, D., & Zucker, S. 2002a, ApJ, 569, 863
- Prato et al. (2002b) Prato, L., Simon, M., Mazeh, T., Zucker, S., & McLean, I. 2002b, ApJ, 579, 99
- Prato et al. (2007) Prato, L. 2007, ApJ, 657, 338
- Preibisch et al. (1998) Preibisch, T., Guenther, E., Zinnecker, H., Sterzik, M., Frink, S., & Roeser, S. 1998, A&A, 333, 619
- Preibisch et al. (2001) Preibisch, T. et al. 2001, AJ, 121, 1040
- Preibisch et al. (2002) Preibisch, T. et al. 2002, AJ, 124, 404
- Reid & Gizis (1997) Reid, I.N. & Gizis, J. 1997, AJ, 113, 2246
- Reid et al. (2001) Reid, I., Gizis, J., Kirkpatrick, J., & Koerner, D. 2001, AJ, 121, 489
- Reipurth et al. (2007) Reipurth, B., Guimarães, M., Connelley, M., & Bally, J. 2007, AJ, 134, 2272
- Salim & Gould (2003) Salim, S. & Gould, A. 2003, ApJ, 582, 1011
- Scalo (1998) Scalo, J. 1998, in APS Conf. Ser. 142, The Stellar Initial Mass Function, ed. G. Gilmore & D. Howell (San Francisco:ASP), 201
- Scholz et al. (2006) Scholz, A., Jayawardhana, R., & Wood, K. 2006, ApJ, 645, 1498
- Simon et al. (1995) Simon, M. et al. 1995, ApJ, 443, 625
- Simon et al. (1996) Simon, M., Holfeltz, S., Taff, L. 1996, ApJ, 469, 890
- Simon (1997) Simon, M. 1997, ApJ, 482, 81
- Simon et al. (2000) Simon, M., Dutrey, A., & Guilloteau, S. 2000, ApJ, 545, 1034
- Sirianni et al. (2002) Sirianni, M., Nota, A., De Marchi, G., Leitherer, C., & Clampin, M. 2002, ApJ, 579, 275
- Skrutskie et al. (2006) Skrutskie, M. et al. 2006, AJ, 131, 1163
- Slesnick et al. (2004) Slesnick, C., Hillenbrand, L., & Carpenter, J. 2004, ApJ, 610, 1045
- Slesnick et al. (2006a) Slesnick, C., Carpenter, J., & Hillenbrand, L. 2006a, AJ, 131, 3016
- Slesnick et al. (2006b) Slesnick, C., Carpenter, J., Hillenbrand, L., & Mamajek, E. 2006b, AJ, 132, 2665
- Stapelfeldt et al. (2003) Stapelfeldt, K., Menard, F., Watson, A., Krist, J., dougados, C., Padgett, D., & Brandner, W. 2003, ApJ, 589, 410
- Steffen et al. (2001) Steffen, A. et al. 2001, AJ, 122, 997
- Sterzik et al. (2003) Sterzik, M., Durisen, R., & Zinnecker, H. 2003, A&A, 411, 91
- Stetson (1987) Stetson, P. 1987, PASP, 99, 191
- Strom & Strom (1994) Strom, K. & Strom, S. 1994, ApJ, 424, 237
- Torres-Dodgen & Weaver (1993) Torres-Dodgen, A. & Weaver, W.B. 1993, PASP, 105, 693
- Torres et al. (2007) Torres, R., Loinard, L., Mioduszewski, A., & Rodriguez, L. 2007, ApJ, 671, 1813
- Walter et al. (1994) Walter, F., Vrba, F., Mathieu, R., Brown, A., & Myers, P. 1994, AJ, 107, 692
- Weinberg et al. (1987) Weinberg, M., Shapiro, S., & Wasserman, I. 1987, ApJ, 312, 367
- White et al. (1999) White, R., Ghez, A., Reid, I.N., & Schultz, G. 1999, ApJ, 520, 811
- White & Ghez (2001) White, R. & Ghez, A. 2001, ApJ, 556, 265
- White & Wing (1978) White, N. & Wing, R. 1978, ApJ, 222, 209
- Wing (1971) Wing, R. 1971, Late-Type Stars, Ed. G. W. Lockwood & H. M. Dyck. Kitt Peak National Observatory, 554, 145
- Wizinowich et al. (2006) Wizinowich, P. et al. 2006, PASP, 118, 297
- Zuckerman et al. (2004) Zuckerman, B., Song, I., & Bessell, M. 2004, ApJ, 613, 65