The properties of quasar hosts at the peak of the quasar activity
Abstract
We present near-infrared imaging obtained with ESO VLT/ISAAC of a sample of 16 low luminosity radio-quiet quasars at the epoch around the peak of the quasar activity (), aimed at investigating their host galaxies. For 11 quasars, we are able to detect the host galaxies and derive their properties, while for the other five quasars, upper limits to the host luminosity are estimated. The luminosities of the host galaxies of radio-quiet quasars at high redshift are in the range of those of massive inactive elliptical galaxies.
This work complements our previous systematic study of quasar hosts aimed to trace the cosmological luminosity evolution of the host galaxies up to and extends our pilot study of a few luminous quasars at . The luminosity trend with cosmic epoch resembles that observed for massive inactive galaxies, suggesting a similar star formation history. In particular, both quasar host galaxies and massive inactive galaxies appear mostly assembled already at the peak age of the quasar activity. This result is of key importance for testing the models of joint formation and evolution of galaxies and their active nuclei.
1 Introduction
There is nowadays compelling evidence that the processes of the formation and evolution of galaxies and the nuclear activity are intimately linked. The most direct link at low redshift is the correlation of the mass of the central black holes with the luminosity (mass) and the stellar velocity dispersion of the spheroids where they reside, in both inactive and active galaxies (see Ferrarese 2006 for a review). If this link holds also at higher redshift, the observed population of high redshift quasars traces the existence of M⊙ supermassive BHs and massive spheroids at very early ( 1 Gyr) cosmic epochs (Fan et al., 2003; Willott et al., 2003). Moreover, the strong cosmological evolution of the quasar population (Dunlop & Peacock, 1990; Warren et al., 1994) is similar to the star formation history in the Universe (Madau et al. 1998; see also Lapi et al., 2006). According to the hierarchical merging scenarios for structure formation and evolution (e.g., Kauffmann & Haehnelt, 2000; Di Matteo et al., 2005), the massive spheroidals should be the products of successive merger events, and the properties of quasar hosts (mass, luminosity, size) should show a redshift dependence. Moreover, the quasar activity is expected to deposit large amounts of energy in the spheroid, possibly suppressing star formation (e.g., Silk & Rees 1998).
In this context, the direct detection and characterization of high redshift quasar host galaxies is crucial to understand the joint cosmic assembly and evolution of bulges of galaxies and their central black holes. In particular, a key point is to probe the quasar host properties up to and beyond the epoch of the peak of quasar activity ().
Low redshift () quasars are hosted in galaxies containing a luminous, massive bulge component that becomes dominant in radio-loud objects and at high nuclear luminosity (Hamilton et al., 2002; Dunlop et al., 2003; Pagani et al., 2003; Floyd et al., 2004). Their stellar populations are believed to be relatively old, especially in very luminous AGN compared to their inactive counterparts (Nolan et al., 2001; Dunlop et al., 2003). However, there is some imaging and spectroscopic evidence for relatively young/intermediate age stellar populations in some low redshift AGN host galaxies, even in apparently quiescent ellipticals (Kauffmann et al., 2003; Jahnke et al., 2004; Kotilainen & Falomo, 2004; Raimann et al., 2005; Hyvönen et al., 2007b; Letawe et al., 2007; Baldi & Capetti, 2008; Hyvönen et al., 2009).
The detection and characterization of the host galaxies of high redshift quasars is challenging since the quasar luminosity overwhelms the extended emission from the galaxy, especially in optical imaging, corresponding to rest-frame UV emission. Furthermore, the host galaxy surface brightness decreases rapidly with redshift. In order to cope with these difficulties, imaging with high spatial resolution and S/N together with a well defined point spread function (PSF) are essential. Systematic reliable studies of the host galaxies of quasars have thus became available only recently thanks to the use of near-infrared (NIR) imaging, where the nucleus-host luminosity ratio is more favourable, allowing to detect the old stellar population at high redshift. Concerning the stellar population, only few studies have been performed at high redshift (z 0.5) so far.
In the largest study of quasar host galaxies available up to now (Falomo et al., 2001, 2004; Kotilainen et al., 2007), we carried out systematic imaging with the 8m Very Large Telescope (VLT) and the Infrared Spectrometer And Array Camera (hereafter, ISAAC) of 32 quasars in the redshift range , to characterize their host galaxies. The sample includes both radio-loud quasars (RLQs) and radio-quiet quasars (RQQs), and it covers a wide range of the quasar luminosities. We found that the luminosity evolution of both RLQ and RQQ hosts is consistent with that of massive inactive ellipticals undergoing passive evolution.
Beyond , detecting the host galaxies becomes extremely difficult, even with the state-of-art observational techniques. So far, only a few individual objects have been reported to be resolved (Lehnert et al., 1992; Hutchings et al., 1999; Ridgway et al., 2001; Croom et al., 2004; Falomo et al., 2005; Peng et al., 2006; Falomo et al., 2008; Schramm et al., 2008; Villforth et al., 2008) mainly following three different approaches: (1) observations from space (e.g., Kukula et al., 2001), provide an excellent narrow PSF but are usually limited by the small collecting area of the Hubble Space Telescope (HST). Furthermore, the PSF of the images taken with the HST WFPC2 are undersampled, leading to a systematic overestimate of the flux from the host galaxy (see Kim et al. 2008). Note that this undersampling does not apply to images taken with ACS and NICMOS. (2) the extended emission from the host galaxies is naturally magnified in gravitationally lensed quasars (e.g., Peng et al., 2006). The drawback in this approach is that the PSF of the lensed targets is difficult to characterize, and the lens galaxy may contaminate the emission from the quasar host, making its detection extremely uncertain. (3) ground-based imaging with Adaptive Optics (AO) (Croom et al., 2004; Falomo et al., 2005, 2008) usually satisfies the severe constrains in the spatial resolution required to disentangle the extended emission of the host galaxies from the nuclear one. In our previous studies (Falomo et al., 2005, 2008), we obtained Ks-band images of quasars in the redshift range using the AO system NACO at ESO VLT, which allowed us to clearly resolve two RLQs and two RQQs. The drawback in this approach is of statistical nature. In fact all current AO systems require a very bright star to be present close to the target. This therefore strongly limits the number of observable objects. This limitation should be overcome with the next generation of AO systems using artificial guide stars. (4) Another possibility, that we shall address in this paper, is to focus on high- quasars of low luminosity where the nuclear-to-host luminosity ratio is more favorable. This ensures that, even without AO, the host galaxies can be detected and characterized from deep, NIR ground-based observations obtained in excellent natural seeing conditions. Moreover, the much larger field of view of non-AO images allows a significantly better characterization of the PSF from field stars.
In this paper, we present a deep, high resolution imaging study with VLT/ISAAC of a sample of radio-quiet quasars with relatively low nuclear luminosity, aimed at the study of their host galaxies. The structure of the paper is the following: In section 2 we describe our sample. In section 3 we report the observations and data reduction and in section 4 we describe the data analysis. In section 5 the resulting luminosities of the quasar host are presented, together with a comparison to literature data available in the same redshift range. A discussion on the cosmic luminosity evolution of RQQ host galaxies is presented in section 6. Summary and directions for future work are given in section 7. We adopt the concordance cosmology with H0 = 70 km s-1 Mpc-1, = 0.3 and = 0.7.
2 The sample
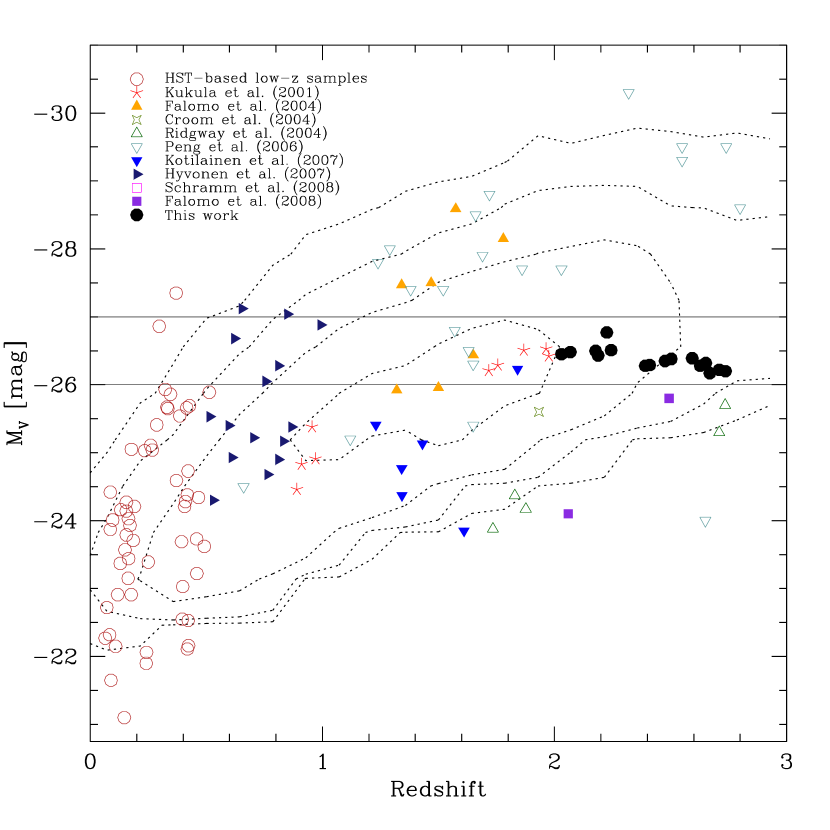
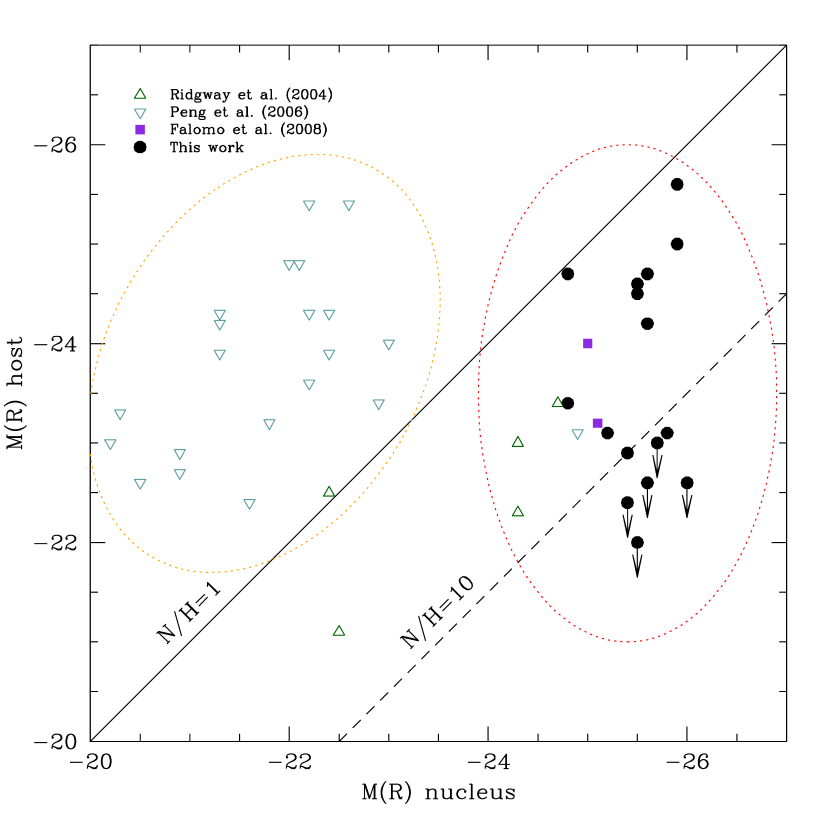
The sample of quasars was extracted from the AGN catalogue of Veron-Cetty & Veron (2006) requiring: (a) rest-frame luminosity in the range: , -corrected assuming Francis et al. (1991) quasar SED template111Note that at -correction is mag for a typical quasar SED., in order to maximize the likelihood for the host galaxy detection; (b) at least two bright (R 16) stars within 40 arcsec of the quasar, and many other fainter stars (R 20, comparable to the brightness of the quasars) within the ISAAC arcmin2 field of view, in order to provide a reliable characterization of the PSF. With these constrains, the search produced quasars, from which we extracted a sample of 16 RQQs with the most favourable observability from Paranal (Chile), covering the full redshift range. There is no statistically significant difference between the properties of the full and of the observed samples. Fig. 1 shows the distribution of the observed quasars in the plane, compared with the samples of other similar studies available from literature and with the envelope of all the quasars in the AGN catalogue of Veron-Cetty & Veron (2006).
3 Observations
Deep Ks-band images of the quasars were obtained using ISAAC (Moorwood et al., 1998), mounted on UT1 (Antu) of VLT at the European Southern Observatory (ESO) in Paranal, Chile. ISAAC is equipped with a 1024 1024 pxl Hawaii Rockwell array, with a pixel scale of 0148 px-1, giving a field of view of arcsec2. The observations were performed in service mode under photometric conditions in the period between 2006 March and September. The journal of observations is given in Table 2. The seeing, as derived from the FWHM size of stars in each frame, was mostly excellent during the observations, ranging from 04 to 06 (average and median FWHM 05, see Table 2). Note that at the redshift of the targets, observations in the Ks-band probe the host galaxy at rest-frame 5500 – 7000 Å, roughly the R-band, thus allowing an easy comparison with optical studies at lower redshift.
The images were secured using individual exposures of 2 minutes per frame, and a jitter procedure (Cuby et al., 2000), which produces a set of frames at randomly offset telescope positions within a box of 10 10 arcsec. The total integration time was 38 minutes per target per observing block (OB). All targets but one (2QZJ124029-0010) were observed in two or three OBs of equal length. Since no significant discrepancy were found in the sky surface brightness and the seeing from the PSF of field stars between the different OBs for each target, we opted to combine all the individual images of each target.
Data reduction was performed using our own improved version of the ESO pipeline for jitter imaging data (Devillard, 2001). Each frame was dark–subtracted and flat–fielded by a normalized flat field obtained from twilight sky images. Sky subtraction was performed using median averaged and scaled sky frames obtained combining jittered exposures of the same field. Sky–subtracted images were aligned to sub–pixel accuracy, and co–added. Combined images are trimmed into a pixel ( arcmin2) frame, covered by all the individual exposures. Finally, a polynomial surface was fitted to the combined image, after masking main sources, in order to remove spurious gradients in the background counts due to sky variations during the integration.
Photometric calibration was performed from comparison with 2MASS magnitudes of bright stars available in the field. The estimated internal photometric accuracy is mag.
4 Two–dimensional data analysis
Data analysis was carried out using AIDA (Astronomical Image Decomposition and Analysis; Uslenghi & Falomo, 2008), an IDL-based software package designed to perform two–dimensional model fitting of quasar images, providing simultaneous decomposition into nuclear and host galaxy components. The applied procedure is described in detail in Kotilainen et al. (2007), and briefly summarized here.
4.1 PSF modeling
The most critical part of the analysis is the determination of the PSF model and the estimate of the background level around the target, which may strongly affect the faint signal from the object. To model the PSF shape, we used field stars in each frame, selected on the basis of their FWHM, sharpness, roundness and S/N ratio, including bright, slightly saturated stars, in order to properly model the faint wing of the PSF. A careful check of the light profiles and contour plot of each star let us exclude marginally resolved galaxies and stars with close companions.
Each star was then modeled with four two-dimensional Gaussians, representing the core of the PSF, and an exponential feature, representing the extended wing of the PSF. Regions contaminated by nearby sources, saturated pixels and other defects affecting the images were masked out. The local background was computed in a circular annulus centered on the star, and its uncertainty was estimated from the standard deviation of the values computed in sectors of concentric sub-annuli included in this area. Finally, the region used in the fit was selected by defining an internal and an external radius of a circular area, allowing the exclusion of the core of bright, saturated stars. ¿From the comparison of the resulting light profiles (see Fig. 2), no systematic dependence of the PSF was observed in the field of view. Thus, the same model was fitted simultaneously to all the usable stars of the image.
The uncertainty of the PSF model was estimated by comparing the analytical fit with the individual observed star profiles, and adding a fixed term ( mag/arcsec2) to account for possible systematic effects due to underlying assumptions in the data reduction (e.g. Zero Point and PSF stability, and perfect alignments in the de-jitter procedure). Panel e) in Fig. 2 shows the residual of PSF modeling together with the estimated uncertainty.
4.2 Quasar host characterization
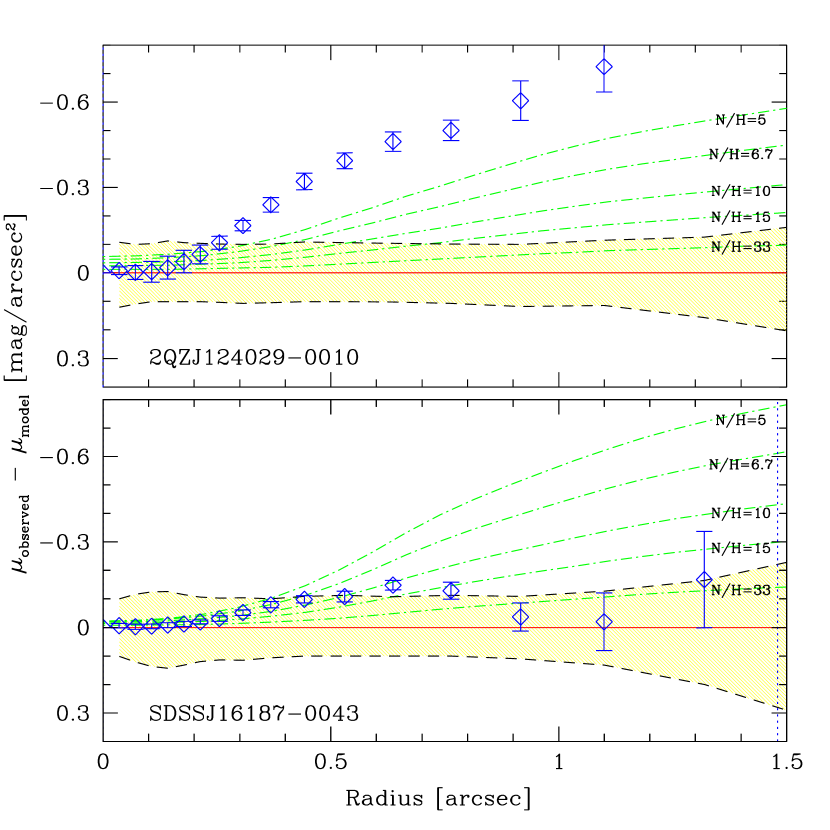
In order to evaluate whether the targets are resolved, we first fitted each quasar image using only the PSF model. If the residuals revealed a significant excess over the PSF shape in the – arcsec range (where the contribution of the nuclear PSF quickly diminishes, while the contribution from the host galaxy signal becomes sufficiently high and detectable), the target was considered resolved. An example of the residuals after the PSF subtraction, for a resolved target, is presented in Fig. 3, upper panel. The resolved targets were then fitted with a two component model (PSF+galaxy). At high redshift, it becomes increasingly difficult to distinguish between bulge and exponential disk models from the luminosity distributions. We assumed that the host galaxies can be represented as elliptical galaxies with a de Vaucouleurs r1/4 profile. This choice is motivated by the strong evidence at low redshift for the predominance of bulge dominated hosts of quasars (e.g. Hamilton et al. 2002; Dunlop et al. 2003; Pagani et al. 2003). If instead of a bulge-dominated model, we adopt an exponential disk law, all the objects can still be reasonably well fitted. The main difference is that the host galaxy luminosity become mag fainter for a disk model, but this does not significantly affect the results of this paper.
In only two cases (2QZJ124029-0010 and 2QZJ222702-3205), the host galaxy detection was considered good enough to be able to firmly pin down the effective radius . For all the other objects in the sample, we opted to set equal to 5 kpc in the modeling, following the indication of previous works (e.g., Falomo et al., 2004). We note that, within our adopted cosmological framework, 5 kpc corresponds to arcsec at , comparable with the typical angular resolution of our data. In order to evaluate the effect on the host luminosity of assuming a more compact host galaxy, we re-performed the modelling of all the resolved targets assuming = 2.5 kpc. With only two exceptions, the host galaxy magnitudes are consistent within 0.3 mag. No systematic offsets are found (the difference of average values = -0.03 mag). The two exceptions are Q2125-4432 and 2QZ231751-3147 ( and respectively), both of which have very faint host galaxies, close to the envelope of the unresolved targets, and therefore are likely to have larger uncertainties. Furthermore, the models of 2QZ231751-3147 have a highly elongated profile shape, suggesting that this object is peculiar. The number of unresolved targets remains unchanged irrespective of the assumed , since the resolved/unresolved classification only depends on the comparison between the observed light profile and the modelled PSF, independently of any other assumption on the shape of the host galaxy.
Targets showing no residuals in the light profile after the PSF subtraction exceeding the PSF model uncertainty were considered unresolved. An example of an unresolved target is provided in Fig. 3, lower panel. In these cases, we computed the profiles expected assuming a zero-ellipticity host galaxy with a de Vaucouleurs profile and kpc, and various N/H ratios. Among them, we adopted as the upper limit on the host galaxy luminosity the model that best matched the PSF model uncertainty.
5 Results
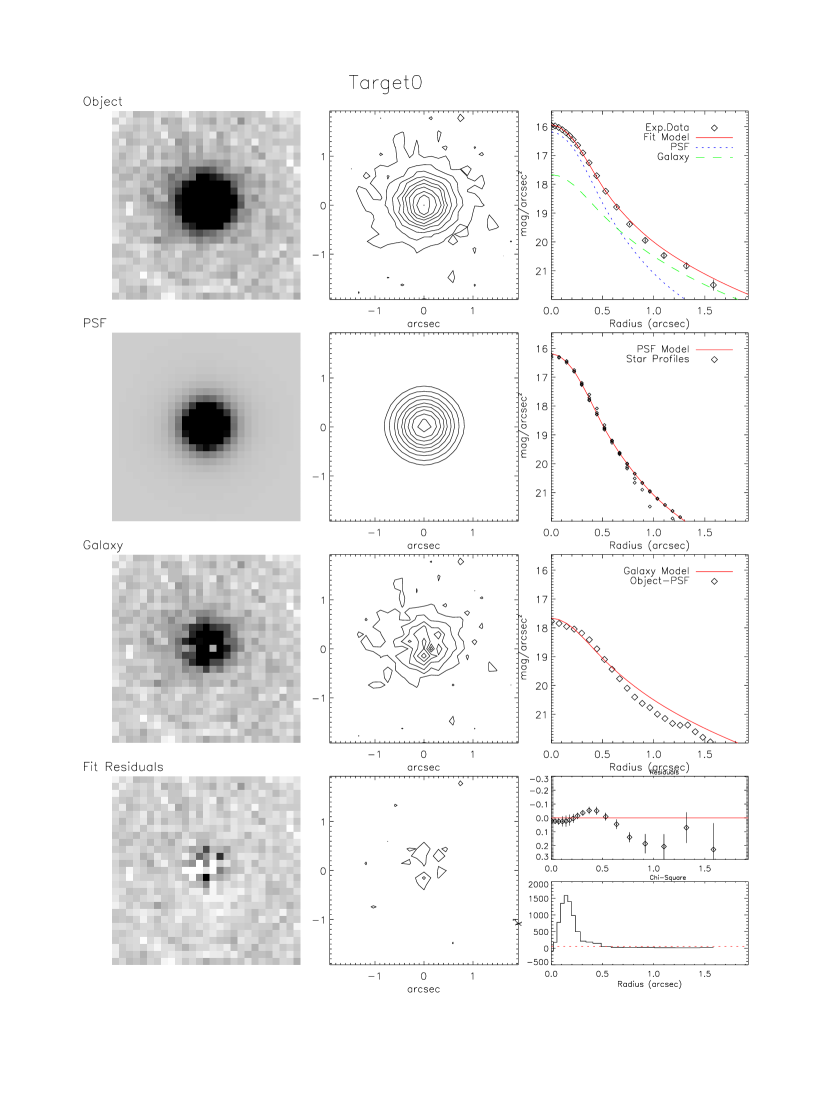
In Fig. 4, we report the image of an example quasar, the best-fitting PSF, the residual after PSF subtraction, and the residual after the fit with both the PSF and the galaxy model. The fitted parameters are given in Table 3. We have been able to resolve 11 out of the 16 quasars. In Table 3, we also report the nuclear and the host galaxy absolute magnitudes and the nuclear to host (N/H) luminosity ratio for each quasar. All objects with N/H12 are resolved, while no host galaxy is resolved in objects with N/H 12, highlighting its key role in the detection of the host galaxy emission.
To compare the properties of the quasar hosts at different redshifts, it is preferable to compare data probing the same rest-frame wavelengths. The Ks-band at redshifts corresponds to rest-frame Å, closely matching the R-band. Therefore, in order to refer low and high redshift data to the same band (and to minimize color and -corrections), we transformed the observed magnitudes into absolute magnitudes in the R-band. To perform the color and -correction transformations, we assumed an elliptical galaxy template (Mannucci et al. 2001) for the host galaxy, and a composite quasar spectrum (Francis et al. 1991) for the nucleus.
All the resolved quasars in our study have host galaxies with luminosity ranging between M(R) and M(R) , i.e. corresponding to a range between and , where (R) is the R-band characteristic luminosity of the Schechter luminosity function for inactive galaxies (Marchesini et al. 2007), which is mag brighter than the one observed in the local Universe ((R); see, e.g., Gardner et al. 1997; Nakamura et al. 2003). The average R-band host luminosity of the resolved quasars is . Following the approach of statistical survival analysis proposed by Feigelson & Nelson (1985), we have computed the average M(R)host including the upper limits of the host galaxy luminosities for the unresolved objects, and obtain . For a more thorough discussion of this method, see Hyvönen et al. (2007a). For reference, the average nuclear luminosity of the quasars is , and the average nucleus-to-host luminosity ratio .
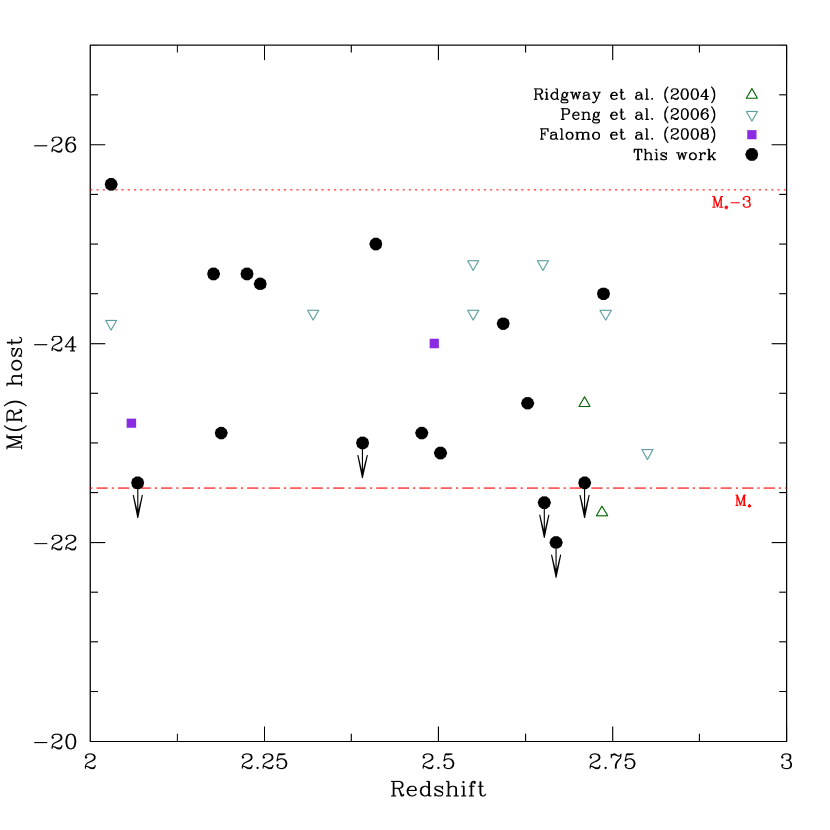
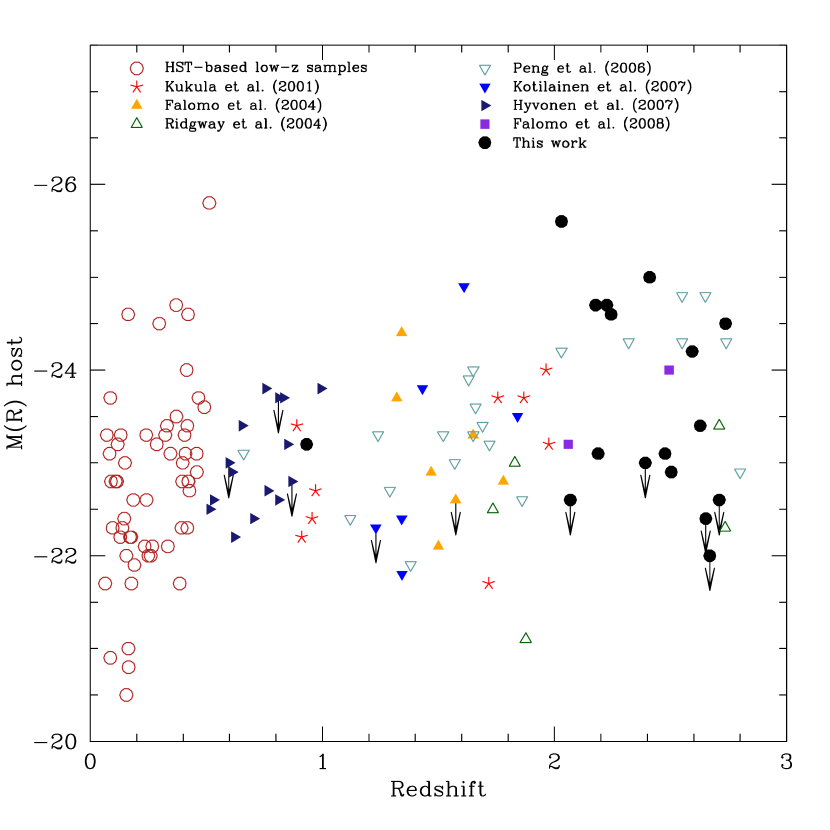
In Fig. 5 we compare the host galaxy luminosities derived in this paper with those available from the literature for quasars in the same redshift range. All the published magnitudes are converted to rest-frame R-band assuming the elliptical template from Mannucci et al. (2001), and adopting the same cosmological framework. In the following, we compare our results with each available sample in the literature. The targets in Ridgway et al. (2001) were selected for having very low quasar luminosity. Their two quasars have M(R)host and respectively, towards the faint end but consistent with the range of luminosities found in this paper. The lensed quasars in Peng et al. (2006) have host galaxies with luminosities very similar to those found in our sample, with (considering only the targets). The same is true for the small number of resolved targets in the previous AO studies by our group (Falomo et al., 2005; 2008). Villforth, Heidt & Nilsson (2008) reported the marginal detection of the host galaxy of a single quasar. Its very low N/H ratio and spectral classification halfway between Type 1 and Type 2 AGN suggest that this object is an obscured quasar. Due to this peculiarity, we excluded it from further analysis. Finally, Schramm et al. (2008) found very high host galaxy luminosities, M(R)host = , and , for three quasars at , and , respectively. These luminosities are up to two magnitude brighter than in the other studies plotted in Fig. 5. This discrepancy may be connected with the fact that these quasars are among the most luminous at this redshift range. Motivated by this peculiarity, we have re-analyzed the Ks-band data of Schramm et al., retrieved from the ESO Archive. Our re-analysis shows that all these quasars are unresolved. In particular, no signal from the host galaxy was found at radii larger than arcsec (compare with Fig. 3 in Schramm et al., 2008). This is consistent with the presence of very bright nuclei in these quasars (about two magnitudes brighter than the brightest quasar in our sample). Furthermore, their observations were performed in only modest seeing conditions (0.7 arcsec FWHM). Therefore, we have excluded the Schramm et al. data from Fig. 5 and the following analysis.
As noted previously, the nucleus-to-host luminosity ratio of the resolved targets in our sample ranges between 1 and 12. If quasars emit with a narrow range in Eddington ratio and if the black hole mass is proportional to the luminosity of the host galaxy bulge (e.g., Magorrian et al., 1998), a correlation between the nuclear and the host galaxy magnitudes is to be expected. On the other hand, such a relation can fade due to several factors, both intrinsic (nuclear obscuration, beaming, and/or an intrinsic spread in the accretion rate) and extrinsic (e.g., lower level, non-quasar like nuclear activity may be relevant at low redshift; faint galaxies with very bright nuclei are difficult to resolve at high redshift), or can be an artifact of a narrowly sampled parameter space in the N/H ratio. Previous studies do not agree whether such a correlation exists (e.g., Dunlop et al., 2003; Pagani et al., 2003; Kotilainen et al., 2007). Fig. 6 shows the comparison between the rest-frame -band host and nuclear absolute magnitudes for all the available RQQ host galaxies in the range. No significant trend is observed between the host and the nuclear luminosity, neither considering only our sample nor comparing with all the available datasets, though we remark that the sampled parameter space in N/H strongly depends on the adopted observation technique, thus making a direct comparison between the various datasets difficult. We rather note that our new data, together with those published in Falomo et al. (2008) and most of the Ridgway et al. (2001) high redshift sample, fill a distinct region of the plot with respect to the data published in Peng et al. (2006). In other words, for a similar range in M(R)host, the quasars in Peng et al. have mag fainter nuclei, and their N/H, suggesting that the sample of Peng et al. is dominated by lower luminosity objects with non-quasar level, e.g. Seyfert type, nuclear activity.
6 Discussion
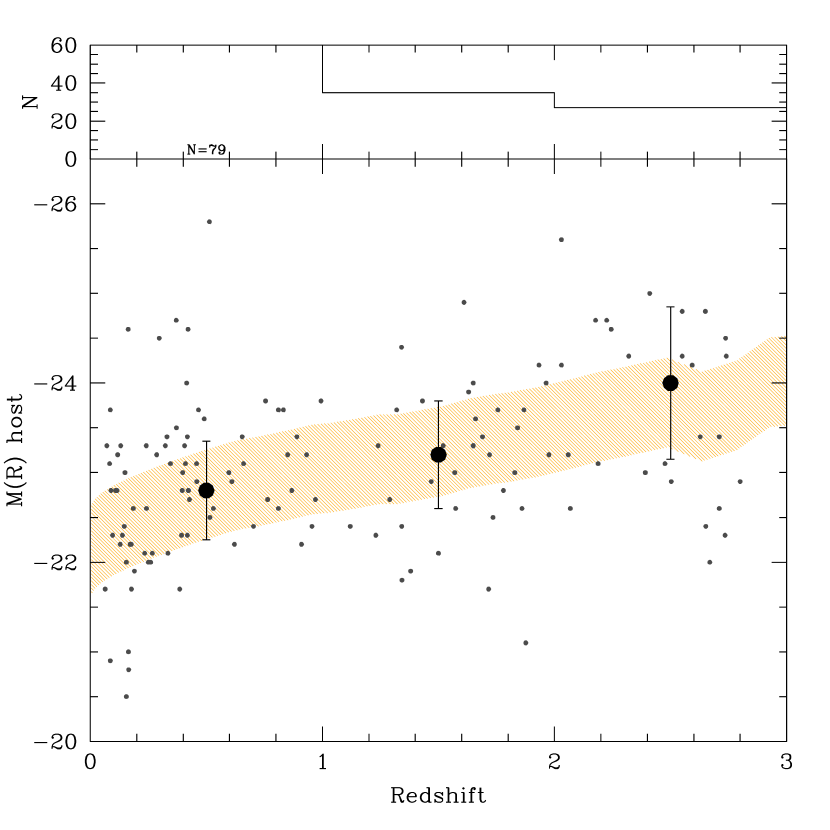
In Fig. 7 we extend the plot shown in Fig. 5 to include all published RQQ host galaxy magnitudes at (Kukula et al. 2001; Ridgway et al. 2001; Falomo et al. 2004; Kotilainen et al. 2007; Hyvönen et al. 2007a), and HST observations at (Bahcall et al., 1997; Hooper et al., 1997; Boyce et al., 1998; Kukula et al., 2001; Hamilton et al., 2002; Dunlop et al., 2003; Floyd et al., 2004; Labita et al., 2006). In order to treat these literature data homogeneously, we transformed the published apparent magnitudes to M(R)host following the procedure described above (-correction, cosmology and color correction). Note that Croom et al. (2004) resolved the host galaxy of one quasar out of nine observed. Since they do not report upper limits on the magnitudes of the unresolved quasars, it is not possible to assess whether their unresolved hosts are consistent with the trend shown in Fig. 7. Because of this, the contribution from the single detected host galaxy by Croom et al. is negligible in this context and was omitted.
We are now in a position to compare the observed general trend of the luminosity of quasar host galaxies as a function of cosmic epoch with the expectations of theoretical models of galaxy formation. Fig. 7 shows that, despite the presence of a considerable scatter, a general trend is apparent, with the host galaxy luminosity of RQQs increasing by mag from the present epoch up to . We stress that this trend is statistically significant. For example, considering data binned as median averages, in order to be unaffected by the true (unknown) magnitude of the unresolved quasar hosts (see Figure 8), the linear best-fit of the relation is: M(R)host= -0.560.1 z - 22.50.3, with = 1.3 (where the uncertainties are 3 errors from the maps and the is normalized to the number of degrees of freedom ). On the other hand, a fit with constant luminosity implies M(R)host = -23.2, with = 31.4. Therefore, the trend in Fig. 7 can not be reproduced with the host luminosity remaining constant with redshift.
Most semi-analytical hierarchical models predict very few old, massive galaxies at high redshift (z 1) because in these models, large structures (massive galaxies) preferentially form at late epoch by continuous merging of smaller galaxies (e.g. Cole et al. 2000; Croton et al. 2006). This trend clearly disagrees with the observations presented here (Fig. 7), and with the discovery of a substantial population of evolved, massive galaxies at z 1.5 (e.g. Daddi et al. 2005). Recent hierarchical models include feedback effects from supernovae and AGN to disentangle the baryon evolution from the hierarchical assembly of dark matter structures (e.g., Di Matteo et al., 2005; Bower et al. 2006; De Lucia et al., 2006; see Ellis, 2008 for a review on this topic). AGN feedback acts expelling gas from the galaxies and thus quenching star formation (Tremonti et al., 2007; Bundy et al., 2008). This effect is of fundamental importance in massive galaxies, where AGN activity is preferentially observed (Kauffmann et al., 2003; Decarli et al., 2007; Gallo et al., 2008).
In order to probe whether inactive galaxies and quasar host galaxies have different star formation histories, we overplot in Fig. 8 the trend observed for the characteristic luminosity as a function of redshift, as derived from the UKIDSS Ultra Deep Survey (Lawrence et al., 2007). The evolution of the luminosity function (Cirasuolo et al. 2007, 2008) is of the form:
| (1) |
We transformed the KsAB magnitudes to the Ks-band assuming the correction used in the GOODS-ISAAC survey (Grazian et al. 2006): KsAB=Ks + . Then we applied filter and -correction as described above to compute the rest-frame R-band absolute magnitude. The result is shown in Fig. 8. On average, the available data on RQQ host galaxy luminosities lie between and at all redshifts. This reinforces the leading assumption that we make that quasars are harboured in luminous, massive galaxies. Furthermore, the dependence of on for quiescent galaxies (Cirasuolo et al. 2007, 2008) remarkably closely matches the trend observed in the M(R)host – distribution for quasar host galaxies, and is consistent with the findings of other studies on the luminosity function of galaxies at high redshift (e.g., Marchesini et al. 2007). This dependence supports the idea that quasar hosts and massive inactive galaxies share a similar star formation history.
There is increasing evidence for a mass dependence of the star formation history of galaxies (e.g., Gavazzi et al., 1996; 2002; Cimatti et al., 2004; Treu et al., 2005a; 2005b; Thomas et al., 2005), in the sense that the more massive elliptical galaxies formed their stars in relatively shorter bursts of intense star formation and at higher redshift (z ), compared to less massive galaxies. Recent merger events, if and when they occur, do not significantly affect the content of the stellar population of massive galaxies. On the other hand, the formation of lower luminosity galaxies is shifted toward lower redshifts, having significant star formation present at all epochs (see e.g. Renzini 2006, Scarlata et al. 2007, Vergani et al. 2008).
We stress that while the case of the evolution of a single burst population formed at high redshift provides an adequate explanation for our results, we can not rule out other models, accounting for the accretion of the galaxy mass due to mergers and different stellar history recipes. While a naïve model with galaxies experiencing substantial mass accretion is not consistent with the data, a more complex model in which episodic star formation counter-weights the mass accretion of galaxies is formally acceptable. Nevertheless, we prefer an interpretation in which such a coincidence is not necessary. A more detailed modelling of the evolution and the star formation history of the host galaxies, that takes into account the role of the active nucleus is required. However, that is beyond the scope of this paper. Finally, we note that the assumption of a different SED of the stellar population does not affect significantly our results, since the rest-frame R–Ks color addressed in this paper is fairly insensitive to the age of the stellar population.
7 Summary and conclusions
We have presented homogeneous high resolution NIR images for a sample of 16 low luminosity RQQs in the redshift range , to characterize the properties and the cosmological evolution of their host galaxies, in conjunction with data at lower redshift. The host galaxy was resolved in eleven quasars out of the 16, while the remaining were unresolved. The RQQs in our sample have , and .
Comparing our new data with literature data at and at lower redshift, we found that the quasar host galaxies follow the trend in luminosity of massive inactive ellipticals (with M(R) ranging between and at , or and at z=0) undergoing passive evolution. This represents a fundamental constraint for models of galaxy formation and evolution and throws new light on our understanding of the interplay between the black holes, nuclear activity and the host galaxy evolution.
To definitely pin down the host galaxy assembly history, a large observational effort in increasing the sample of resolved host galaxies at is required, in order to increase the statistical significance of the present results and to sample a wider parameter space, whether in the N/H ratio, in the host galaxy luminosity, or in the level of quasar radio emission. Further observations with very high S/N and a very narrow, extremely reliable PSF, eventually thanks to laser guide star assisted AO in NIR will play a crucial role. Improved knowledge about the colours and environments of quasar host galaxies will also be needed to test the predictions of galaxy formation models. Finally, in a forthcoming paper (Decarli et al., in preparation), we will compare the luminosity of the host galaxies of high redshift quasars with their black hole masses, as derived from the spectroscopy of their broad emission lines. This will enable a direct test of the evolution of the black hole mass – host galaxy relations up to .
References
- Bahcall et al. (1997) Bahcall J.N., Kirhakos S., Saxe D.H., Schneider D.P., 1997, ApJ, 479, 642
- Baldi & Capetti (2008) Baldi,R.D., Capetti,A., 2008, A&A, 489, 989
- Bower et al. (2006) Bower R.G., Benson A.J., Malbon R., et al., 2006, MNRAS 370, 645
- Boyce et al. (1998) Boyce P.J., Disney M.J., Blades J.C., et al., 1998, MNRAS, 298, 121
- Bundy et al. (2008) Bundy, K., Georgakakis, A., Nandra, K., et al., 2008, ApJ 681, 931
- Cimatti et al. (2004) Cimatti A., Daddi E., Renzini A., et al., 2004, Nature, 430, 184
- Cirasuolo et al. (2007) Cirasuolo M., McLure R.J., Dunlop J.S., et al., 2007, MNRAS, 380, 585
- Cirasuolo et al. (2008) Cirasuolo M., McLure R.J., Dunlop J.S., et al., 2008, MNRAS, submitted (arXiv:0804.3471)
- Cole et al. (2000) Cole,S., Lacey,C.G., Baugh,C.M., Frenk,C.S., 2000, MNRAS 319, 168
- Croom et al. (2004) Croom S.M., Schade D., Boyle B.J., et al., 2004, ApJ, 606, 126
- Croton et al. (2006) Croton, D.J., Springel, V., White, S.D.M., et al. 2006 MNRAS 367, 864
- Cuby et al. (2000) Cuby J.G., Lidman C., Moutou C., Petr M., 2000, Proc. SPIE, 4008, 1036
- Daddi et al. (2005) Daddi,E., Renzini,A., Pirzkal,N., et al., 2005 ApJ 626, 680
- Decarli et al. (2007) Decarli R., Gavazzi G., Arosio I., et al., 2007, MNRAS, 381, 136
- De Lucia et al. (2006) De Lucia G., Springel V., White S.D.M., Croton D., Kauffmann G., 2006, MNRAS, 366, 499
- Devillard (2001) Devillard, N. 2001 in Astronomical Data Analysis Software and Systems X, ASP Conf. Ser., 238, 10, 525
- Di Matteo et al. (2005) Di Matteo T., Springel V., Hernquist L., 2005, Nature, 433, 604
- Dunlop & Peacock (1990) Dunlop J. S., Peacock J. A., 1990, MNRAS, 247, 19
- Dunlop et al. (2003) Dunlop J.S., McLure R.J., Kukula M.J., et al., 2003, MNRAS, 340, 1095
- Ellis (2008) Ellis R.S., 2008, in First Light in the Universe, Saas-Fee Advanced Courses, 36, p. 259-364
- Falomo et al. (2001) Falomo R., Kotilainen J.K., Treves, A., 2001, ApJ, 547, 124
- Falomo et al. (2004) Falomo R., Kotilainen J.K., Pagani C., Scarpa R., Treves, A., 2004, ApJ, 604, 495
- Falomo et al. (2005) Falomo R., Kotilainen J.K., Scarpa R., Treves A., 2005, A&A, 434, 469
- Falomo et al. (2008) Falomo R., Treves A., Kotilainen J.K., Scarpa R., Uslenghi M., 2008, ApJ, 673, 694
- Fan et al. (2003) Fan X., Strauss M.A., Schneider D.P., et al., 2003, AJ, 125, 1649
- Feigelson & Nelson (1985) Feigelson E.D., Nelson P.I., 1985, ApJ, 293, 192
- Ferrarese (2006) Ferrarese,L., 2006, Joint Evolution of Black Holes and Galaxies, eds. M. Colpi et al. (Taylor & Francis Group), p. 1
- Floyd et al. (2004) Floyd D.J.E., Kukula M.J., Dunlop J.S., et al., 2004, MNRAS, 355, 196
- Francis et al. (1991) Francis P.J., Hewett P.C., Foltz C.B., et al., 1991, ApJ, 373, 465
- Gallo et al. (2008) Gallo E., Treu T., Jacob J., et al., 2008, ApJ, 680, 154
- Gardner et al. (1997) Gardner J.P., Sharples R.M., Frenk C.S., Carrasco B.E., 1997, ApJ Letters, 480, 99
- Gavazzi et al. (1996) Gavazzi G., Pierini D., Boselli A., 1996, A&A, 312, 397
- Gavazzi et al. (2002) Gavazzi G., Bonfanti C., Sanvito G., Boselli A., Scodeggio M., 2002, ApJ, 576, 135
- Grazian et al. (2006) Grazian A., Fontana A., de Santis C., et al., 2006, A&A, 449, 951
- Hamilton et al. (2002) Hamilton T.S., Casertano S., Turnshek D.A., 2002, ApJ 576, 61
- Hooper et al. (1997) Hooper, E.J., Impey C.D., Foltz C.B., 1997, ApJ, 480, L95
- Hutchings et al. (1999) Hutchings J.B., Crampton D., Morris S.L.,Durand D., Steinbring E., 1999 AJ 117, 1109
- Hyvönen et al. (2007a) Hyvönen T., Kotilainen, J.K., Örndahl, E. , Falomo, R., Uslenghi, M. 2007a A&A 462 525
- Hyvönen et al. (2007b) Hyvönen T., Kotilainen, J.K., Falomo, R. Örndahl, E. Pursimo,T., 2007b, A&A 476, 723
- Hyvönen et al. (2009) Hyvönen T., Kotilainen, J.K., Reunanen, J., Falomo, R., 2009, A&A 499, 417
- Jahnke et al. (2004) Jahnke K., Kuhlbrodt B., Wisotzki L., 2004, MNRAS, 352, 399
- Kauffmann & Haehnelt (2000) Kauffmann G., Haehnelt M., 2000, MNRAS, 311, 576
- Kauffmann et al. (2003) Kauffmann G., Heckman T.M., Tremonti C., et al. 2003, MNRAS 346, 1055
- Kim et al. (2008) Kim,M., Ho,L.C., Peng,C.Y., Barth,A.J., Im,M., 2008, ApJS, 179, 283
- Kotilainen & Falomo (2004) Kotilainen J.K., Falomo R.,2004, A&A, 424, 107
- Kotilainen et al. (2007) Kotilainen J.K., Falomo R., Labita M., Treves A., & Uslenghi M., 2007, ApJ 660 1039
- Kukula et al. (2001) Kukula M.J., Dunlop J.S., McLure R.J., et al., 2001, MNRAS, 326, 1533
- Labita et al. (2006) Labita M., Treves A., Falomo R., Uslenghi M., 2006, MNRAS, 373, 551
- Lapi et al. (2006) Lapi A., Shankar F., Mao J., et al., 2006, ApJ, 650, 42
- Lawrence et al. (2007) Lawrence A., Warren S.J., Almaini O., et al., 2007, MNRAS, 379, 1599
- Le Borgne et al. (2004) Le Borgne D., Rocca-Volmerange B., Prugniel P., et al., 2004, A&A, 425, 881
- Lehnert et al. (1992) Lehnert M.D., Heckman T.M., Chambers K.C., Miley G.K., 1992, ApJ, 393, 68
- Letawe et al. (2007) Letawe, G., Magain, P., Courbin, F., et al., 2007, MNRAS 378, 83
- Madau et al. (1998) Madau P., Pozzetti L., Dickinson M. 1998 ApJ, 498, 106
- Magorrian et al. (1998) Magorrian, J.,Tremaine, S., Richstone, D., et al., 1998, AJ, 115, 2285
- Mannucci et al. (2001) Mannucci, F., Basile, F., Poggianti, B.M., et al. 2001, MNRAS, 326, 745
- Marchesini et al. (2007) Marchesini D., van Dokkum P., Quadri R., et al., 2007, ApJ, 656, 42
- Moorwood et al. (1998) Moorwood A., Cuby,J.-G., Biereichel,P., et al. 1998, The Messenger 94, 7
- Nakamura et al. (2003) Nakamura O., Fukugita M., Yasuda N., et al., 2003, AJ 125, 1682
- Nolan et al. (2001) Nolan,L., Dunlop,J., Kukula,M., Hughes,D., Boroson,T., 2001, MNRAS, 323, 308
- Pagani et al. (2003) Pagani C., Falomo R., Treves A., 2003, ApJ 596, 830
- Peng et al. (2006) Peng,C.Y., Impey,C.D., Rix,H.-W., et al. 2006, ApJ, 649, 616
- Raimann et al. (2005) Raimann, D., Storchi-Bergmann, T., Quintana, H., Hunstead, R., Wisotzki, L., 2005, MNRAS 364, 1239
- Renzini (2006) Renzini,A., 2006, ARA&A, 44, 141
- Ridgway et al. (2001) Ridgway S., Heckman T., Calzetti D., Lehnert M., 2001, ApJ, 550, 122
- Sanchez et al. (2004) Sanchez,S.F., Jahnke,K., Wisotzki,L., et al., 2004, ApJ, 614, 586
- Scarlata et al. (2007) Scarlata,C., Carollo,C.M., Lilly,S.J., et al., 2007, ApJS, 172, 494
- Schramm et al. (2008) Schramm M., Wisotzki L., Jahnke K., 2008, A&A, 478, 311
- Silk & Rees (1998) Silk J., Rees M.J., 1998, A&A Letters, 331, 1
- Thomas et al. (2005) Thomas D., Maraston C., Bender R., Mendes de Oliveira C., 2005, ApJ, 621, 673
- Tremonti et al. (2007) Tremonti, C. A., Moustakas, J., Diamond-Stanic, A.M., 2007, ApJ 663, L77
- Treu et al. (2005a) Treu T., Ellis R.S., Liao T.X., van Dokkum P.G., 2005a, ApJ Letters, 622, 5
- Treu et al. (2005b) Treu T., Ellis R.S., Liao T.X., et al., 2005b, ApJ, 633, 174
- Uslenghi & Falomo (2008) Uslenghi M. & Falomo, R. 2008, Proc. Erice, in press.
- Vergani et al. (2008) Vergani,D., Scodeggio,M., Pozzetti,L., et al., 2008, A&A, 487, 89
- Veron-Cetty & Veron (2006) Veron-Cetty M.P., Veron P. 2006, yCat, 7248, 0
- Villforth et al. (2008) Villforth C., Heidt J. & Nilsson K., 2008, A&A 488, 133
- Warren et al. (1994) Warren, S.J., Hewett, P.C., Osmer, P.S. 1994, ApJ, 421, 412
- Willott et al. (2003) Willott C.J., Rawlings S., Jarvis M.J. & Blundell K. M., 2003, MNRAS, 339, 173

| Quasar | z | VaaQuasar V-band apparent magnitudes from Veron-Cetty & Veron (2006). | Date (2006) | SeeingbbThe average and rms FWHM in arcsec of all stars in the frame. When only 1 non-saturated star was present, from the comparison of the PSF with resolved targets we conservatively estimated a arcsec uncertainty in the seeing. | NccNumber of stars used in the seeing estimate. | ZPddZero Point from 2MASS magnitude of field stars. | sky mageeSky surface brightness. |
|---|---|---|---|---|---|---|---|
| [mag] | [arcsec] | [mag] | [mag/arcsec2] | ||||
| 2QZJ124029-0010 | 2.030 | 19.76 | 11-Jul | 0.52 0.02 | 2 | 23.690.04 | 12.85 |
| 2QZJ133136-0002 | 2.710 | 20.74 | 10-Jul | 0.52 0.01 | 4 | 24.090.06 | 13.30 |
| 2QZJ143220-0215 | 2.476 | 20.38 | 17-May | 0.42 0.01 | 5 | 24.140.08 | 13.39 |
| 2QZJ144022-0122 | 2.244 | 20.02 | 21-May, 10-Jul | 0.46 0.05 | 1 | 24.020.01 | 13.53 |
| SDSSJ16187-0043 | 2.068 | 19.77 | 13-Apr | 0.45 0.00 | 4 | 24.000.08 | 13.48 |
| Q2125-4432 | 2.503 | 20.39 | 13-May | 0.56 0.01 | 3 | 24.070.02 | 13.00 |
| Q 2126-1148A | 2.188 | 20.00 | 13-May | 0.45 0.01 | 5 | 24.120.02 | 13.26 |
| 2QZJ215539-3026 | 2.593 | 20.44 | 17-May | 0.43 0.02 | 6 | 24.100.08 | 13.04 |
| 2QZJ221139-3132 | 2.391 | 20.40 | 17-May | 0.47 0.02 | 5 | 24.140.09 | 13.22 |
| Q2225-403 | 2.410 | 20.20 | 18-May, 11-Jun | 0.46 0.05 | 1 | 24.050.04 | 13.34 |
| 2QZJ222702-3205 | 2.177 | 20.13 | 12-Jun | 0.45 0.00 | 2 | 24.090.00 | 13.42 |
| 2QZJ223048-2954 | 2.652 | 20.56 | 12-Jun | 0.51 0.02 | 4 | 24.140.14 | 13.44 |
| 2QZJ225950-3206 | 2.225 | 19.72 | 17-Jul | 0.56 0.01 | 2 | 23.950.10 | 13.24 |
| 2QZJ231751-3147 | 2.628 | 20.58 | 18-Jul, 2-Aug | 0.56 0.01 | 6 | 24.100.03 | 13.22 |
| 2QZJ232755-3154 | 2.737 | 20.73 | 14-Jul, 17-Jul | 0.40 0.01 | 4 | 23.990.04 | 13.11 |
| 2QZJ233451-2929 | 2.669 | 20.72 | 19-Jun, 3-Aug | 0.46 0.02 | 2 | 24.160.12 | 13.46 |
| Quasar | z | aaApparent magnitudes of the nuclei in the observed Ks-band. | bbApparent magnitudes of the host galaxies in the observed Ks-band. | ccAbsolute magnitudes of the nuclei in the R-band, -corrected assuming the Francis et al. (1991) template; no correction for galactic extinction is applied. | ddAbsolute magnitudes of the host galaxy in the R-band, -corrected assuming the elliptical galaxy template by Mannucci et al. (2001); no correction for galactic extinction is applied. | N/HeeThe N/H ratio, referred to the absolute R magnitudes. |
|---|---|---|---|---|---|---|
| nuc | host | nuc | host | |||
| 2QZJ124029-0010 | 2.030 | 17.2 | -25.9 | -25.6 | 1.3 | |
| 2QZJ133136-0002 | 2.710 | 18.4 | -25.6 | -22.6 | 16.0 | |
| 2QZJ143220-0215 | 2.476 | 18.3 | -25.2 | -23.1 | 6.7 | |
| 2QZJ144022-0122 | 2.244 | 17.7 | -25.5 | -24.6 | 2.2 | |
| SDSSJ16187-0043 | 2.068 | 17.0 | -26.0 | -22.6 | 23.1 | |
| Q2125-4432 | 2.503 | 18.2 | -25.4 | -22.9 | 9.5 | |
| Q 2126-1148A | 2.188 | 17.2 | -25.8 | -23.1 | 12.0 | |
| 2QZJ215539-3026 | 2.593 | 18.3 | -25.6 | -24.2 | 3.4 | |
| 2QZJ221139-3132 | 2.391 | 17.6 | -25.7 | -23.0 | 12.2 | |
| Q2225-403 | 2.410 | 17.4 | -25.9 | -25.0 | 2.4 | |
| 2QZJ222702-3205 | 2.177 | 18.2 | -24.8 | -24.7 | 1.2 | |
| 2QZJ223048-2954 | 2.652 | 18.6 | -25.4 | -22.4 | 15.8 | |
| 2QZJ225950-3206 | 2.225 | 17.5 | -25.6 | -24.7 | 2.4 | |
| 2QZJ231751-3147 | 2.628 | 19.2 | -24.8 | -23.4 | 3.5 | |
| 2QZJ232755-3154 | 2.737 | 18.6 | -25.5 | -24.5 | 2.5 | |
| 2QZJ233451-2929 | 2.669 | 18.5 | -25.5 | -22.0 | 27.3 |