The Mysterious bar of the Large Magellanic Cloud: What is it?
Abstract
The bar of the Large Magellanic Cloud (LMC) is one of the prominent, but controversial feature regarding its location with respect to the disk of the LMC. In order to study the relative location of the bar with respect to the disk, we present the high resolution map of the structure across the LMC. We used the reddening corrected mean magnitudes () of red clump (RC) stars from the OGLE III catalogue to map the relative variation in distance (vertical structure) or variation in RC population across the LMC. The bar does not appear as an identifiable vertical feature in the map, as there is no difference in values between the bar and the disk regions. We conclude that the LMC bar is very much part of the disk, located in the plane of the disk (within 0.02 mag) and it is not a separate component. We identify warps or variation in RC population with increase in radial distance.
1 Introduction
The off-centered stellar bar is one of the most striking features of the Large Magellanic Cloud (LMC). On the other hand, this is one of the least studied and understood features of the LMC van der Marel (2006). Bars are a common phenomenon in late-type spirals and Magellanic irregulars de Vaucoulers & Freeman (1973). The asymmetric bar is used to explain the recent star formation history as well as the one-armed spiral feature in the LMC Girardi et al. (1998); Dottori et al. (1996). Subramaniam (2003) studied the relative distance within the LMC bar using red clump (RC) stars and found that the bar is warped and also found extra planar structures in the bar. Zaritsky (2004) suggested that the bar of the LMC is the result of viewing a triaxial stellar bulge that is embedded in a highly obscuring thick disk. The author also mentioned that, there are surprisingly few direct constraints on the three dimensional structure of this entity. Another reason to study the vertical structure is to understand the results from the microlensing surveys. Zhao & Evans (2000) proposed that this off-centered bar is an unvirialized structure slightly misaligned with, and offset from, the plane of the LMC disk. The small displacement and misalignment are consequences of recent tidal interactions with the Small Magellanic Cloud (SMC) and the Galaxy. Many considered this as a possible reason for microlensing events observed towards the LMC. Nikolaev et.al. (2004) suggested the bar to be levitating above the disk by 0.5 kpc based on distance estimations of Cepheids. Thus, location of the bar with respect to the disk is still debated. The near-IR star count maps presented by van der Marel (2001) found the bar to be a smooth structure. On the other hand, the bar is not visible in the HI distribution or in the HI velocity maps Staveley-Smith et al. (2003). Thus, when the bar is a prominent feature in the optical and near -IR, such a feature is not visible in the gas and recent star formation. Thus, the striking difference between these two distribution in the LMC has been an unsolved mystery.
In this paper, we map the vertical structure (derived from the relative magnitude variation) in the inner LMC using the recently published OGLE III catalogue Udalski et al. (2008). Reddening corrected mean magnitude of RC distribution () is assumed to reflect the variation in distance along the line of sight, such that, regions with brighter peak magnitudes are assumed to be located closer. This method was used by Subramaniam (2003) and found a warped bar using the OGLE II data and by Olsen & Salyk (2002), who found a warp in the south-western disk. Since the OGLE III scans cover the disk region surrounding the bar as well as the bar, it is probably one of the best data to study the relative location of the bar with respect to the inner disk. The high resolution map (64.5 x 64.5 sq.pc), presented in this study is expected to bring out any difference in location, since the bar and the disk are sampled. A difference in could also arise due to differences in RC population between regions, due to variation in star formation history, metallicity etc.. Thus any difference, or variation seen in the is interpreted as due to a vertical structure or change in RC population.
The present analysis is expected to reveal the properties of the bar and the disk as delineated by RC stars, which are older than 1 Gyr. Thus the properties derived here pertain to the disk of intermediate age in the LMC. Since the bar of the LMC is believed to be about 4 Gyr old Smecker-Hane et al. (2002), RC stars are one of the best tracers to differentiate the bar from the disk. The data is presented in the next section. Section 3 presents the results of the vertical structure in the LMC, followed by discussion in section 4.
2 Data
OGLE III survey Udalski et al. (2008) presented VI photometry of 40 square degrees of the LMC consisting of about 35 million stars. We divided the observed region into 7169 regions (with reasonable no of RC stars 100 - 2700) with a bin size of 4.444.44 sq.arc min. The regions with RC stars in the range 100 - 200 are located in the eastern and western ends of the disk region covered by OGLE III. To obtain the number distribution of the RC stars, they are binned in both colour and magnitude with a bin size of 0.01 and 0.025 mag respectively. These distributions are fitted with a Gaussian + Quadratic polynomial. A non linear least square method is used for fitting and the parameters are obtained. The parameters obtained are the coefficients of each term in the function used to fit the profile, error in the estimation of each parameter and reduced chi square value. We estimated the peaks in I mag and (VI) mag of the distribution, errors and goodness of fit. Regions with peak errors greater than 0.1 mag and those with reduced chi square value greater than 2.0 are omitted from the analysis. This rejection is similar to that adopted by Subramaniam (2003). The number of regions short listed to map the structure reduced to 5754. The analysis followed is similar to that presented in Subramaniam (2003). In this analysis, we have not incorporated the incompleteness due to crowding, especially in the central regions where the effect is expected to be prominent. In order to estimate the effect due to crowding and the incompleteness, we compared the estimated parameters with and without incompleteness correction Subramanian & Subramaniam (2009). Subramanian & Subramaniam (2009) used OGLE II data for the analysis. Also, we compared the values obtained from OGLE II data Udalski et al. (2000) incorporating incompleteness correction with the present estimates, in the next section. We did not find any significant difference between the parameters, suggesting that the incompleteness/crowding does not affect the results presented here.
3 Results: Structure of the inner LMC
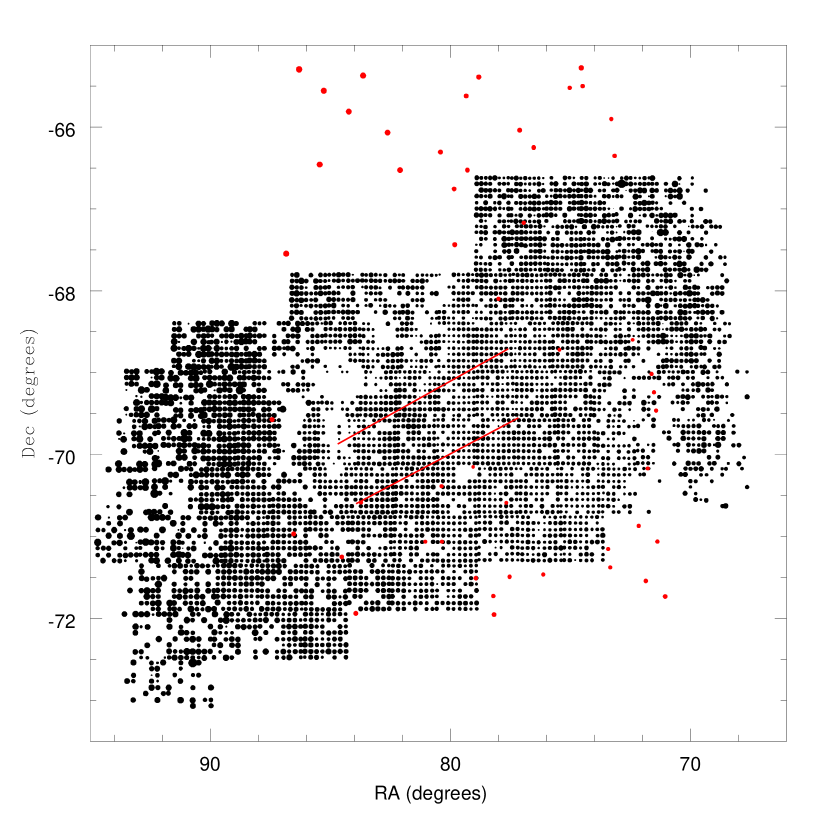
The peak values of the colour, (VI) mag at each location is used to estimate the reddening. The reddening is calculated using the relation E(VI) = (VI) 0.92 mag. The intrinsic colour of the RC stars is assumed to be 0.92 mag Olsen & Salyk (2002). The interstellar extinction is estimated by = 1.4 E(VI) Olsen & Salyk (2002). After correcting the mean I mag for interstellar extinction, for each region is estimated. The difference in between regions is a measure of the relative distances such that 0.1 mag in corresponds to 2.3 Kpc in distance. The estimated high resolution map of the LMC is shown in figure 1. This shows the variation in structure, which is basically the variation in relative distance in the line of sight, and/or variation in RC population. The center of the LMC is taken to be (2000.0) de Vaucoulers & Freeman (1973). Only regions with total error in I0 less than 0.03 mag are used for the analysis and a difference of 0.1 mag corresponds to a statistical significance of 3 . We have also shown the approximate location of the bar, using two parallel lines. This is the region covered by OGLE II scans. Since same technique was used by Olsen & Salyk (2002) for regions located mostly in the disk, we compared our estimates with their reddening corrected mean RC magnitudes. These are shown as red points in figure 1. The points are shown such that bigger dots correspond to regions located closer (since they appear brighter) and smaller dots correspond to regions located farther away (since they appear fainter).
The absence of any definite feature correlated to the location of the optical bar in the plot is striking. This suggests that the bar is not located in front of the disk, at least in the tracer adopted. Thus, the bar is likely to be very much part of the LMC disk. In order to compare the location of the disk studied by Olsen & Salyk (2002), we have shown their locations in red, and the size of the dots follow the same convention. OGLE III fields span a wider range in RA, but smaller range in Declination, whereas the regions studied by Olsen & Salyk (2002) cover the Declination more, especially the northern disk regions. It is should noted that this study has a continuous sampling of the central LMC, unlike Olsen & Salyk (2002). Their data match with the present estimations very well in the overlapping regions. This is better verified in figure 3.
Another striking feature is the brightening of the RC stars towards the eastern end of the bar. This region is outside the bar and located in the disk. The line of nodes of the LMC is along the bar, therefore the magnitude variation due to the effect of inclination is not expected along the bar. On the other hand, the figure shows that regions located to the east of the bar along the same position angle, are brighter. Along the major axis, a mild warp in the western end is also suggestive. These features could also be due to a different RC population, perhaps due to a gradual change in the star formation history or metallicity with radial distance. The warp found by Olsen & Salyk (2002) is in the regions which are located to the south-west of the OGLE III region.
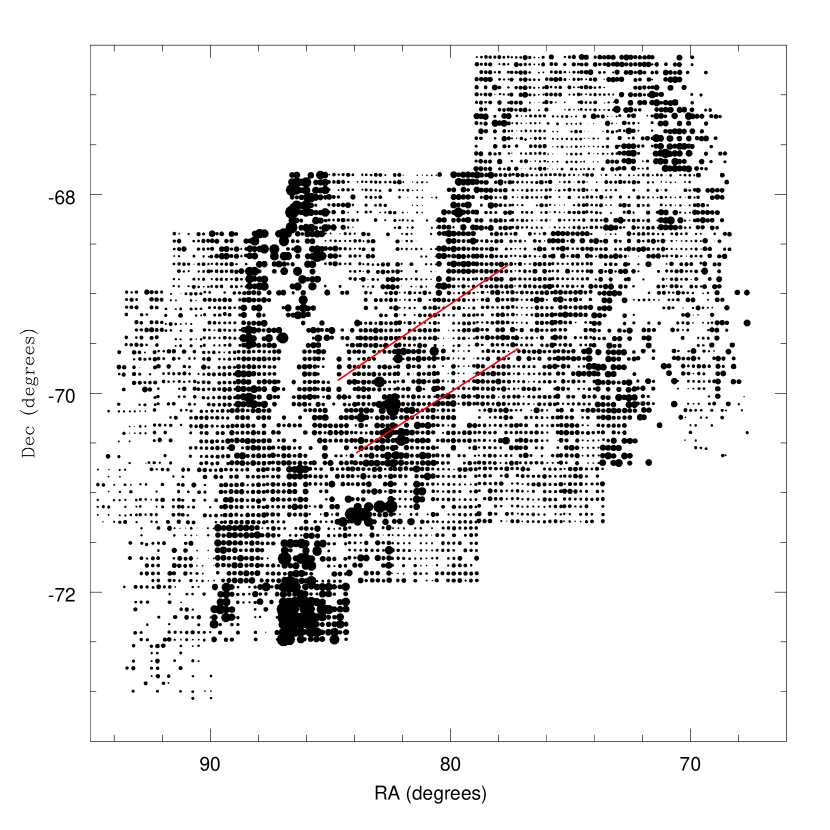
In order to see the effect of the reddening in the results arrived at, the E(VI) mean reddening map is shown in figure 2. The minimum and maximum reddening values are 0.02 - 0.3 mag, where most of the regions show reddening less than 0.15 mag. By comparing figures 1 and 2, it can be seen that the vertical structure, if any, as seen in figure 1 does not correlate with the pattern of mean reddening. Thus, the reddening correction does not have any bearing on the structure map derived in figure 1.
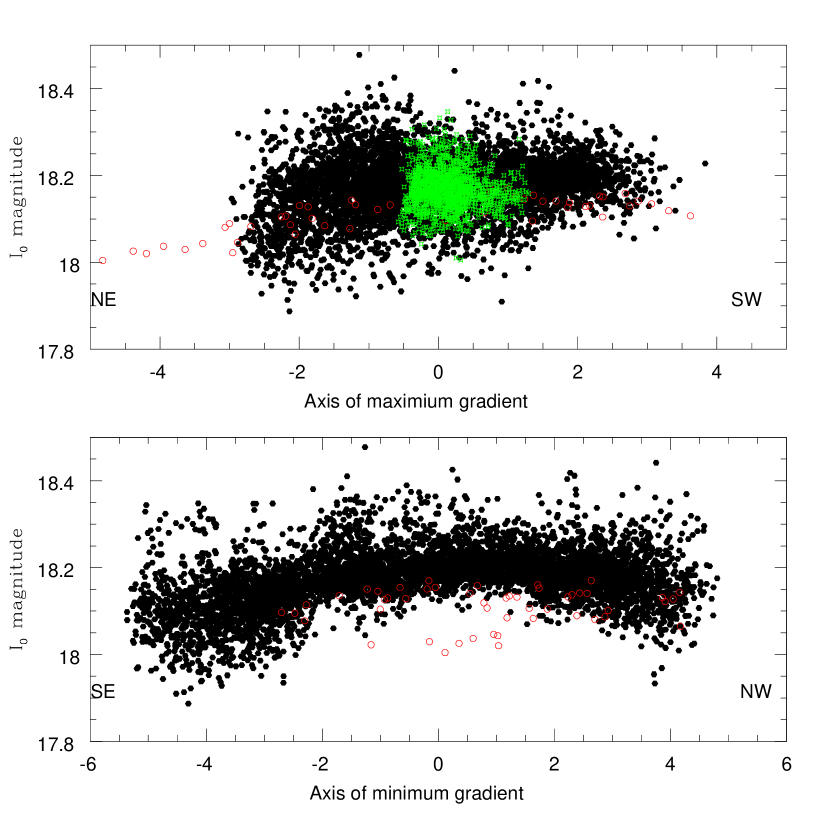
The edge on view of the LMC along the axes of minimum and maximum gradient are shown in figure 3. The line of nodes is taken as PA = 121.o5 van der Marel (2001). The lower plot shows the edge on view, along the line of nodes and is not expected to show any gradient in magnitude across the disk. The upper plot shows the magnitude variation along the perpendicular axis, and this is the axis which shows maximum variation in magnitude. The direction of the plotted axes are indicated. The data from Olsen & Salyk (2002) are shown as red open circles. We have also compared the estimates obtained by Subramaniam (2003) for the OGLE II region, after incorporating incompleteness correction, shown as green points. These are shown only in the upper plot so that, the lower plot is not crowded to hide any features suggesting a non-planar bar with respect to the disk. The OGLE II data agree very well with the OGLE III data. The data from Olsen & Salyk (2002) also match well. The brighter points seen in the lower plot are from their north-eastern region, which are outside the OGLE III region. The bar is located between X= -2 to +2 degrees, along with the disk in this edge on view. In this central region, we see a single and relatively thin structure, suggestive of the bar located within the disk and in the plane of the disk. Some regions located to the eastern and western ends show signatures of warp, as suggested by the brighter points. The upper panel is suggestive of gradient in , which is basically the inclination of the disk. We also find that the north-eastern regions show relatively large range in I0, when compared to the south-western regions. The regions observed by Olsen & Salyk (2002) in the north-eastern side are located outside our field and are brighter, though regions within OGLE III are comparable. Both the plots suggest that some regions located away from the center have brighter RC magnitudes, suggesting that there are extra-planar features/warps or variation in RC population, with radial distance.
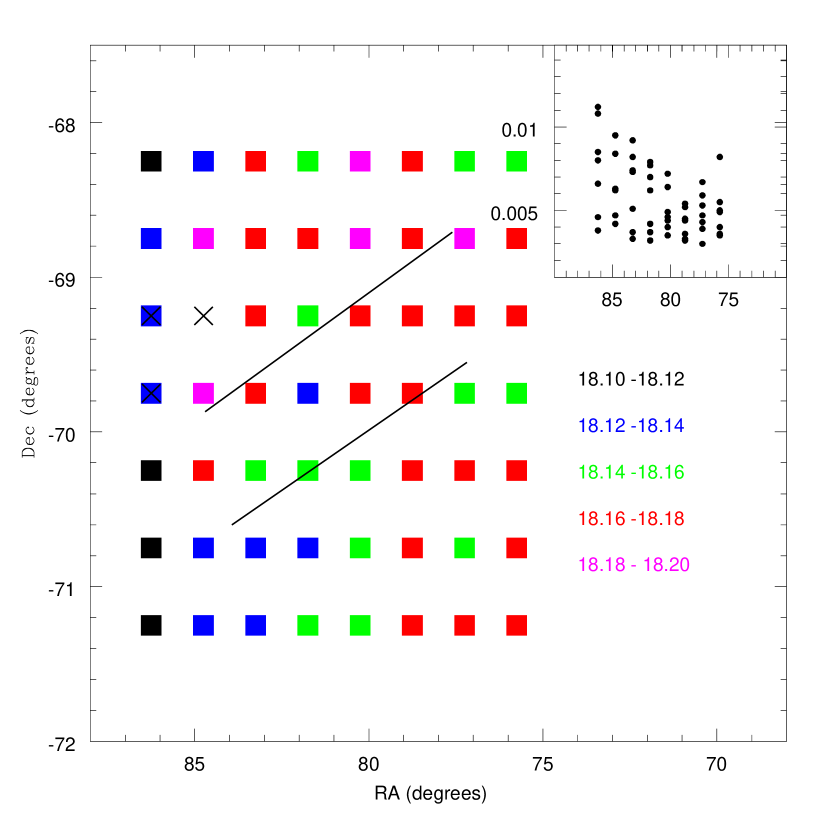
In order to prove the coplanarity quantitatively, we have averaged values in a bin of 1.o5 in RA and 0.o5 in Dec. Number of regions averaged vary between 25 -55. The bar and the nearby regions are shown in figure 4. This plot also shows the rms error in the estimated mean within the bin. Thus the resolution shown in colour code (0.02 mag) is of the order of 3 . Regions with error more than 0.01 mag are shown with crosses, where one region has large error (0.03 mag). The averages shown for the bar are very similar to the result from OGLE II analysis Subramaniam (2003). We also confirm their result of eastern part of the bar located closer than the western end. The average values in the bar region range between 18.12 to 18.18 mag (east to west), similar to the adjoining disk. The southern disk is brighter than the bar by 0.02 mag and the eastern regions are brighter by 0.02 mag, suggesting that the bar is behind the eastern and the southern disk by 0.02 mag. The western and the northern disk have similar average as the bar, within 0.02 mag. There is one location in the northern region, where it is fainter than the bar by 0.02 mag. The north-eastern regions have large rms errors due to less number of regions to average. These regions have values similar to the adjoining bar region. Koerwer (2009) found a probable brightening of RC stars in the bar region by 0.04 mag. We do find the one localised region, near the center of the bar to show a similar brightening. To summarise, there is significant variation in the average value of , along the bar as well as in the adjoining disk. The bar and the disk are found to be coplanar within 0.02 mag.
4 Discussion
The result derived here rules out the possibility that the bar may be located in front of the disk. The reddening in the LMC has been found to vary with the tracer, Subramaniam (2005) & Zaritsky (1999) and hence same tracer is used for reddening estimation. Also, the data presented here agree very well with the previous estimations by Subramaniam (2003) and Olsen & Salyk (2002). The analysis of Olsen & Salyk (2002) had points which are widely separated and Subramaniam (2003) used only the bar region. Thus a comparative study of the bar and the disk with homogeneous data was not possible so far. The effect of crowding on the parameter estimation while studying the bar and the outer disk regions was considered by Subramanian & Subramaniam (2009). They found marginal difference when one included incompleteness correction for the bar region. Thus the study presented here uses a method which was used earlier and uses a homogeneous data which cover the bar and the inner disk.
The structure map clearly shows that the LMC bar is very much part of the LMC disk and cannot be differentiated from the disk as a separate entity. The estimated value of shows similar range in the bar as well as in the disk region, making it difficult to differentiate the bar from the disk. The observed range of average values (18.12 - 18.18 mag) in the bar region, tallies very well with the surrounding disk within 0.02 mag. Zhao & Evans (2000) suggested that the bar could be a misaligned and off-set along the line of sight direction by about 2 kpc. This study indicates that there is no difference between the mean distance to the bar and disk, though both the entities have large dispersion about the mean, indicating a not so thin disk and the bar Subramanian & Subramaniam (2009).
The range of estimated value decreases for regions located at the eastern and western end of the observed region. The figures also suggest a warp in the eastern and the western end of the observed region along the major axis. This is in addition to the warp found by Olsen & Salyk (2002) in the south-western part of the LMC disk. The gradual brightening of the RC stars with increasing radial distance from the center could also be due to change in the RC population. A detailed analysis of the star formation history along with metallicity is required to identify whether these are real warps or just different RC population.
References
- de Vaucoulers & Freeman (1973) de Vaucoulers, G., & Freeman, K.C. 1973, Vistas Astron., 14, 163
- Dottori et al. (1996) Dottori, H., Bica, E., Claria, J.J., Puerari, I., 1996, ApJ, 461, 742
- Girardi et al. (1998) Girardi, L., Turfus, C., Putman, M.E., 1998, ApJ, 507L, 35
- Girardi & Salaris (2001) Girardi, L., & Salaris, M. 2001, MNRAS, 323, 109
- Koerwer (2009) Koerwer, J.F., 2009, AJ, 138, 1
- Nikolaev et.al. (2004) Nikolaev, S., Drake, A.J., Keller, S.C., et al, 2004, ApJ, 601, 260
- Olsen & Salyk (2002) Olsen, K.A.G., & Salyk, C. 2002, AJ, 124, 2045
- Rieke & Lebofsky (1985) Rieke, G.H., & Lebofsky, M.J., 1985, ApJ, 288, 618
- Smecker-Hane et al. (2002) Smecker-Hane, T.A., Cole, A. A., Gallagher, J. S. III, Stetson, P. B., 2002, ApJ., 566, 239
- Staveley-Smith et al. (2003) Staveley-Smith, L., Kim, S., Calabretta, M.R., et al. 2003, MNRAS, 339, 87
- Subramaniam (2003) Subramaniam, A., 2003, ApJ, 598, L19
- Subramaniam (2005) Subramaniam, A., 2005, A & A, 430, 421
- Subramanian & Subramaniam (2009) Subramanian, S., & Subramaniam, A., 2009, A&A, 496, 399
- Udalski et al. (2000) Udalski, A., Szymanski, M., Kubiak, M., Pietrzynski, G., Soszynski, I., Wozniak, P., and Zebrun, K. 2000, Acta Astron., 50, 307
- Udalski et al. (2008) Udalski, A., Soszynski, I., Szymanski, M. 2008, Acta Astron., 58, 89
- van der Marel (2001) van der Marel, R.P. 2001, AJ, 122, 1827
- van der Marel (2006) van der Marel, R.P. 2006, Igal.symp., 47
- Zaritsky (1999) Zaritsky, D., 1999, AJ, 118, 2824
- Zaritsky (2004) Zaritsky, D., 2004, ApJ, 614L, 37
- Zaritsky et al. (2004) Zaritsky, D., Harris, J., Thompson, I. B., et al. 2004, AJ, 128, 1606 (LMC MCPS data)
- Zhao & Evans (2000) Zhao, H.S., & Evans, N.W., 2000, ApJ, 545, L35
- Zhao et al. (2003) Zhao, H.S., Ibata, R.A., Lewis,G.F., & Irwin, M.J., 2003, MNRAS, 339, 701