Tuning the electron-phonon coupling in multilayer graphene with magnetic fields
Abstract
Magneto Raman scattering study of the E2g optical phonons in multi-layer epitaxial graphene grown on a carbon face of SiC are presented. At 4.2K in magnetic field up to 33 T, we observe a series of well pronounced avoided crossings each time the optically active inter Landau level transition is tuned in resonance with the E2g phonon excitation (at 196 meV). The width of the phonon Raman scattering response also shows pronounced variations and is enhanced in conditions of resonance. The experimental results are well reproduced by a model that gives directly the strength of the electron-phonon interaction.
pacs:
73.22.Lp, 63.20.Kr, 78.30.Na, 78.67.-nLattice vibrations in solids can be effectively modified via their coupling to electronic excitations, as, for example, evidenced by observations of Kohn anomalies in metals Kohn (1959); A. Q. R. Baron et al. (2004), of coupled phonon-plasmon modes in polar semiconductors Mooradian and Wright (1966); A. Wysmolek et al. (2006) or of different phonon spectra in metallic and semiconducting carbon-nanotubes S. Reich et al. (2004). The electron-phonon interaction is currently intensively studied in graphene Ando (2006); Neto and Guinea (2007); J. Yan et al. (2007); S. Pisana et al. (2007) which is a two-dimensional crystal of carbon atoms arranged in a honeycomb lattice and a semimetal with characteristic dispersions of electronic states displaying Dirac cones near the Fermi energy Geim and Novoselov (2007); A. H. Castro Neto et al. (2009). The case of the long wavelength optical E2g-phonons at the -point of the Brillouin zone, which corresponds to the relative displacement of two nonequivalent carbon atoms in the unit cell of graphene Ando (2006); Neto and Guinea (2007), is of particular interest. The perturbation due to this displacement is effective in inducing the direct () electronic transitions across the Dirac point: E2g-phonons efficiently couple to those low energy interband excitations Ando (2006); Neto and Guinea (2007) that are unique to graphene. The spectrum of these excitations (its low energy onset) can be modified by tuning the Fermi energy . This was achieved in gated graphene flakes on Si/SiO2 substrates where the electrically modified E2g-phonon spectrum was traced with Raman scattering methods J. Yan et al. (2007); S. Pisana et al. (2007).
The spectrum of the graphene E2g-phonon is expected to be even more severely modified by applying a magnetic field perpendicular to the 2D plane Ando (2007); M. O. Goerbig et al. (2007), i.e., when a continuous spectrum of electronic excitations is transformed into a series of quasi-discrete inter Landau level excitations characteristic of a 2D system. In conditions of Landau quantization, the electron phonon coupling has a resonant character which is expected between the E2g-phonon and properly selected inter-Landau level excitations. The observation of the effects of magneto-resonant electron-phonon coupling in graphene structures, which we present in this letter, has been an experimental challenge 111The experimental approaches to trace the magneto-phonon resonance effects in graphene flakes on Si/SiO2 substrates have been presented by J. Yan et al. at the APS 2009 March meeting in Pittsburg and by S. Remi et al. at the KIAS Graphene meeting in Seoul. Notably, S. Remi et al. has reported the splitting and not a simple shift of the E2g phonon in the Raman spectrum at B = 11 T of likely quasi-neutral graphene. aiming at verification of theoretical predictions Ando (2007); M. O. Goerbig et al. (2007) and eventual confirmation of the conclusions drawn from zero-field measurements J. Yan et al. (2007); S. Pisana et al. (2007).
We report here on magneto-Raman scattering studies of the E2g-phonon band of multilayer epitaxial graphene on the carbon face of a SiC substrate (MEG), in fields up to 33 T, and low, liquid helium temperatures. The measured E2g-band is observed to be composed of two components: one fixed and another oscillating with the applied field. The extracted oscillatory component of the E2g-band shows the theoretically anticipated magneto-phonon multi resonance Ando (2007); M. O. Goerbig et al. (2007). Pronounced variations of the energy position and width of this line can be understood in terms of a series of avoided crossings each time the E2g-phonon energy tends to match the energy of the specific (defined by appropriate selection rules) inter Landau level excitations. Comparison of the experimental results to existing models allows us to analyze the characteristic strength of the electron-phonon interaction in the investigated graphene system. Possible origin of the field-independent component of the E2g-band is discussed.
Raman scattering spectra were measured using the Ti:Saphire laser setup, tuned at accurately controlled wavelength in the range =720 nm, in order to minimize the superfluous Raman signal of optical fibers which were used to transmit the excitation light to, and to collect the Raman photons from the sample. The sample was immersed in a helium gas kept at T K and placed in a resistive magnet delivering fields up to T. The non-polarized Raman scattering spectra were measured in nearly back-scattering Faraday geometry: the arrangement of the excitation and collection fibers (both with core diameters of 200 m) with respect to sample surface is sketched in the inset of Fig. 1a. Typical excitation power was mW, spread over 600 m -diameter laser spot on the sample. The collected light was dispersed with a single grating spectrometer (spectral resolution =0.3nm) equipped with nitrogen cooled CCD detector and band pass filters were used to reject the stray light.
The MEG structures which we have used for experiments were fabricated by thermal decomposition of the carbon face of a 4H–SiC substrate C. Berger et al. (2004). Two investigated structures, both with a relatively large number of graphene layers, show similar data and we present here the results obtained for the sample which contains layers. We used strongly graphitized samples to enhance the Raman scattering signal, particularly because the E2g-phonon band in MEG samples appears on the background of the two-phonon Raman scattering processes in the SiC substrate. A number of experimental studies, including magneto-absorption M. L. Sadowski et al. (2006); M. Orlita et al. (2008) and micro-Raman scattering measurements C. Faugeras et al. (2008), show that Dirac-like electronic bands, which are genuine of a single graphene sheet, persist in MEG structures and that a large part of these layers is practically neutral, with carrier densities as low as cm-2 and fairly high mobilites up to 250000 cm2/(V.s) M. Orlita et al. (2008). The electronic bands in MEG grown on the carbon face of SiC are alike those of a single layer because of preferentially rotational and not Bernal-type layer stacking in this material J. Hass et al. (2008); dos Santos et al. (2007); Latil et al. (2007); L. Magaud et al. (2009). Although we believe that the majority of the structure probed in our experiments displays neutral graphene-like electronic system, the MEG samples and in particular the strongly graphitized specimens are not expected to be uniform on the scale of 600 m defined by the actual size of the laser spot on the sample. For example, the presence of Bernal stacked minority inclusions in these structures has been seen with micro-Raman scattering experiments C. Faugeras et al. (2008).
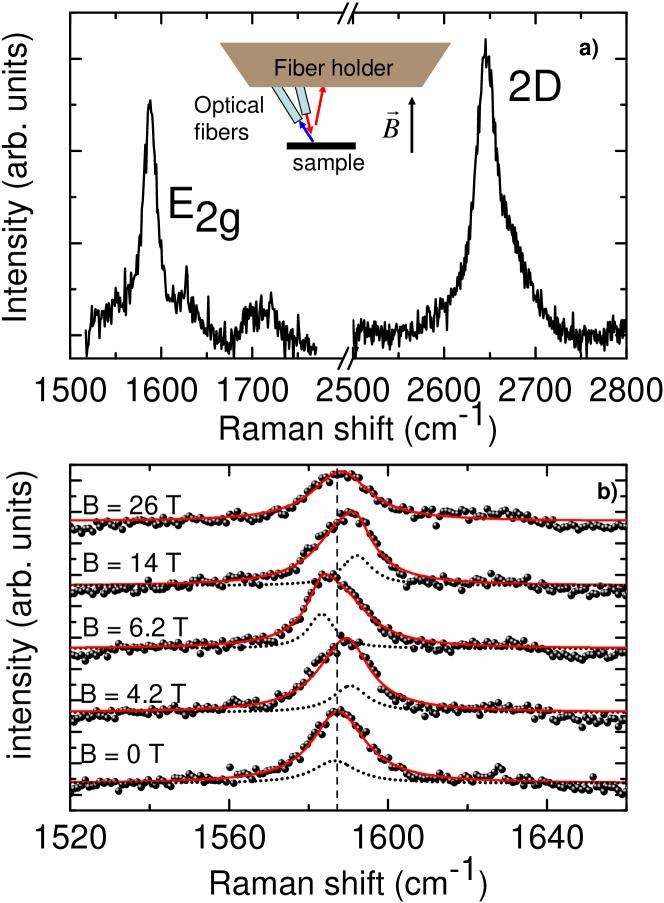
The representative Raman scattering bands observed for our layers MEG sample in the absence of magnetic field are shown in Fig. 1a. The so-called ”2D” band, which is frequently analyzed to characterize different graphene structures A. C. Ferrari et al. (2006); D. Graf et al. (2007), appears at 2646 cm-1 as a 35 cm-1-wide, slightly asymmetric line. A pure single Lorentzian shape of the ”2D” line is a signature of the electronic system with simple Dirac-like electronic states, such as those characteristic of graphene or of the majority part of the MEG structures. We understand that the observation of the high energy asymmetry in the ”2D” line under the present experimental conditions is a consequence of signal averaging from a relatively large portion of the sample, which includes other than simple graphene-like structures (i.e., Bernal stacked residues).
The focus of this work is on the E2g-phonon line which clearly dominates over the background of two-phonon signal from SiC substrate and peaks at 1586.5 cm-1 in the Raman scattering spectrum measured at zero magnetic field (Fig. 1a). As shown in Fig. 1b with background corrected spectra, the E2g-phonon line is visibly affected by the application of the magnetic field. A more detailed data inspection shows however that the E2g line is practically field independent at high field region above B T. Hence, one may anticipate that the observed magneto-Raman spectrum of the E2g-phonon is composed of two components: one oscillating with field and the second one which is field independent and dominant at B T. Indeed, as illustrated in Fig. 1b, the E2g spectrum measured at any magnetic field can be fairly well fit with two-Lorentzian functions (solid red lines). The field independent component I has been set to reproduce the spectrum at B T. The resulting oscillatory component is shown with dashed lines in Fig. 1b. To present the full data collection, the I Lorentzian function has been extracted from each measured spectrum and the resulting differential spectra (oscillatory part) are shown in Fig. 2, in form of the intensity false color map. Full points in this figure denote the peak position (center) of the Lorentzian functions which fit the oscillatory component.
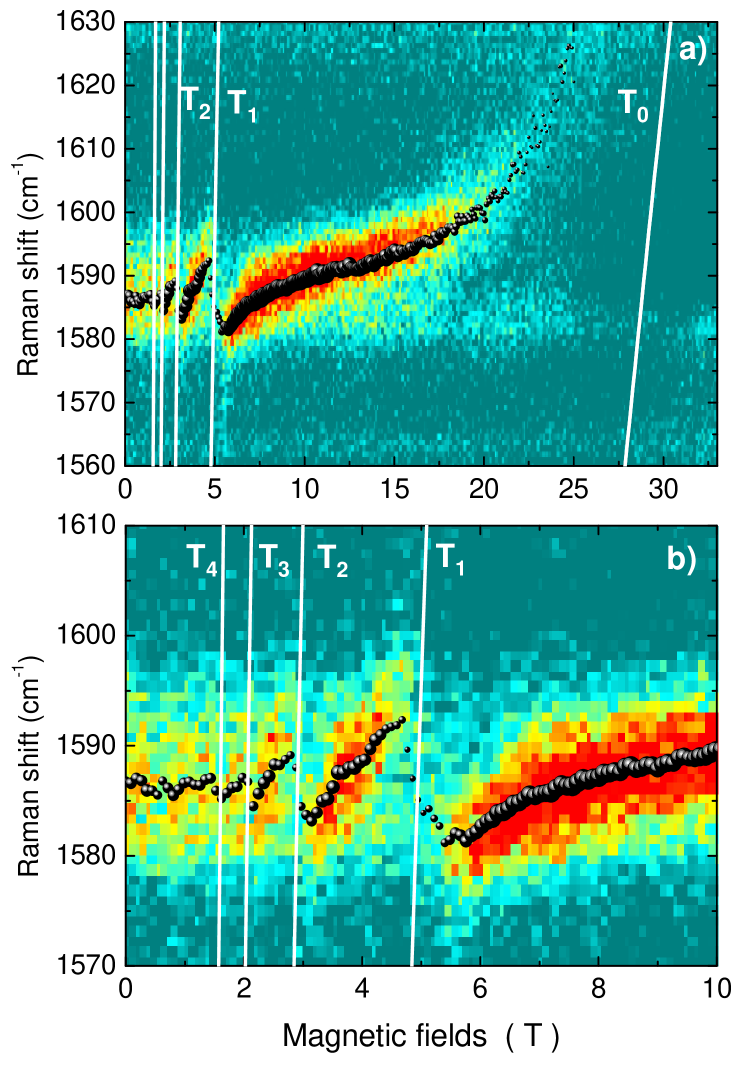
The magnetic field evolution of the spectra shown in Fig. 2 can be clearly seen as resulting from a series of avoided crossings between the E2g phonon excitation and the specific inter Landau level electronic transitions. The energy ladder of Landau levels (; ) of the two-dimensional Dirac-like electronic system is given by E, where the measured slope of the Dirac cone (Fermi velocity) in the investigated structures M. L. Sadowski et al. (2006); M. Orlita et al. (2008). As illustrated in Fig. 2, the E2g-phonon couples to a series of transitions which fulfill the selection rules and therefore appear at energies (). Notable, the same selection rules apply to optically active inter Landau level transitions which are observed in far-infrared magneto-transmission spectra Ando (2007); M. O. Goerbig et al. (2007); M. L. Sadowski et al. (2006, 2007). The amplitude of the observed ”anticrossings” grows with the magnetic field because, as a rule, the splitting () between coupled modes is proportional to the square root of the oscillator strength of the uncoupled excitations and to the square root of interaction parameter . In our case, these are electronic excitations which become enhanced by the magnetic field. This is primarly due to the increasing with B-field Landau level occupation ( degeneracy). If broadening is neglected we roughly expect and derive more rigorously M. O. Goerbig et al. (2007): , for our neutral Dirac-like system.
For the sake of more quantitative data analysis we consider both the characteristic phonon energy as well as its broadening which is another inherent element of mode coupling effects. In Fig. 3 we re-plot the center and add the extracted linewidth (HWHM) of the Lorentzian peak which fits the magneto-oscillatory component of the measured E2g-line. The magneto-oscillations in the peak position are accompanied by oscillations in the linewidth which, as expected, is enhanced under resonant conditions. To reproduce the data of Fig. 3, we adopt the approach of Ando Ando (2007) to our neutral Dirac-like system and derive the phonon energy and broadening parameter by extracting from the equation which defines the poles of the phonon Green’s function:
where stands for the phonon energy of the neutral system at B=0 T and accounts for the broadening characteristic for electronic excitations. The measured linewidth has been assumed as a convolution sum , where accounts for other, than electron-phonon coupling, broadening mechanisms.
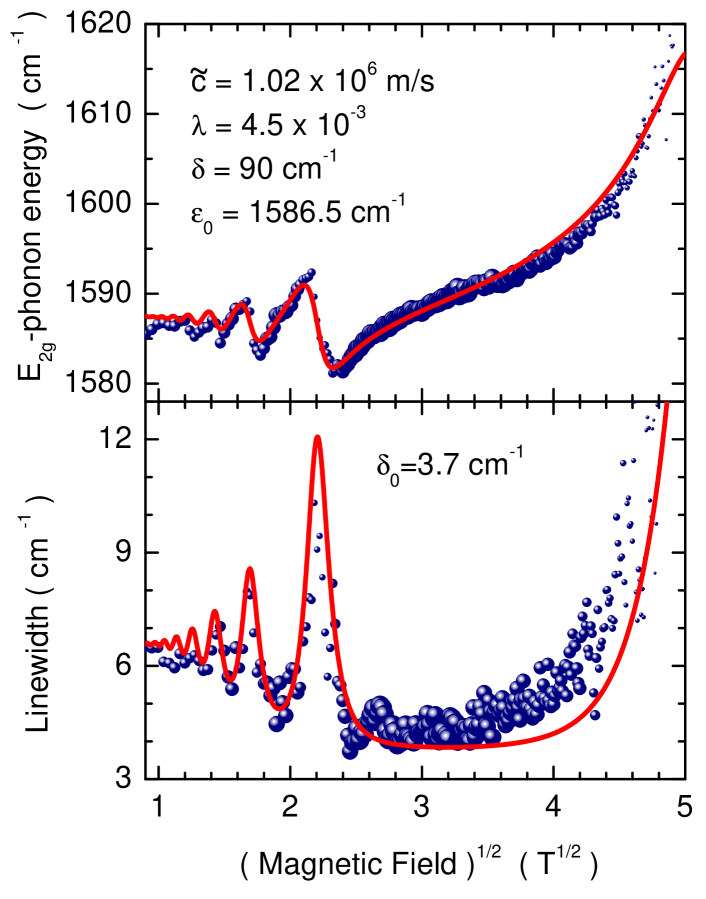
To calculate the energy and broadening of the E phonon spectrum we fix the value of as derived from far-infrared magneto-absorption experiments on MEG samples M. L. Sadowski et al. (2006); M. Orlita et al. (2008). Working effectively with only two adjustable parameters and ( = 3.7 cm-1 is the background correction to the linewidth oscillations) the experimental data can be fairly well reproduced. Optimal choice of parameters is: cm-1 and . The extracted strength of electron-phonon coupling is in excellent agreement with estimations of in the range of from the detailed analysis of the dispersions of the E2g in graphene Lazzeri and Mauri (2006) and/or measurements of electrically tuned E2g-phonon in graphene J. Yan et al. (2007); S. Pisana et al. (2007). We also note that the width which is measured in between well separated resonances, i.e., when the effects of electron-phonon interaction are switched off, appears to be practically identical to its value measured under corresponding conditions () on graphene flakes on Si/SiO2 J. Yan et al. (2007). The parameter accounts for broadening of electronic states and its actual value reasonable matches the width of magneto-absorption transitions expected in our sample at high magnetic fields P. Plochocka et al. (2008). For simplicity is assumed constant, thought its increase with field () which is expected from magneto-absorption experiments M. Orlita et al. (2008) could improve the data simulation (larger broadening of the high field resonance).
The puzzle of the presented results is the origin of the field independent component of the E2g spectrum which, we note, represents the significant portion of the total spectral weight. The Bernal-stacked inclusions are first possible candidates to account for this contribution (we have checked that in fields up to 14T the magneto-Raman spectrum of the E2g band of natural graphite sample is practically field independent). However, inspecting the shape of the measured 2D band, we can rule out that the contribution from these inclusions is as large as 65 (extracted for the B = 0 T spectrum). Another candidate is a signal from highly doped layers close to the interface. This is also scarcely probable since such signal should be significantly shifted in frequency from that of the majority neutral graphene layers, which is not seen. We speculate the field independent component of the E2g line is an inherent property of the graphene-like systems 11footnotemark: 1 what remains to be understood.
In conclusion, we have investigated the magnetic field evolution of the Raman scattering response of the E2g phonons in a graphene-like system in fields up to 33 T. A pronounced avoided crossing behavior of the phonon energy and oscillations of the line width are observed each time the optically active inter Landau level excitation is tuned in resonance with the phonon energy. The experimental results are well accounted for by existing theoretical models Ando (2007); M. O. Goerbig et al. (2007) of electron-phonon coupling in graphene, with the estimated electron-phonon coupling constant .
Acknowledgements.
We would like to acknowledge fruitful discussions with V. Fal’ko and M.O. Goerbig. We acknowledge T. Kazimierczuk for help with the data analysis and A. Wysmolek for his help in the initial stage of this experiment. Part of this work has been supported by ANR projects ANR-08-JCJC-0034-01, ANR-06-NANO-019 and by the French Embassy (Partner University Fund). One of us (P.K.) is financially supported by the EU under FP7, contract no. 221515 ‘MOCNA’. M. A. thanks the Cariplo Foundation (project QUANTDEV), MICINN (Project MOSAICO) and JCYL SA052A07 for support.References
- Kohn (1959) W. Kohn, Phys. Rev. 2, 393 (1959).
- A. Q. R. Baron et al. (2004) A. Q. R. Baron et al., Phys. Rev. Lett. 92, 197004 (2004).
- Mooradian and Wright (1966) A. Mooradian and G. B. Wright, Phys. Rev. 16, 999 (1966).
- A. Wysmolek et al. (2006) A. Wysmolek et al., Phys. Rev. B 74, 165206 (2006).
- S. Reich et al. (2004) S. Reich et al., Carbon Nanotubes (2004).
- Ando (2006) T. Ando, J. Phys. Soc.Jpn. 75, 124701 (2006).
- Neto and Guinea (2007) A. H. C. Neto and F. Guinea, Phys. Rev. B 75, 045404 (2007).
- J. Yan et al. (2007) J. Yan et al., Phys. Rev. Lett. 98, 166802 (2007).
- S. Pisana et al. (2007) S. Pisana et al., Nat. Mat. 6, 198 (2007).
- Geim and Novoselov (2007) A. K. Geim and K. S. Novoselov, Nature Materials (2007).
- A. H. Castro Neto et al. (2009) A. H. Castro Neto et al., Rev. Mod. Phys. 81, 109 (2009).
- Ando (2007) T. Ando, J. Phys. Soc.Jpn. 76, 024712 (2007).
- M. O. Goerbig et al. (2007) M. O. Goerbig et al., Phys. Rev. Lett. 99, 087402 (2007).
- C. Berger et al. (2004) C. Berger et al., J. Phys. Chem. 108, 19912 (2004).
- M. L. Sadowski et al. (2006) M. L. Sadowski et al., Phys. Rev. Lett. 97, 266405 (2006).
- M. Orlita et al. (2008) M. Orlita et al., Phys. Rev. Lett. 101, 267601 (2008).
- C. Faugeras et al. (2008) C. Faugeras et al., Appl. Phys. Lett. 92, 011914 (2008).
- J. Hass et al. (2008) J. Hass et al., Phys. Rev. Lett. 100, 125504 (2008).
- dos Santos et al. (2007) J. L. dos Santos, N. M. R. Peres, and A. H. C. Neto, Phys. Rev. Lett. 99, 256802 (2007).
- Latil et al. (2007) S. Latil, V. Meunier, and L. Henrard, Phys. Rev. B 76, 201402(R) (2007).
- L. Magaud et al. (2009) L. Magaud et al., Phys. Rev. B 79, 161405(R) (2009).
- A. C. Ferrari et al. (2006) A. C. Ferrari et al., Phys. Rev. Lett. 97, 187401 (2006).
- D. Graf et al. (2007) D. Graf et al., Nano Lett. 7, 238 (2007).
- M. L. Sadowski et al. (2007) M. L. Sadowski et al., Int. J. of Mod. Phys. B 21, 1145 (2007).
- Lazzeri and Mauri (2006) M. Lazzeri and F. Mauri, Phys. Rev. Lett. 97, 266407 (2006).
- P. Plochocka et al. (2008) P. Plochocka et al., Phys. Rev. Lett. 100, 087401 (2008).