Ultra-peripheral Au+Au collisions at PHENIX
Abstract
Ultra-peripheral collisions (UPC) of heavy-ions involve long range electromagnetic interactions at impact parameters twice larger than the nuclear radius, where no nucleon-nucleon collisions occur. The first measurement of photoproduction of and of two-photon production of high-mass pairs in ultra-peripheral nucleus-nucleus interactions will be presented, using Au+Au data at = 200 GeV. The measured cross sections at midrapidity are consistent with various theoretical predictions. [1]
1 Introduction
The study of photoproduction at hadron colliders has attracted an increased interest in recent years [2, 3, 4]. Electromagnetic interactions can be studied without background from hadronic processes in ultra-peripheral collisions without nuclear overlap. This study focuses on the measurement of exclusively produced high-mass –pairs in Au+Au collisions at = 200 GeV, at midrapidity. The results [5] have been obtained with the PHENIX detector [6] at the BNL Relativistic Heavy Ion Collider (RHIC).
The electromagnetic field of a relativistic particle can be represented by a spectrum of equivalent photons. This is the Weizsacker-Williams approximation. The virtualities of the equivalent photons when the field couples coherently to the entire nucleus are restricted by the nuclear form factor to , where is the Lorentz factor of the beam and is the nuclear radius. At RHIC energies, = 108 and the maximum photon energy in the center-of-mass (lab) system is 3 GeV corresponding to a maximum photon-nucleon center-of-mass energy of 34 GeV.
The exclusive production of an –pair can proceed either through a purely electromagnetic process or through coherent photonuclear production of a vector meson, which decays into a dilepton pair. The Feynman diagrams for the two leading order processes are shown in Fig. 1.
The production cross section of vector mesons is a good probe of the nuclear gluon distribution, , as well as of vector-meson dynamics in nuclear matter [7, 8, 9]. For -production, PHENIX acceptance at corresponds to a mean photon energy of GeV and nuclear Bjorken- values of .

Measurements of coherent photonuclear production of the meson [10], as well as production of low-mass pairs [11] have been performed by the STAR collaboration. The PHENIX analysis presented in Refs. [12, 5] and summarized in this paper is the first on heavy final states in ultra-peripheral nucleus-nucleus collisions. The cross section for and photoproduction are compared with model calculations [9, 13, 14, 15, 16].
2 Experimental analysis
The data presented here were collected with the PHENIX detector at RHIC during the 2004 Au+Au run at = 200 GeV (Run-4). The PHENIX detector is equipped with multi-layer drift chambers (DC) followed by multi-wire proportional chambers (PC) with pixel-pad readout. The tracking arms also contain Ring-Imaging-Čerenkov (RICH) detectors and electromagnetic calorimeters (EMCal) for electron and positron identification.
The events used in this analysis were collected by a level-1 Ultra-Peripheral Collision (UPC) trigger set up for the first time in PHENIX in Run-4 as follows. A veto on coincident signals in both Beam-Beam Counters (BBC) selected exclusive-type events characterised by a large rapidity gap on either side of the central arm. The EMCal and the RICH decetor were used to form a trigger (ERT) to select events with at least one of the two high-energy coming from the pair. Finally at least 30 GeV energy deposited in one or both of the ZDCs was required to select events with forward neutron emission.
The total number of events collected by the UPC trigger was 8.5 M, of which 6.7 M satisfied standard quality assurance criteria. The useable event sample corresponds to an integrated luminosity .
The following cuts were applied to enhance the sample of genuine -induced events:
-
1.
A standard offline vertex cut 30 cm was required
-
2.
Only events with exactly two charged particles were analyzed. This cut allows to suppress most of non photoproduction contamination in the UPC trigger.
-
3.
A RICH cut selects which fire 2 or more tubes separated by the nominal ring radius.
-
4.
Good Track–EMCal matching is also required.
-
5.
An EMCal energy cut ( 1 GeV 1 GeV) is applied to select candidate above the ERT trigger threshold.
-
6.
Events with back-to-back candidates (detected in opposite arms) were selected.
3 Results
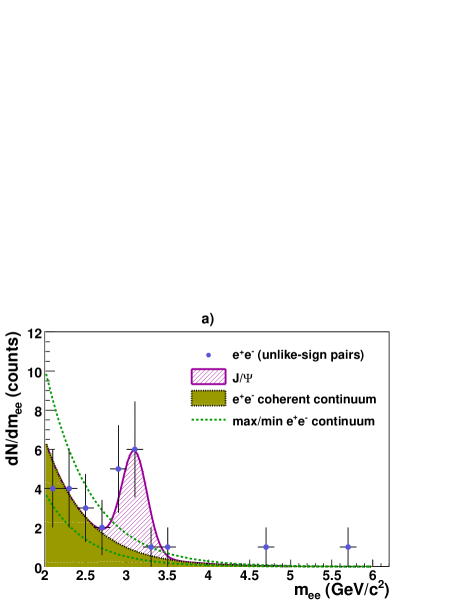
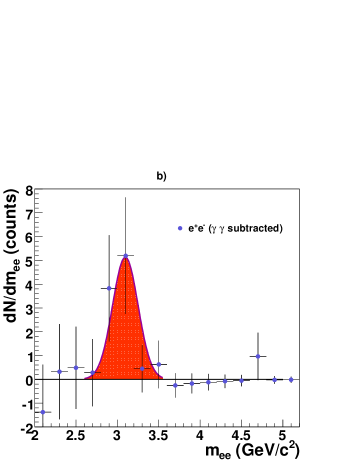
After the above cuts we find 28 events with pairs and none with like-sign pairs for GeV/c2. The measured invariant mass distribution for the sample is shown in Fig. 2 a). This distribution is fitted with a continuum (exponential) curve combined with a Gaussian function at the peak, as shown by the solid curve in Fig. 2 a). Simulations based on events generated by the starlight Monte Carlo [13, 17, 18] and processed through geant3 [19] have shown that the shape of the measured continuum contribution is well described by an exponential function . Those simulations allow us to fix the exponential slope parameter to GeV-1c2. The combined data fit is done with three free parameters: the exponential normalisation (), the yield and the peak width (the Gaussian peak position has been fixed at the known mass of = 3.097 GeV/c2 [20]). The and continuum yields and the corresponding statistical errors are calculated from the fit and summarized in Table 1. Fig. 2 b) shows the resulting invariant mass distribution obtained by subtracting the fitted exponential curve of the dielectron continuum from the total experimental pairs distribution.
Physical cross-sections were obtained after correcting the raw number of signal counts for the geometrical acceptance of our detector system, and the efficiency losses introduced by the previously described analysis cuts. Acceptance and efficiency corrections were obtained with a full Monte Carlo of the experimental apparatus with realistic starlight Monte Carlo. Such a model reproduces well the existing distribution of coherent production in UPC Au+Au events measured at RHIC by STAR [10]. The coherent events were simulated in the PHENIX detector using geant3 and passed through the same reconstruction program as the real data.
For at midrapidity the differential cross section is calculated as:
Here is the detector acceptance, is the track reconstruction efficiency, is the trigger efficiency. The integrated luminosity is given in Section 2, is the rapidity interval of the measurement. These correction factors and corresponding uncertainties are quoted in Ref. [5],and BR = 5.94% is the known dielectron branching ratio [20].
For dielectrons at midrapidity ( is the rapidity of the pair) the double differential cross section is:
where the factors are defined as for the previous equation.
| [GeV/c2] | Yield | Cross-section [b/(GeV/c2)] |
|---|---|---|
| peak | [b] | |
| cont. [2.0,2.8] | [starl.: ] | |
| cont. [2.0,2.3] | [starl.: ] | |
| cont. [2.3,2.8] | [starl.: ] |
The measured dielectron cross sections at midrapidity are in very good agreement with the starlight predictions for coherent dielectron photoproduction (rightmost column of Table 1) [18].
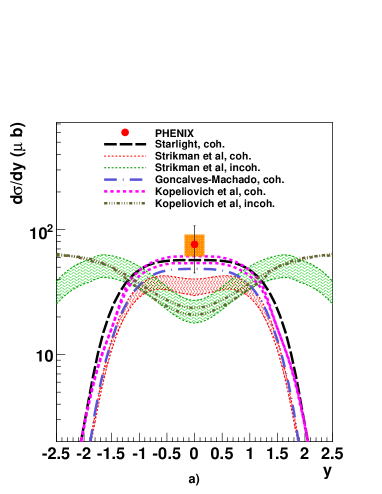
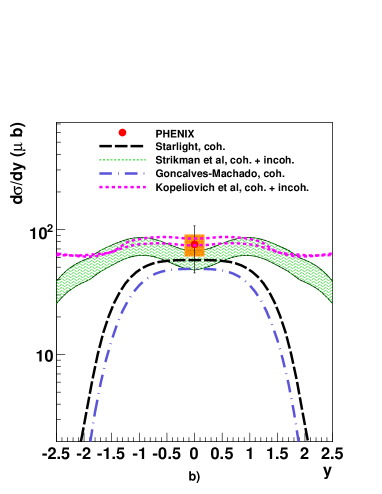
The final cross section is in good agreement, within the (still large) statistical errors, with the theoretical values computed in [17, 14, 13, 16, 18, 21] as shown in Fig. 3. For details of the comparision see Ref. [5]
References
-
[1]
Talk of M. Csanád at DIS2009,
http://indico.cern.ch/contributionDisplay.py?contribId=176&sessionId=18&confId=53294. - [2] G. Baur et al., Phys. Rept. 364, 359 (2002) [arXiv:hep-ph/0112211].
- [3] C. A. Bertulani, S. R. Klein, and J. Nystrand, Ann. Rev. Nucl. Part. Sci. 55, 271 (2005) [arXiv:nucl-ex/0502005].
- [4] K. Hencken et al., Phys. Rept. 458, 1 (2008) [arXiv:0706.3356].
- [5] S. Afanasiev et al., [arXiv:0903.2041].
- [6] K. Adcox et al., Nucl. Instrum. Meth. A499, 469 (2003).
- [7] M. G. Ryskin, R. G. Roberts, A. D. Martin, and E. M. Levin, Z. Phys. C76, 231 (1997) [arXiv:hep-ph/9511228].
- [8] L. Frankfurt, W. Koepf, and M. Strikman, Phys. Rev. D54, 3194 (1996) [arXiv:hep-ph/9509311].
- [9] L. Frankfurt, M. Strikman, and M. Zhalov, Phys. Lett. B540, 220 (2002) [arXiv:hep-ph/0111221].
- [10] C. Adler et al., Phys. Rev. Lett. 89, 272302 (2002) [arXiv:nucl-ex/0206004].
- [11] J. Adams et al., Phys. Rev. C70, 031902 (2004) [arXiv:nucl-ex/0404012].
- [12] D. d’Enterria, [arXiv:nucl-ex/0601001].
- [13] S. Klein and J. Nystrand, Phys. Rev. C60, 014903 (1999) [arXiv:hep-ph/9902259].
- [14] M. Strikman, M. Tverskoy, and M. Zhalov, Phys. Lett. B626, 72 (2005) [arXiv:hep-ph/0505023].
- [15] V. P. Goncalves and M. V. T. Machado, J. Phys. G32, 295 (2006) [arXiv:hep-ph/0506331].
- [16] Y. P. Ivanov, B. Z. Kopeliovich, and I. Schmidt, [arXiv:0706.1532].
- [17] A. J. Baltz, S. R. Klein, and J. Nystrand, Phys. Rev. Lett. 89, 012301 (2002) [arXiv:nucl-th/0205031].
- [18] J. Nystrand, Nucl. Phys. A752, 470 (2005) [arXiv:hep-ph/0412096].
- [19] GEANT - Detector Description and Simulation Tool, http://wwwasd.web.cern.ch/wwwasd/geant/.
- [20] C. Amsler et al., Phys. Lett. B667, 1 (2008).
- [21] V. P. Goncalves and M. V. T. Machado, [arXiv:0706.2810].