Probing High Parton Densities at Low- in d+Au Collisions at PHENIX Using the New Forward and Backward Muon Piston Calorimeters
Abstract
The new forward Muon Piston Calorimeters allow PHENIX to explore low- parton distributions in d+Au collisions with hopes of observing gluon saturation. We present a two-particle azimuthal correlation measurement made between a mid-rapidity particle () and a forward () wherein we compare correlation widths in d+Au to p+p and compute .
1 Introduction
Deuteron-gold collisions at RHIC provide a system wherein one can explore nuclear effects on initial-state parton densities in the absence of final-state medium effects in heavy ion collisions. RHIC experiments have shown a suppression in nuclear modification factors (, ) for d+Au collisions in the forward (deuteron) direction and an enhancement in the backward (gold) direction [1-3]. Multiple theories exist that can explain the observed suppression and enhancement, but a conclusive measurement discriminating between the different mechanisms has yet to be carried out. Two new forward electromagnetic calorimeters (Muon Piston Calorimeters or MPCs, , ) were recently installed in the PHENIX experiment allowing study of parton densities at low . The MPCs make it possible to measure nuclear modification factors in the forward and backward directions as well as azimuthal correlations of di-hadron pairs at different pseudorapidities. In these proceedings, we present the results of the first correlation measurements made with the new MPCs. The analysis presented is based on the integrated luminosity data sample of d+Au collisions at taken at RHIC in 2008. The correlation measurements are especially interesting because it is expected that they provide a strong test of gluon saturation at low in the Au nucleus [4], [5].
Two-particle correlations have previously been measured at PHENIX in d+Au and p+p collisions for two charged hadrons () detected by the central arm spectrometers () [6] and for rapidity separated particles where one particle is a in the central spectrometer () and the other particle is a punch-through hadron [3] detected in the forward or backward muon spectrometer () [7]. Throughout these proceedings “forward” (“backward”) refers to the direction of the deuteron (gold) beam.
The correlation measurement is performed with a or a in the mid-rapidity detectors () and a detected in the forward MPC. The forward serves to lower the at which we probe the gold nucleus and to provide a larger rapidity gap () than has been observed previously ( for the mid-rapidity /punch-through hadron correlations).
2 Muon Piston Calorimeters
The MPCs are PbWO4 electromagnetic calorimeters that add to the PHENIX calorimeter acceptance in the interesting forward and backward regions; one MPC is installed in the north muon piston hole () and the other in the south (), and both cover an azimuthal angle of . The towers have lateral dimensions of . The MPCs are installed cm from the nominal interaction point [8].
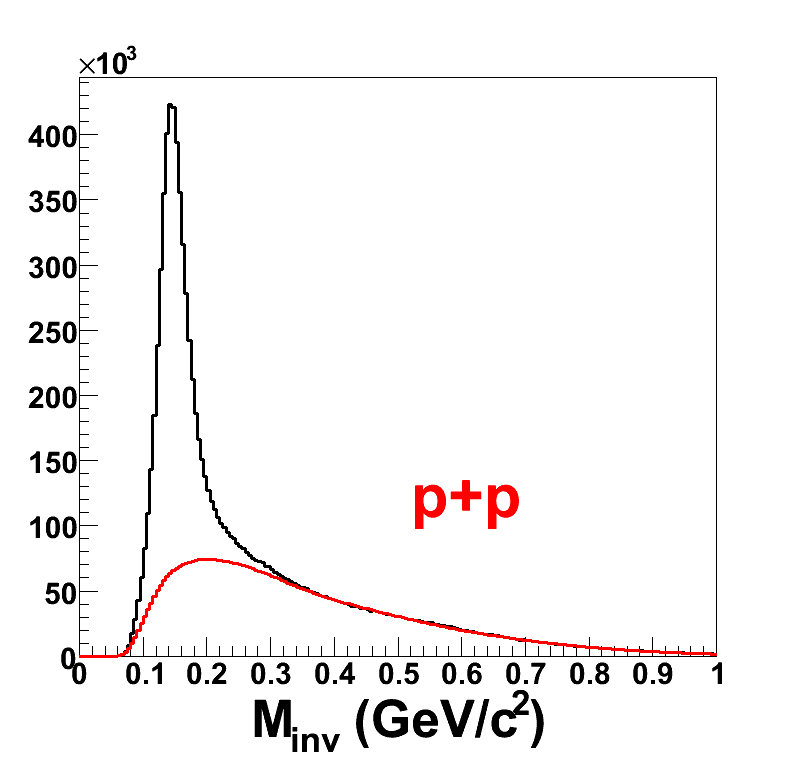
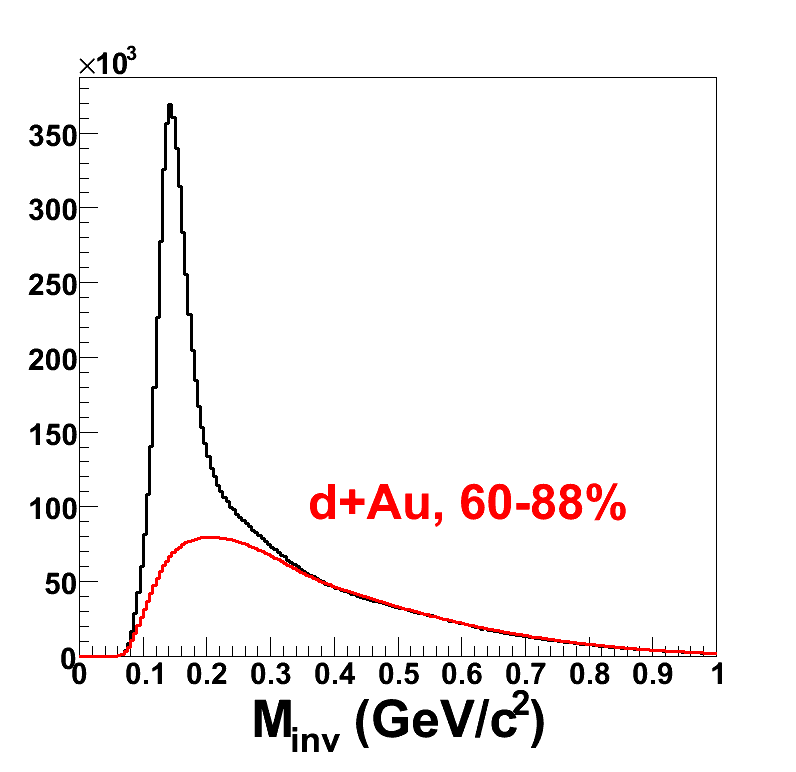
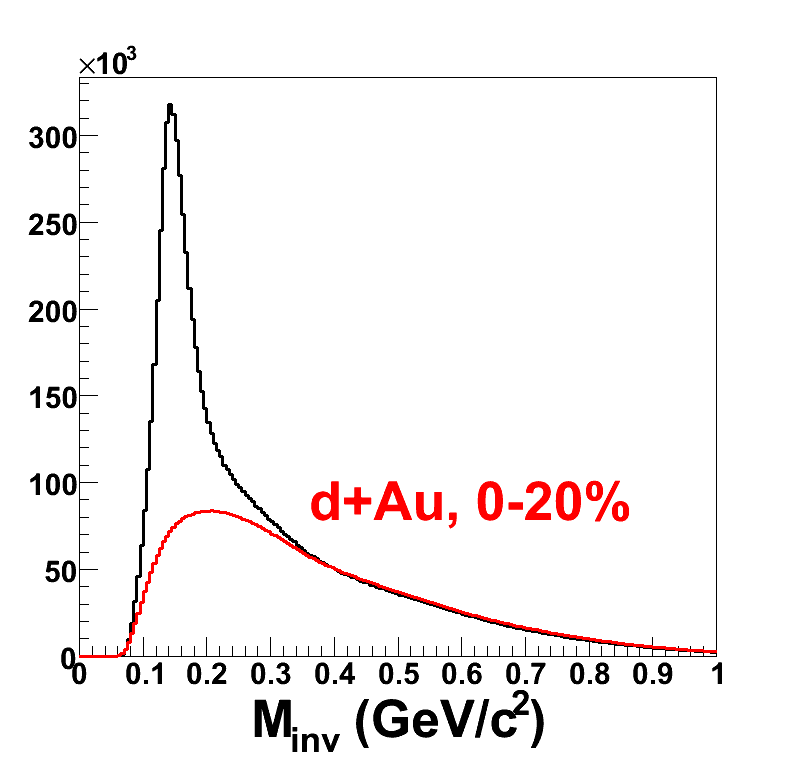
In any electromagnetic calorimeter, if the momentum of a is sufficiently high, the energy from both decay photons will be reconstructed as a single cluster. For the MPC, this merging effect dominates at and above . Hence, below , s are identified by the invariant mass spectrum of all photon pairs; while above , s are identified using single clusters.
To identify s from two photons, we use the following set of cuts: , a cluster separation cut of , an energy asymmetry cut on the two clusters of . To identify s using single clusters, we specify that . Sample invariant mass plots are shown in Fig. 1.
3 Data Analysis
In the correlation analysis, the mid-rapidity particle is the trigger particle, and the forward particle is the associate particle [9]. A peak at is not present in the distributions because the particles are separated in rapidity by approximately 3.5 units, which is wider than the width of the near side jet structure. Hence only an away side peak is expected at .

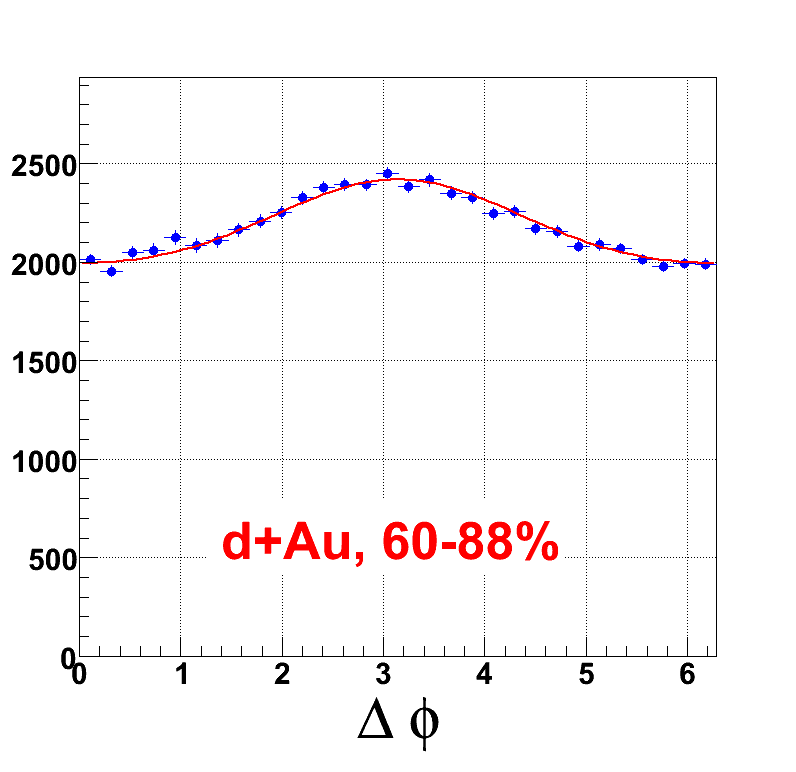
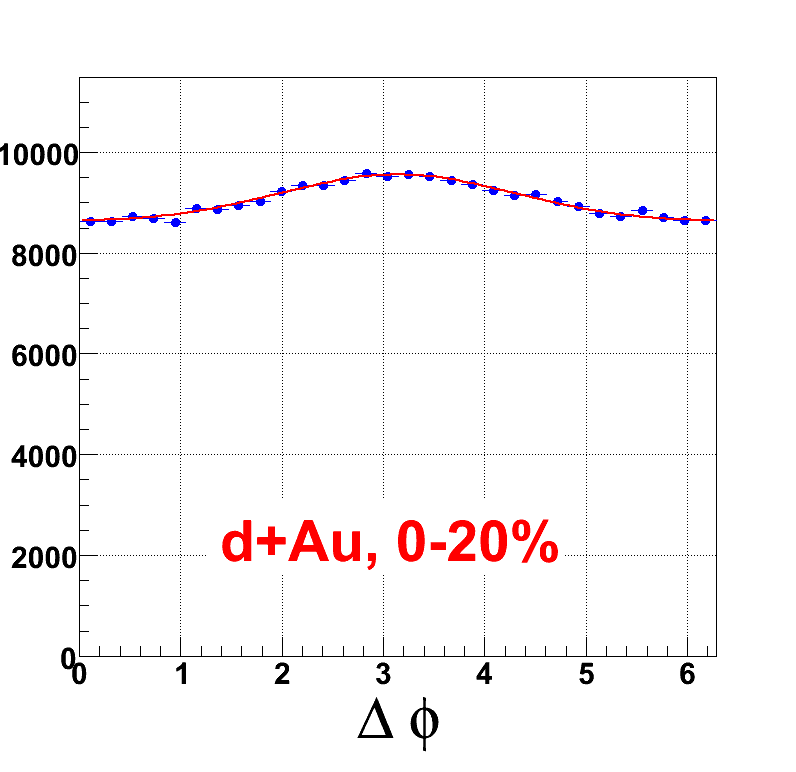
The correlation function, , is the distribution of the two particles corrected for the nonuniform detector acceptance ( is the two-particle distribution where the particles are from different events), or [9]. Example acceptance-corrected correlation functions from this analysis are shown in Fig. 2. The correlation functions are fit as a Gaussian di-jet signal on top of a constant background. Two interesting quantities to compare d+Au with p+p are the width of the Gaussian peak and the conditional (or per-trigger) yield, . The conditional yield is the efficiency-corrected pair-yield of particles produced per trigger particle detected, or
| (1) |
where is the number of trigger particles, is the detection efficiency of the associate particle, and is the constant combinatorial background determined by fitting the correlation function. We then form a ratio of the s for d+Au and p+p which is the nuclear modification factor :
| (2) |
4 Discussion
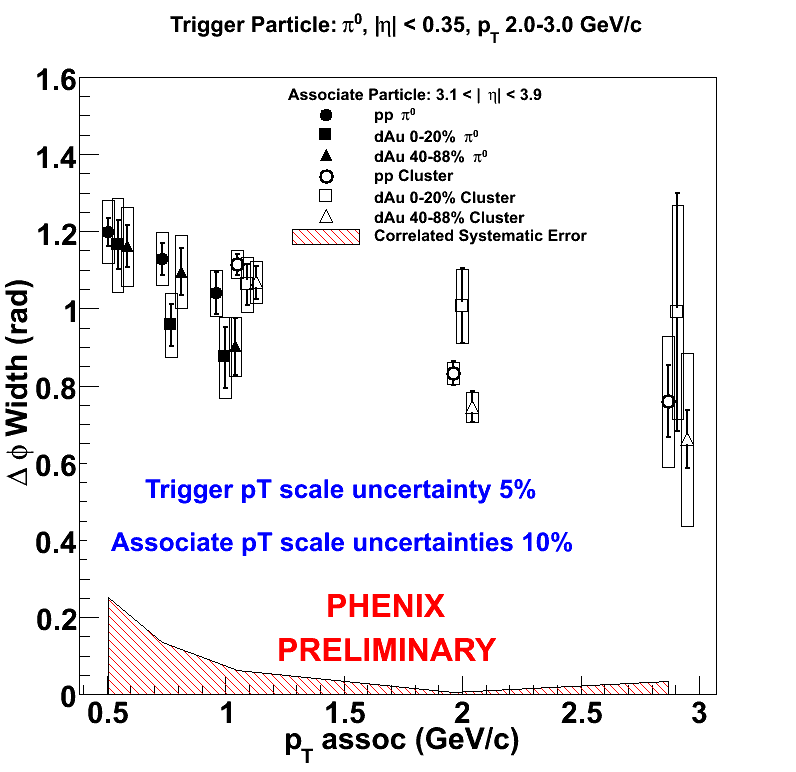
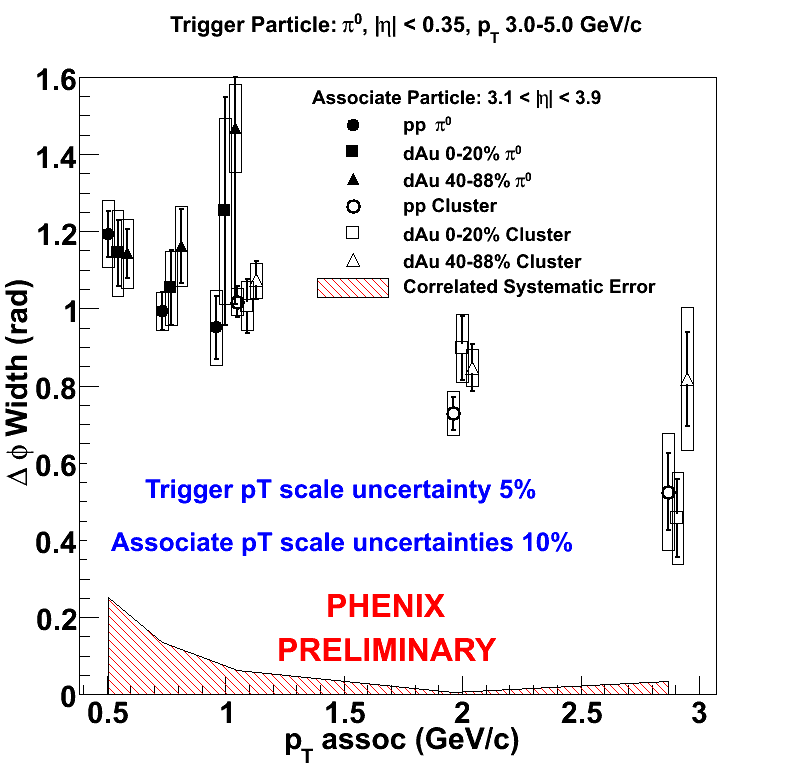
The correlation widths are shown in Fig. 3. To extend the range of the associate particle both the MPC (two-photon identification) and MPC cluster widths are shown. The widths decrease with increasing as expected from jet fragmentation. Within the precision of statistical and systematic errors, little variation can be seen when comparing the correlation widths for d+Au (central or peripheral) and p+p.
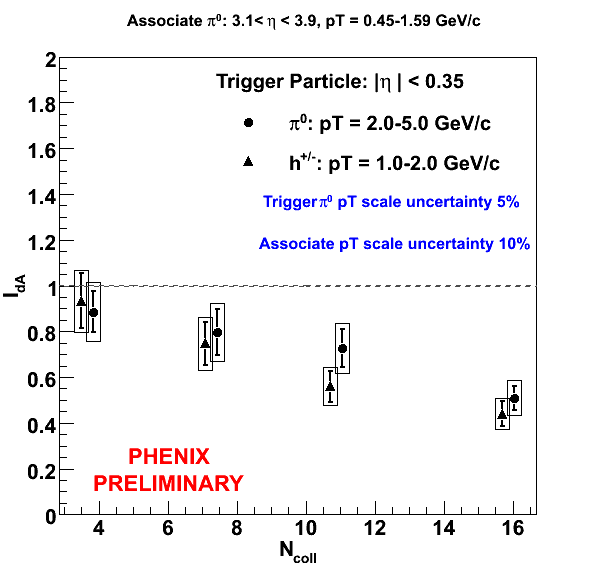
On the other hand, (see Fig. 4, formed only for MPC s and not clusters) shows a suppression with increasing collision centrality for both species of trigger particles (s, , ) that is significant.
Multiple theories are being used to explain these results (especially ); the most notable are the Color Glass Condensate (CGC) model for gluon saturation [4, 5] and pQCD based pictures such as non-leading twist shadowing used by Vitev [10]. It will be interesting to see if the d+Au forward RHIC correlation results will be able to distinguish between the above models.
This interesting result is an exciting start to a set of PHENIX di-hadron correlations that will span different total rapidities (utilizing all PHENIX detectors) and rapidity gaps, allowing studies of the effects over varying ranges of .
Acknowledgments
This work is supported by NSF PHY 0601067 and by the Department of Energy which operates RHIC and PHENIX.
References
- [1] J. Adams, et al. (STAR), Phys. Rev. Lett. 97, 152302 (2006).
- [2] I. Arsene, et al. (BRAHMS), Phys. Rev. Lett. 93, 242303 (2004).
- [3] S. S. Adler, et al. (PHENIX), Phys. Rev. Lett. 94, 082302 (2005).
- [4] D. Kharzeev, E. Levin and L. McLerran, Nucl. Phys. A748, 627-640 (2005).
- [5] L. McLerran and R. Venugopalan, Phys. Rev. D 49, 2233 (1994); Phys. Rev. D 49, 3352 (1994).
- [6] S. S. Adler et al. (PHENIX), Phys. Rev. C 73, 054903 (2006).
- [7] S. S. Adler et al. (PHENIX), Phys. Rev. Lett. 96 222301 (2006).
- [8] M. Chiu. nucl-ex/0701031.
- [9] J. Jia, J. Phys. G31, S521 (2005), nucl-ex/0409024; S. S. Adler et al. (PHENIX), Phys. Rev. C 73, 054903 (2006).
- [10] J. Qiu and I. Vitev, Phys.Lett. B632, 507 (2006) [hep-ph/0405068].