The corotation gap in the Galactic HI distribution
Abstract
We used the HI data from the LAB survey to map the ring-shaped gap in HI density which lies slightly outside the solar circle. Adopting = 7.5 kpc, we find and average radius of 8.3 kpc and an average gap width of 0.8 kpc. The characteristics of the HI gap correspond closely to the expected ones, as predicted by theory and by numerical simulations of the gas flow near the corotation resonance.
keywords:
Galaxy: structure – Galaxy: kinematics and dynamics – Galaxy: disc – Galaxy: general – galaxies: spiral1 Introduction
Since the first HI observations the existence of a ring-like minimum in the gas density distribution in the Galaxy was noticed (eg. Kerr 1969a, and Burton 1976). In these works, the authors found a gas density deficiency at radius about kpc, assuming 10 kpc, but did not map it in detail nor proposed any explanation for it. This radius would be about kpc, if we assume 7.5 kpc. It is tempting to associate this gap with the corotation radius (), i.e., the radius where the rotation velocity of the spiral pattern coincides with the rotation curve of the gas and stars. This association is suggested on one hand, by the fact that it was shown, based on different arguments or methods, that corotation is close to the orbit of the Sun (Marochnik et al. 1972, Crézé & Mennessier, 1973, Amaral & Lépine - hereafter AL-, 1997, Mishurov & Zenina, 1999a, 1999b, Lépine et al., 2001, among others). More recently, Dias & Lépine (2005, hereafter DL), using the sample of open clusters, determined by measuring the spiral pattern speed . The authors performed tests with different rotation curves and values, obtaining = 8.10.6 for kpc, and argued that this determination is almost independent on the rotation curve used.
The works mentioned above do not all adopt the same galactic parameters, but they are still in agreement, with values of proportional to V0 so that results always close to . However, there are also in the literature many determinations of giving quite different values, and even some papers proposing the existence of multiple pattern speeds. Although the value of is not the focus of the present paper, we will next comment a few of those results. Naoz and Shaviv (2007, hereafter NS), based on a similar analysis of the same data used by DL, argued that the spiral arms situated in the solar vicinity have different velocities, and reached the surprising conclusion that the Carina arm (which is usually considered as a normal arm, well fitted by a logarithmic spiral) is made of two superimposed components with different rotation speeds. What is the origin of the contradiction between the results of DL and NS? In their analysis, DL used two different methods to retrieve the birthplaces of the clusters. One is a simplified analysis which assumes that the clusters move in pure circular orbits with constant velocity ; the second method performs numerical integration of the orbits, taking into account the observed space velocities (radial velocities and proper motions) of the clusters. NS performed only the simplified analysis, with no integration of the orbits, and this could explain the discrepancy. In a more recent paper Lépine et al. (2008) showed that the clusters have typical birth-time velocities of the order of 10 kms-1 with respect to their local standard of rest (the velocity of the rotation curve at the birthplace). This means that the epicycle motion cannot be ignored for young objects and the constant velocity approximation is not satisfactory for precise measurements. The anomalous velocities of the young stars in the Carina arm is known (Humpreys & Kerr, 1974). Other measurements tend to favour DL’s results. Fernandez at al. (2001) analyzed the spiral structure of the Galaxy using samples of OB stars and of Cepheids and estimated to be about 30 kms-1kpc-1, reaching the conclusion that corotation is near the solar orbit. Examining the details of their analysis, one sees that the OB stars have large errors in distances (see Figure 1 of Torra et al., 2000, in which the sample is described) while the sample of Cepheids is much better in this aspect. Fernandez at al. mention that the Cepheids of their sample are mostly situated in the Carina-Sagittarius arm. These stars have typical ages about 108 years, being older than the OB stars, which minimizes the problem of initial velocity. The values of that they obtain with their model ”D” (the model which correspond to the smaller value of ) coincide, within the small errors quoted by the authors, with obtained by DL (24 kms-1kpc-1). Avedisova (1989) also paid special attention to the Carina-Sagittarius arm with a precise method and concluded that is 26.8 2.2 kms-1kpc-1, in agreement with DL and Fernandez at al. In contrast with the methods based on direct observations of sample of stars or clusters, gas dynamics (eg. Bissantz et al. 2003, Rodriguez-Fernandez and Combes, 2008) and N-body or test-particles simulations (eg. Chakrabarty , 2007) are not able to provide precise determination of the pattern speed, as the authors of such models recognize; they usually ”adopt” spiral pattern speeds in the range 20-30 kms-1kpc-1(30-40 kms-1kpc-1 in the case of Rodriguez-Fernandez and Combes). Minchev and Quillen (2008) predicts that the large-scale velocity surveys which are presently planned will be able to constrain the galactic parameters, including the pattern speed, in near future.
On the other hand, there are theoretical arguments and numerical simulations telling us that we should expect a minimum of gas density at corotation. The effect of the co-rotation can be understood as follows: the dynamics of the gas in the potential perturbation of the spiral arms is such that it produces a net flow towards the center inside the corotation radius, and a net flow towards the external parts of the disk, beyond corotation, resulting in pumping out the gas from the corotation region. Lacey & Fall (1985) proposed an analytical expression for the gas flow velocity on both sides of the resonance. Numerical hydrodynamic simulations were performed by Mishurov (2007) in 3D and Lépine et al. (2001) in 2D.
The renewed interest in the study of the HI circular gap is related to several of its implications that we are presently investigating. Firstly, since the corotation resonance is one of the fundamental parameters of spiral galaxies (eg. Canzian,1998), its location in the Milky Way is a question of special interest. The existence of the gap is important to confirm our understanding of the gas dynamics associated with the spiral structure of our Galaxy. The gap could also, in principle, permit us to infer a minimum ”age” of the spiral pattern, and contribute to the debate on the transient nature or the spiral structure. Possibly the gap, if it is confirmed, could explain the minimum in the rotation curve at a slightly larger galactic radius (see eg. a description of the minimum by Lépine et al., 2008). Indeed, as the rotation curve in the solar vicinity is almost completely explained by the matter contained in the disk (eg. Lépine & Leroy, 2000), in the presence of a gap, a Keplerian-like decrease of the rotation curve till the end of the gap would be expected. Furthermore, the gap and the radial flow of gas in opposite directions inside and outside corotation could be of great importance for the models of chemical evolution of the disk, aimed to explain the fine details of the gradient of metallicity. The gap in some way could turn less efficient the exchange of metallicity of the interstellar medium between the regions situated on each side.
As an example of such fine structure in the gradient of metal abundance, Andrievsky et al. (2004) in a study of the Cepheids metalicity as a function of galactic radius found an abrupt reduction in the metalicity between 10 and 11 kpc, assuming kpc. A similar step-like distribution was found by Twarog et al. (1997) in the study of metallicity of open clusters.
In the present paper, we use a kinematic distance method to estimate the distance from the Sun of the minima of HI density along the line-of-sight, for a large number of equally spaced longitudes, so as to produce a map of the location of the minima in the galactic plane. The method is based on the hypothesis of circular rotation of the gas. We make use of the recently published data from LAB survey to perform systematic analysis in the HI data which covers both hemispheres with uniform calibration.
The paper is organized as follows. Section 2 presents the data from the LAB survey used in the present work. Section 3 presents our method of analysis of the HI spectra and of mapping the regions with lowest HI density. Section 4 presents a discussion of evidences of the existence of the ring-shaped gap from other tracers and in section 5 a short discussion of the existence of similar features in other galaxies. Some of the consequences for the spiral pattern of our Galaxy are discussed in section 6. The conclusions and final remarks are presented in section 7.
2 The HI Data
Recently Kalberla et al. (2005) published the LAB111Leiden/Argentine/Bonn survey which contains the final data release of observations of 21-cm emission from Galactic neutral hydrogen over the entire sky, merging the Leiden/Dwingeloo Survey (LDS: Hartmann & Burton 1997) of the sky north of -30o with the Instituto Argentino de Radioastronomia Survey (IAR: Arnal et al. 2000 and Bajaja et al. 2005) of the sky south of -25o. The angular resolution of the combined material is HPBW 0.6o. One of the improvements of these new data with respect to previous surveys is the introduction of corrections for the stray radiation.
The LAB survey has been extensively used in several applications as pointed by Bajaja et al. (2005), Kalberla et al. (2005), Haud & Kalberla (2007), Kalberla & Haud (2006) among others. In the present paper, we have employed the HI data from the LAB survey. These data cover galactic longitudes from 0o to 360o and galactic latitudes from -90o to 90o; for both coordinates the interval is 0.5o and the velocity resolution 1 kms-1. The spectra are presented in units of antenna temperature versus velocity. The data are stored in 720 fits file maps at longitude intervals stepped by 0.5o.
3 Analyzis of the spectra and discussion of the existence of the gap
We analyzed the HI spectra of the whole galactic longitudes range in steps of 0.5o, with galactic latitudes in steps of one degree in the range , plus the additional latitudes . In each spectrum we detected the velocity of the deep minima which are present, simply by identifying the channel with the lowest value of antenna temperature. We previously smoothed the spectra by replacing the temperature in each channel by the average of 5 channels.
Figure 1 illustrates what we call a deep minimum. It shows the HI spectra for six directions, all at b=, except for the last frame. The vertical lines represent the detected location of the minima. For instance, the HI spectrum obtained at 240.0o, presents with a clear gap at 35 kms-1; this gap is so prominent that it seems to divide the spectrum in two independent regions. As a working definition, we considered that a ”gap” or a ”deep minimum” must be a minimum in the spectrum where the antenna temperature is lower than 15 K, but is comprised between regions of the spectrum with antenna temperatures at least 20 Kabove the minimum. In this way we only consider minima which are significant in terms of signal to noise ratio and which are not at the edges of the HI distribution, where the density becomes naturally low. We also took separately into consideration the ”not very deep” gaps, with minima in the range 15 to 30 K, but also with edges reaching at least 20 K higher than the minimum. In some cases there are more than one gap in a same spectrum. One example is the spectrum at 80.0o, which shows two minima that are not very deep.
Usually, for a given longitude, a gap can be seen at the same velocity in the spectra obtained at different latitudes, but it disappears at . But it also happens in a number of directions that the gap is not prominent at b = , but is easily seen at some other latitude b5.0o. For instance at longitude 340.0o, there is no deep minimum at , but an almost good minimum can be seen at (last frame of Figure 1). This one is not taken into account in our following statistics because it does not fulfill the condition of having emission higher that 20 above the minimum on both sides. And since we are willing to illustrate in Figure 1 not only the best cases, the minimum in the 280.0o frame at 70 km/s is a deep one, but the minimum which would give the best fit to the interpretation that we present in next sections is the one at 20 km/s. However, the minimum at 20 km/s is present at the same longitude but other latitudes, like and , so that it is taken into account. All the measurements that show a deep minimum or a ”not very deep” minimum as we defined them are considered in the following discussion.

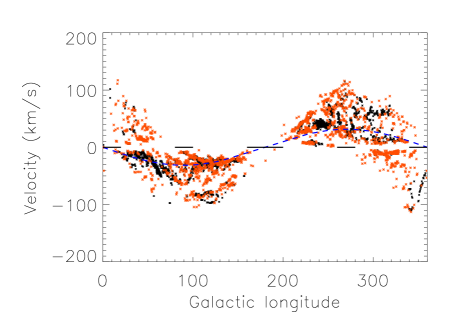
The result of the first step of analysis discussed above is a catalog of velocities of deep minima and of not very deep minima as a function of longitude. We present in Figure 2 the -v diagram of these minima. The dashed line represent the locus in the -v diagram of the points situated on a circle of radius 8.3 kpc around the Galactic center, in the Galactic plane, as discussed later in greater detail.
The line segments along the longitude axis at zero velocity represent the ”forbidden regions”, or ranges of longitudes where we should not see the effect of a ring-shaped gap in the HI distribution, even if it is physically present. For instance, in the directions 0o and 180o the gas which rotates with the Galactic disk is supposed to cross the line-sight at right angles, and therefore, to contribute only to a narrow region around v = 0 kms-1 in the spectra. The reason why the directions 90o and 270o are also partially forbidden is more subtle. This can be seen from one of the classical Oort formulae,
where is the radial velocity for an object situated at a distance in the direction , and is Oort´s constant. This expression is valid for distances from the Sun that are not too large (let us say, smaller than about 2 kpc). This expression tell us that the velocity is zero also for 90o and 270o. In other words, all the emission from the gas situated up to about 2 kpc contributes to a narrow velocity range in the spectrum, around v = 0 kms-1. Gas clouds situated at larger distances in those directions, however, contribute to non-zero velocities. If we exclude the ”forbidden” regions, about in the directions 0o and 180o and at 90o and 270o, and if we take into account the ”not very deep” minima, then we can see that the gap is present along the dashed line in about 90% of the permitted longitude range. In the next section we conclude that the ring-shaped gap has a radius about 8.3 kpc, which turns it more distant than 2 kpc in the directions 90o and 270o. We understand a posteriori why we can see the gap in those directions too.
The question that we next address is why the gap is not well seen in 100% of the ”permitted” longitude range (the whole longitude range excluding the directions close to 0oor 360o, and 180o). The minimum is not observed in a spectrum if there is a region along the line-of-sight containing gas with the same velocity of the gap. The velocity overlap is often only partial. We remark that when we are less rigorous in the definition of a gap, i.e., when we consider that the minimum can be larger than 15 K (the ”not very deep minima”) the longitude range covered is greater. For instance the gap is very clear at the velocity -18 kms-1, where it is expected, but the antenna temperature at the minimum is 20 K (the spectra of selected directions can be easily obtained from the site of the LAB Survey 222http://www.astro.uni-bonn.de/w̃ebaiub/english/tools_labsurvey.php). At there is still a minimum at v = -10 kms-1, but it is much less prominent, with 39 K at the bottom. Similarly, at there is a minimum at v = 20 kms-1, but the minimum is 39 K.
The more extended longitude range where the gap (as we defined it) is only weakly observed (but still present), although it is a ”permitted” range, is 200-220o. A possible explanation is the following. There is a spiral arm passing relatively close to the Sun (at about 2kpc in the direction of the anticenter; see eg. Russeil, 2003). Since the distance of the gap that we are investigating is about 1 kpc from the Sun towards the anticenter, the distance between the gap and the arm is of the order of 1 kpc. The slope of the curve of radial velocity as a function of distance along the line-of sight, for (in the middle of the longitude range that we are considering) tells us that a distance interval of of 1 kpc produces a difference of velocity of the order of 10 kms-1. On the other hand, the peaks seen in the spectra at any longitude never have width smaller than about 10 kms-1. This is a minimum width of the HI emission associated with spiral arms, attributed to the turbulent motion of the gas. Therefore, it is not surprising that the minima in the spectra which are associated with the ring-like density gap are partially filled with emission which originates in a nearby region along the line-of-sight.
3.1 Detailed description of the gap
The kinematic distance of the gap from the Sun can be easily estimated, as there is no distance ambiguity, since the gap is situated outside the solar circle, where there is only one kinematic solution. Furthermore, the distance obtained depends very little on the adopted rotation curve, since the gap is close to the solar circle. It must be remembered that if the gap were coincident with the solar circle, its velocity as seen from the LSR would be zero at all longitudes independently of the rotation curve.
In the present work, we used a relatively flat rotation curve, conveniently fitted by exponentials and and a Gaussian (units are km-1 and kpc):
The curve is presented in Figure 3, where the points represent the CO data obtained by Clemens (1985) corrected for = 7.5 kpc and = 210 kms-1. This curve is close to that derived by Fich, Blitz & Stark (1989) and the fitted expression is similar to one previously used by our group (eg Lépine et al. 2008)

The distribution of the density minima in the galactic plane, derived from their kinematic distances from the Sun, is shown in Figure 4. The minima observed at different latitudes are all projected on the galactic plane. The ring-shaped gap is circular and very clear. It looks like the Cassini division in Saturn´s rings. Although minor changes in the galactic radii of the gaps appear in experiments with different rotation curves, the ring-shaped aspect of their galactic distribution remains unchanged. The histogram of the galactic radii is shown in Figure 5. Most of the other structures not belonging to the ring have the shape of spiral arms and can be understood as inter-arm gaps. The prominent one at about 11 kpc to the left of the center in the figure seems to be on the external side of the Carina-Sagittarius arm. Taking into account the different galactic scales adopted in the two works, it coincides with an inter-arm region previously observed by Levine et al.(2006) at 13 kpc to the left of the center. Figure 4 tells us that the ring-shaped gap cannot be explained as a combination of inter-arm gaps, nor it is a local structure only seen close to the Sun.
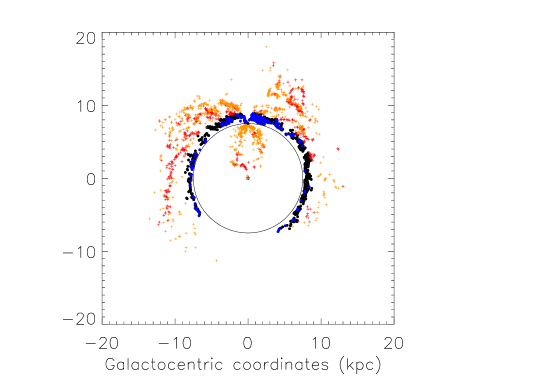

It does not seem probable that the traditional approximation of circular orbits adopted in calculations of kinematic distances, instead of orbits that take into account the influence of the galactic bar, can have any strong effect on the shape of the ring. The part of the galactic plane which is of interest in the present study is situated outside the solar circle. For instance, in the study of the kinematic response of the outer stellar disk to a central bar, Mühlbauer and Dehnen (2003) predicts that the bar-induced radial and azimuthal motion of the LSR should be very small (at most a few kms-1).
We estimated the average width of the gap by measuring the velocities of each edge of the deep minima in the spectra. The profiles of the minima often departs from Gaussian fits, since there are flat minima. Instead, we just added 20 K to the antenna temperature of the lowest point, and looked where this threshold line intersects the edges of the line profile. The exact value of the threshold is not important since the edges are usually sharp. The two velocities obtained in this way were transformed into distances from the Sun using the kinematic distance method. The line segment defined by the two distances was then projected onto the local radial direction.
We found an average width of 0.8 kpc, with values in the range of 0.5 to 1.3 kpc.
The HI density in the gap can be roughly estimated with the classical expression connecting the column density NH with the product of antenna temperature T and velocity interval V (e.g. Vershuur, 1974): NH= 1.821018 T V. (NH in units of cm-2 with T in units of K and V in kms-1). Selecting a number of cases for which T is smaller than 5 K over an interval of velocity of 20 kms-1, with corresponding length along the line-of-sight of about 1 kpc, the resulting density is quite low, of the order of 0.05 cm-3. The average density in regions close to the ring-like gap, in a smoothed distribution that does not consider the gap, is about 0.3 cm-3 (eg. Amôres & Lépine, 2005), which means a factor 6 in density contrast between the gap and the surrounding regions.
4 The gap seen with other tracers
Although the hydrodynamical forces that produce a gas flow that diverges from the corotation radius do not act on stars, it is expected that the low gas density in the gap inhibits star formation, and a lower density of young stars should be observed. This is indeed the case, as can be seen from the histograms of galactocentric distances of open clusters and of Cepheids shown in Figure 6. The Open Clusters were taken from the New Catalogue of Optically visible Open Clusters and Candidates of Dias et al. (2002) 333Available at the web page http://astro.iag.usp.br/~wilton. We selected from this catalog the clusters which have known distances, in the range of age of 2 to 40 Myr. The Cepheids were taken from the catalog of Berdnikov et al.(2003); the complete sample of 440 stars was used. It should be noted that the two types of objects have their distances estimated by different methods (main-sequence fitting and period-luminosity relation), and different from the kinematic distance method used for HI, so that they can be considered as independent measurements of the gap radius.

In principle, the completeness of any sample of stars decreases with the distance from the Sun, since distant stars are more difficult to observe. For instance, the sample of visible Mira variables is uniformly distributed around . This happens because as the distance increases in the inward and outward directions, other effects like the larger extinction towards the galactic center and the exponential decrease of the stellar density with galactic radius in the disk are only smooth effects. The comparison of the histograms with symmetric curves centered on the position of the Sun allows us to see an abrupt decrease of the density from 7.5 to 8.0 kpc. We believe that the star formation rate is almost zero in the gap. The stars and open clusters which are formed just outside the gap have have typical perturbation velocities of about 10 kms-1 with respect to the local rotation curve, when they start their epicyclic motion around the circular orbit (see Lépine et al. 2008 for a detailed description of this process). As a consequence, they fill partially the gap in about 70 Myr, half the epicycle period. It should be noted that the Cepheids have typical ages larger than this. It is therefore not surprising that the gap is not seen more prominent using these two tracers. For older stars the gap is completely smoothed out, since the corotation resonance scatters the stellar orbits (Lépine et al., 2003). Of course, one could interpret the histograms of Figure 6 as showing a peak at about 7 kpc, instead of a density decrease around 8 kpc. But at least, the above discussion shows that there is no conflict between the hydrogen density gap and the distribution of young stellar tracers.
Concerning other young tracers, it is well known that H II regions, as well as molecular clouds observed in CO, are strongly concentrated in the spiral arms. One difficulty is that to see clearly the ring-shaped gap we need to observe minima along a large fraction of the gap-ring, and this is not possible for objects which are restricted to the spiral arms. Another problem is how to distinguish an inter-arm region from the ring-shaped gap. Paladini et al. (2004), present an histogram of galactocentric distances of HII regions, in their Figure 3. The histogram shows a minimum at about 8.5 kpc, but this is due to a selection effect, since the authors removed from their sample all the objects situated along the solar circle (velocities with modulus less than 10 km-1). A re-analysis of the distribution of HII regions in the Galaxy is beyond the scope of the present work.
5 Ring-shaped gaps in other galaxies
Are HI ring-shaped gaps seen in other galaxies as well? In the literature the emphasis is more often given to ring-shaped HI emission. There are emission rings which are obviously produced by the interaction of colliding galaxies since they present large angles with respect to the plane of the host galaxy. However, there are also many external rings situated in the plane of the galactic disks. In those cases, what looks like an external ring could be a consequence of the existence of a gap that separates the ring from the main HI distribution. A very rough statistical analysis can be made for instance using the unbiased HI and optical study of 16 nearby northern spiral galaxies by Wevers et al. (1986), since the radial profiles of HI are given in that work. In many cases (NGC2903, NGC3726, NGC4203, NGC4258, NGC4725, NGC5055) the HI density profile presents a minimum which separates a faint outer ring. This is an indication that ring-shaped HI gaps are not rare.
The question of the connection between a gap and corotation is more difficult to investigate, since the corotation radius has been determined only for a limited number of galaxies, and there are often conflicting determinations based on different methods. For two of the galaxies of the list given above, there is a corotation radius estimated by Vila-Costa & Edmunds (1992). One is NGC2903, with Rc= 2.3 arcmin while the gap, as shown by Wevers et al. is wide and begins at about 2.8 arcmin (but using a beamwidth smoothing of 0.5 arcmin). The other is NGC5055, with Rc=3.1 arcmin, while the gap only starts at about 6.6 arcmin. In this case the corotation seems to be excluded as the cause of the gap. As examples of the gap-corotation association, Schommer & Sullivan (1976) states that this is clearly the case in NGC4736. In the study of the molecular gas distribution over M83 by Lundgren et al. (2004) we can see a ring where the gas is depleted very near the corotation circle outside the inner arms (see eg. their Figures 5 and 14), although the authors do not mention this feature.
6 Consequences for the spiral structure of the Galaxy
The existence of a ”vacuum” ring is certainly able to constrain the models of spiral arms of the Galaxy. We argued in the introduction that there is a convergence of the direct methods of determining the corotation radius, telling us that corotation is close to the solar orbit. The mean radius of the ring is 8.3 kpc, which coincides with the corotation radius obtained by DL, and is within the errors of measurements of several other papers based on direct observations. On the other hand, it is a prediction from both the classical spiral wave theory and numerical hydrodynamic simulations that the spiral arms produce a vacuum around corotation. In this sense, the observation of the vacuum ring can be considered as an independent measurement of . The idea of the coexisting multiple pattern speed has been suggested by several authors (eg. Rautiainen & Salo, H.,1999, Minchev & Quillen, 2006). These authors conclude that this is a possibility in real galaxies, but do not declare that this happens in our Galaxy. The fact that we observe only one ring-like gap, and that this gap is a well defined one, is an argument against the hypothesis of multiple pattern speed in the Galaxy, which would produce multiple ring-like gaps or not well defined rings. It should be remembered that the self-consistent model of spiral structure proposed by AL (1997), which seems to present multiple structures, is based on the hypothesis of a single pattern speed. The result of AL were confirmed by Martos et al.(2004), with the same hypotheses and same conclusions. We avoid in the present work the discussion of the pattern speed of the bar, which might affect the internal regions of the Galaxy. There are arguments in favour of a different pattern speed for the bar (eg. Dehnen, 1999), but there is no direct measurement of it, so that we should not yet abandon completely the hypothesis that the extremities of the bar are connected to the arms and both have the same rotation velocity.
Moving now to the question of the lifetime of the spiral pattern, what does the ring-like gap tells us about it? In contrast with the classical theory of spiral arms, according to Sellwood & Binney (2002), and Merrifield et al. (2006), among others, transient waves with a wide range of pattern speeds develop in rapid succession. If the gap has an average width of about 800 pc and the gas flow just outside the gap has typical velocity of the order of 0.5-1 km/s (Lacey & Fall, 1984, Mishurov et al., 2002, hereafter MLA), supposing that the gap was filled with the same density of the neighbouring regions at the initial instant, then it would have taken about 0.8 Gyr to pump out the gas to form the gap. This relatively short time would be the minimum age of the present spiral structure. This is not a strong restriction; the restrictions based on the metallicity gradient in the disk seem to be able to impose longer lifetimes. MLA adopted the idea that the star formation rate in the disk is proportional to , which is the velocity of the gas with respect to the spiral arms, or the rate at which the star-forming machine (the arms) is fed with gas. This function presents a minimum at corotation, and is able to explain positive slopes of metallicity beyond corotation. This interpretation can be combined with the results of Maciel et al. (2003) which show that the planetary nebulae younger than 4 Gyr have a metallicity slope beyond corotation which is flat or even positive, and very different from that of the older PNs. This suggests that the present position of corotation was established about 3-4 Gyrs ago, and that this is the age of the present spiral pattern.
7 Conclusions
There is strong evidence in favor of the existence of a ring-like gap in the distribution of HI in the galactic disk, similar in appearance to the Cassini division in Saturn’s rings. Although the existence of the gap was known from the very first HI surveys, a detailed description of it was not available up to now. The mean radius is 8.3 kpc, for = 7.5 kpc, and its mean width at half minimum of the order of 0.8 kpc. The radius of the ring coincides with the corotation radius of the Galactic disk. It is a prediction from both the spiral wave theory and numerical hydrodynamic simulations that the spiral arms produce a vacuum around corotation. The radius and width of the ring-shaped gap coincide precisely with the results of numerical hydrodynamic simulations performed by our group (Lépine et al., 2001) for the same value of R0. The present result is therefore a confirmation of our correct understanding of the spiral density waves mechanism. It tends to favour the classical idea of a single pattern speed, since the ring-like gap is unique and reveals a single corotation radius. It also favours a relatively stable or long-lived spiral pattern, since in our interpretation, the pattern must survive a time long enough to pump out the gas from the gap. Approximate estimates show that the HI density in the gap is about 6 times less than the mean density in the medium surrounding the gap. Certainly this gap will have to be taken into account in models of chemical evolution of the disk.
8 Acknowledgements
Eduardo Amôres obtained financial support for this work provided by FAPERJ (Fundação Carlos Chagas Filho de Amparo à Pesquisa do Estado do Rio de Janeiro, E-26/100.457/2008), CNPq (Conselho Nacional para o Desenvolvimento Científico e Tecnológico 150772/2008-4) and Fundação para a Ciência e Tecnologia (FCT) under the grant SFRH/BPD/42239/2007. We also thank the referee for the helpful comments.
References
- (1) Amaral, L. H. & Lépine, J. R. D., 1997, MNRAS 286, 885 (AL)
- (2) Amôres, E.B. & Lépine, J.R.D., 2005, AJ 130, 659
- (3) Andrievsky, S. M., Luck, R. E., Martin, P., Lépine, J. R. D., 2004, A&A, 413, 159
- (4) Arnal, E. M., Bajaja, E., Larrarte, J. J., Morras, R., P ppel, W. G. L., 2005, A&A Suppl Series, 142, 35
- (5) Avedisova, V.S., 1989, Astrophysics (Tr. Astrofizika)30, 83
- (6) Bajaja, E., Arnal, E. M., Larrarte, J. J., Morras, R., P ppel, W. G. L., Kalberla, P. M. W., 2005, A&A, 440, 767
- (7) Bissantz, N., Englmaier, P., Ortwin, G., 2003, MNRAS, 340, 949
- (8) Berdnikov, L.N., Rastorguev, A.S., Dambis, A.K., Glushkova, E.V., ”A catalogue of data on Galactic Cepheids”, 2003, available at http://www.sai.msu.su/groups/cluster/CEP/RADVEL/
- (9) Burton, W. B., Gordon, M. A, 1978, A&A, 63, 7
- (10) Canzian, B., 1998, ApJ, 502, 582
- (11) Chakrabarty, D., 2007, MNRAS, 377, 30
- (12) Clemens, D. P., Sanders, 1985 ApJ 295, 422
- (13) Crézé, M., Mennessier, M. O., 1973, A&A, 27, 281
- (14) Dehnen, W., 1999, ApJ 524, L35
- (15) Dias, W., Lépine, 2005, ApJ, 830, 825 (DL)
- (16) Dias, W. S., Alessi, B. S., Moitinho, A., Lépine, J.R.D., 2002, A&A 389, 871
- (17) Fernández, D., Figueras, F., Torra, J., 2001, A&A, 372, 833
- (18) Fich, M.,Blitz, L.,Stark, A. A., 1989, ApJ, 342,
- (19) Hartmann D., Burton W.B., 1997, Atlas of Galactic Neutral Hydrogen, Cambridge University Press
- (20) Haud, U., Kalberla, P. M. W., 2007, A&A, 466, 555
- (21) Humphreys, R. M., Kerr, F. J., 1974, ApJ, 194, 301
- (22) Kalberla P.M.W., Burton W.B., Hartmann D., Arnal E.M., Bajaja E., Morras R., Poeppel W.G.L., 2005, A&A, 440, 775
- (23) Kalberla, P. M. W., Haud, U., 2006, A&A, 455, 481
- (24) Kerr, F. J., 1969a, ARA&A 7, 163
- (25) Lacey, C. G., Fall, S. M., 1985, ApJ, 290, 154
- (26) Lépine, J. R. D., Leroy, P., 2000, MNRAS, 313, 263
- (27) Lépine, J. R. D., Mishurov ,Yu. & Dedikov, Y. 2001, ApJ, 546, 234
- (28) Lépine, J. R. D., Acharova, I. A., Mishurov, Yu., 2003, ApJ, 589, 210
- (29) Lépine, J. R. D., Dias, W.S., Mishurov, Yu., 2008, MNRAS, 386, 2081
- (30) Levine, E.S., Blitz, L., Heiles, C., 2006, Science 312, 1773
- (31) Lundgren, A. A., Olofsson, H., Wiklind, T., Rydbeck, G., 2004, A&A 422, 865
- (32) Maciel, W. J., Costa, R. D. D., and Uchida, M. M. M, 2003, A&A, 397, 667
- (33) Marochnik, L. S., Mishurov, Yu. N., Suchkov, A. A., 1972, Ap&SS, 19, 285
- (34) Martos,M., Martos, X., Hernandez, M., Yanez, E., Moreno and Pichardo, B., 2004, MNRAS 350, L47
- (35) Minchev, I., Quillen, A. C., 2006, MNRAS 368, 623
- (36) Minchev, I., Quillen, A. C., 2008, MNRAS,386, 1579
- (37) Mishurov, Yu. N., 2007, 51, 215
- (38) Mishurov, Yu. N., Lépine, J. R. D., I. A. Acharova, 2002, ApJ 571, L113
- (39) Mishurov ,Yu.N., Zenina, I. A., 1999a, A&A, 341, 81
- (40) Mishurov, Yu.N., Zenina, I. A., 1999b, Astronomy Reports, 43, 487
- (41) Merrifield, M. R., Rand, R. J., Meidt, S. E., 2006, MNRAS 366, L17
- (42) Muhlbauer , W. Dehnen (2003)
- (43) Naoz, S., Shaviv, Nir J., 2007, New Astronomy, 12, 410 (NS)
- (44) Paladini, R., Davies, R. D., DeZotti, G., 2004, MNRAS, 347, 237
- (45) Rautiainen, P., Salo, H., 1999, A&A 348,737
- (46) Rodriguez-Fernandez, N. J., Combes, F., 2008, A&A, 489, 115
- (47) Russeil, D., 2003, A&A 397, 133
- (48) Sellwood, J. A.; Binney, J. J., 2002, MNRAS 336, 785
- (49) Schommer, R. A.; Sullivan, W. T., III, 1976, Astrophys. Letters, vol. 17, no. 4, 191
- (50) Twarog, B.a, Ashman,K.Mm, Anthony-Twarog, B.J, 1997, AJ 114, 2556
- (51) Torra, J., Fernández, D., Figueras, F., 2000, A&A, 359, 82
- (52) Vila-Costas, M. B.; Edmunds, M. G., 1992, MNRAS 259, 121
- (53) Wevers, B.M.H.R., van der Kruit, P.C., Allen, R.J., 1986, A & A Suppl. Ser. 66,505