Footprints of the (Nearly) Perfect Liquid
Abstract
In relativistic heavy-ion collisions, the system has gone through a series of evolution, almost at every stage of its evolution it leaves behind footprints in flow observable. Those footprints contain valuable information of the bulk property of the (nearly) perfect liquid. By examing footprints of the nearly perfect liquid, we address a few important issues, including the ideal hydrodynamic limit, estimation of , testing the Number of Constituent Quark scaling at low energy, in small system, at large transverse momentum, and in forward region. Future prospect of flow study is discussed.
1 Introduction: the (nearly) perfect liquid
As a unique tool to study the QCD matter under extreme conditions, RHIC has been successful in operations since year 2000. The wealth of data, collected and analyzed in many aspects, indicates that central Au+Au collisions can be well described by ideal Hydrodynamics [1]. Indications of liquid-like behavior of the matter that RHIC has created came in the form of large elliptic flow. What is more interesting is that, this liquid has little viscosity and acts like a perfect one [2]. Those findings lead to the announcement of the discovery of the existence of a perfect liquid [3].
In following sections, we address a few important questions which are directly related to the understanding of the property of the (nearly) perfect liquid.
2 Is hydrodynamic limit saturated?
The search for fluid-type signature started 30 years ago at BEVALC. Till 2000, when RHIC started operation, data becomes close to hydrodynamic predictions. This can be seen by plotting scaled by the initial eccentricity as a function of , data points reach hydro limit in most central collisions [4]. However, as our understanding advances, it is realized that when calculating the hydrodynamic limit, there is ambiguity in the choice of initial condition [5], uncertainties in the Equation of State (EoS) [6], and hadronic dissipative effects are also not negligible [7]. Thus it is important to revisit the issue.
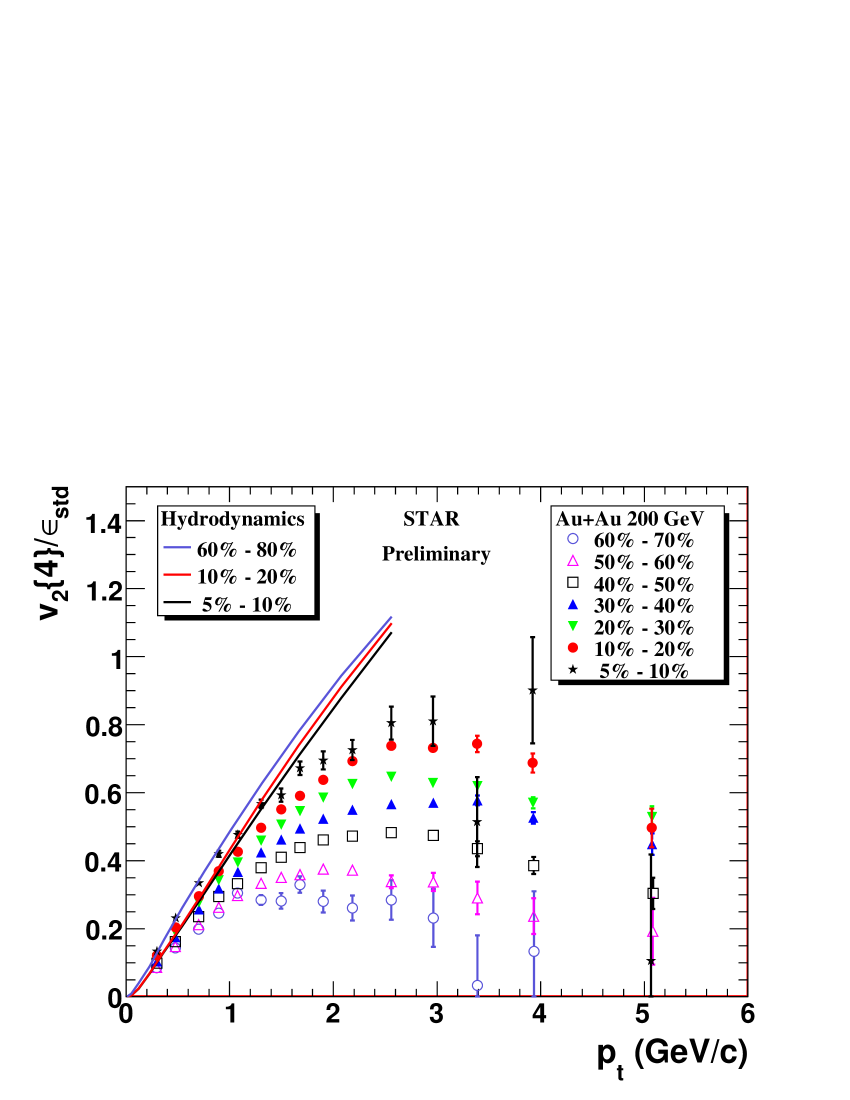
In Figure 1, , scaled by the standard eccentricity , is plotted as a function of transvers momentum () for difference centralities. We see that increases with centrality, due to the increase of . For at a fixed , one finds that keeps increasing until it saturates at the bound set by hydrodynamics. This explains the saturation of integrated in [8], without the need for a softness in the EoS. 111 As a related remark, Heinz and Kestin pointed out at this meeting that the non-monotonic feature of at a fixed , as shown in [10], is related to the interplay between radial flow and freeze-out. It can not be associated unambiguously with a phase transition in the EoS. .
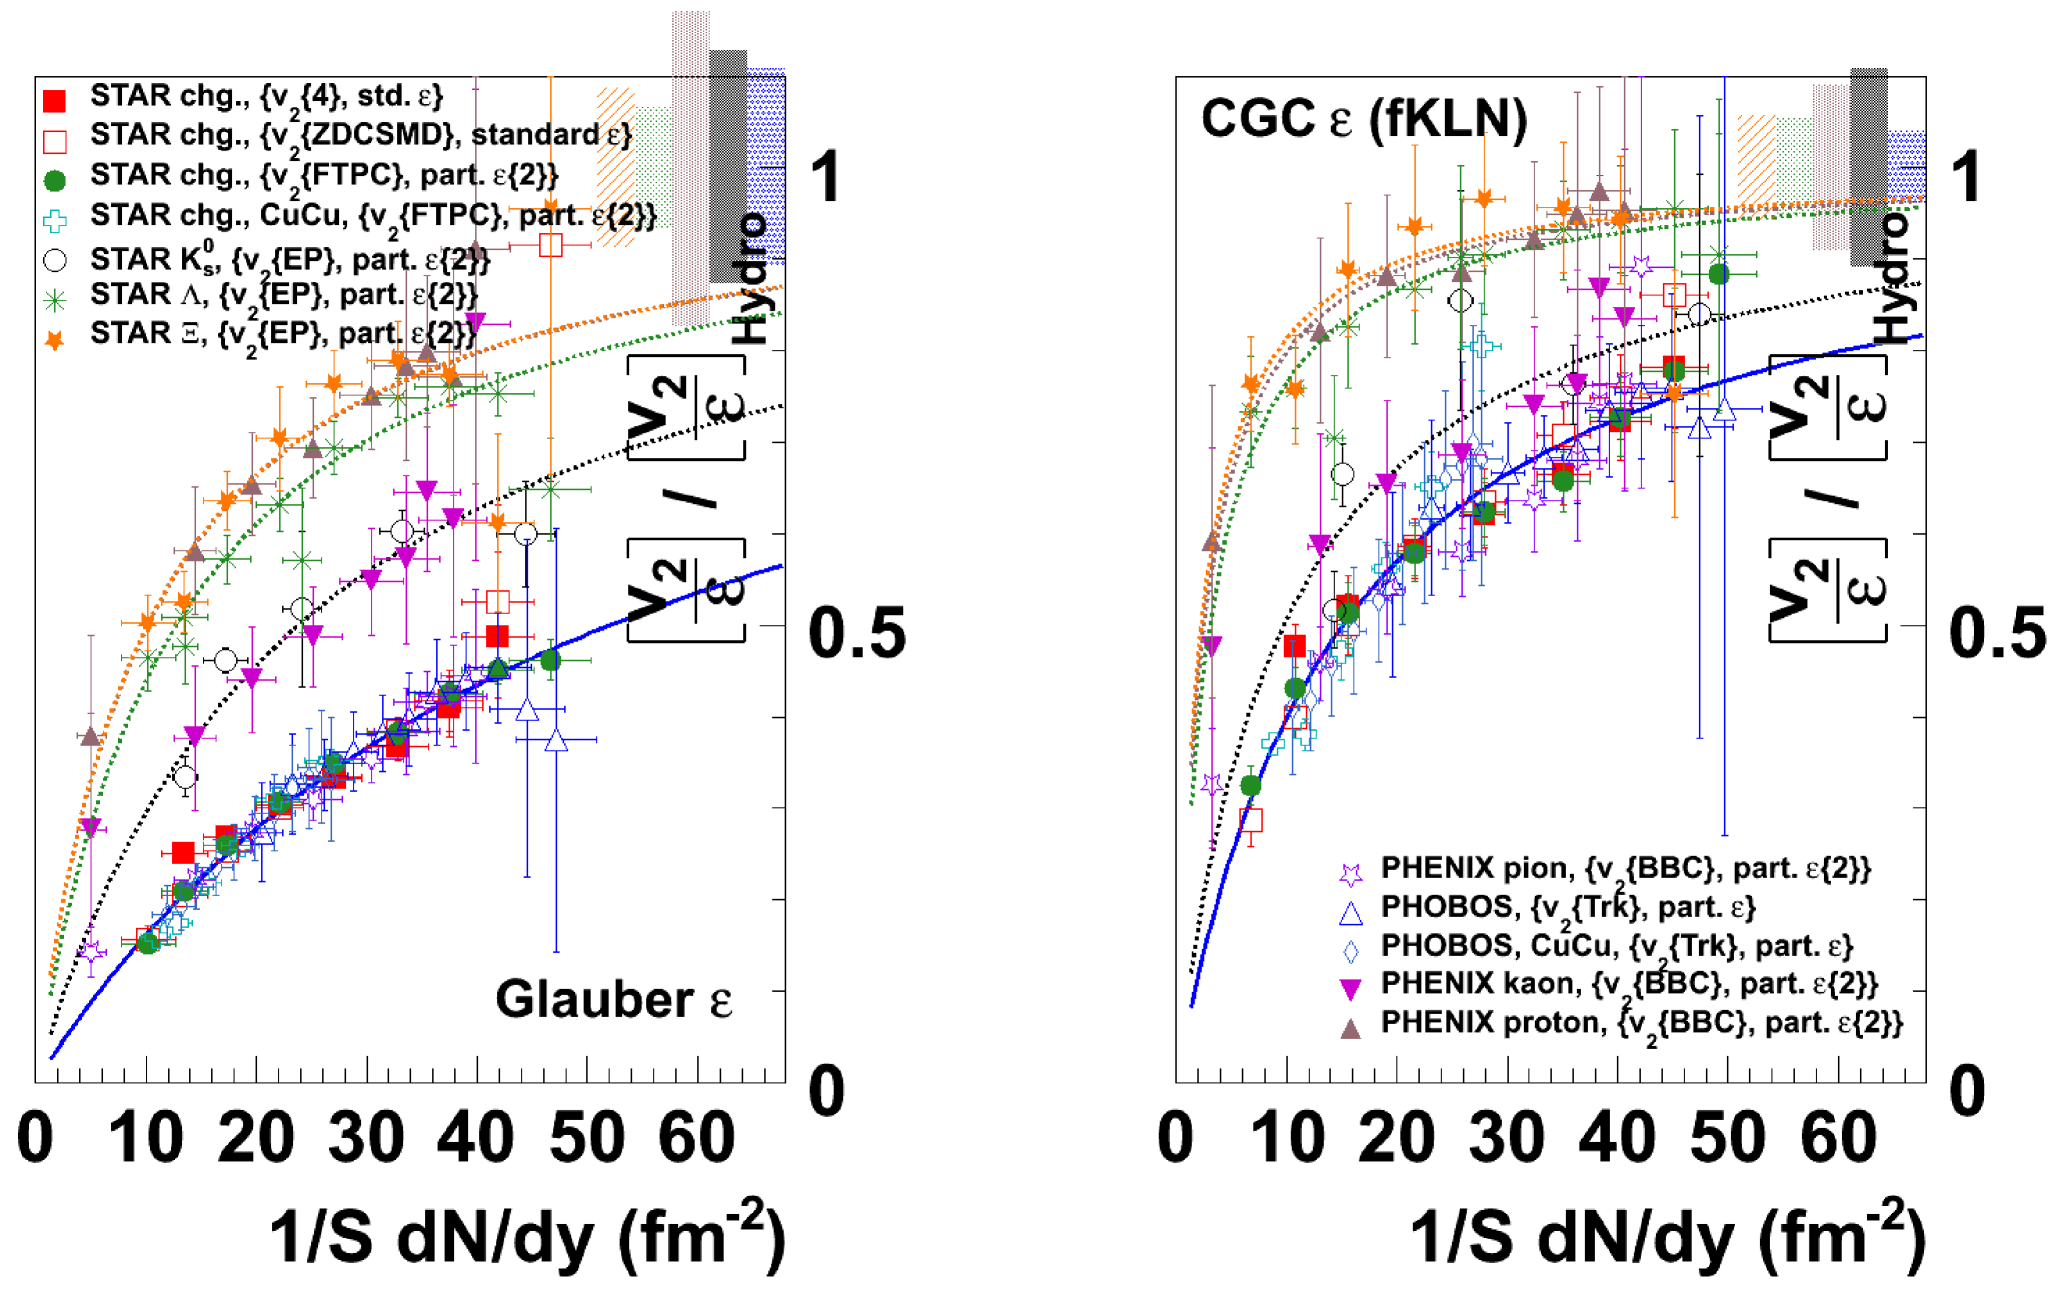
For the integrated , to quantify the possible discrepancy between data and ideal hydrodynamics, one can either match the data using hydrodynamic models which incorporate viscous corrections [6, 11], or fit the data with a formula motivated by transport models [12, 13, 14]. Figure 2 shows scaled by its corresponding limit at which they saturates (hydro limit). The hydro limit is obtained from fitting with the transported model motivated formula , where K is the Knudsen number defined by the mean free path scaled by the system size , and is obtained from transport calculations. This formula has the desired feature of describing the system at two extremes; when is small, the deviation to the saturation value (hydro limit) is proportional to K, which corresponds to first order correction of viscosity, and when K is large, proportional to 1/K, which corresponds to low density limit. A mass hierarchy is observed, the heavier the particle, the more saturation is seen. For charged particles, we see that the system is still 30-50% away from ideal hydro dynamics, depending on initial conditions.
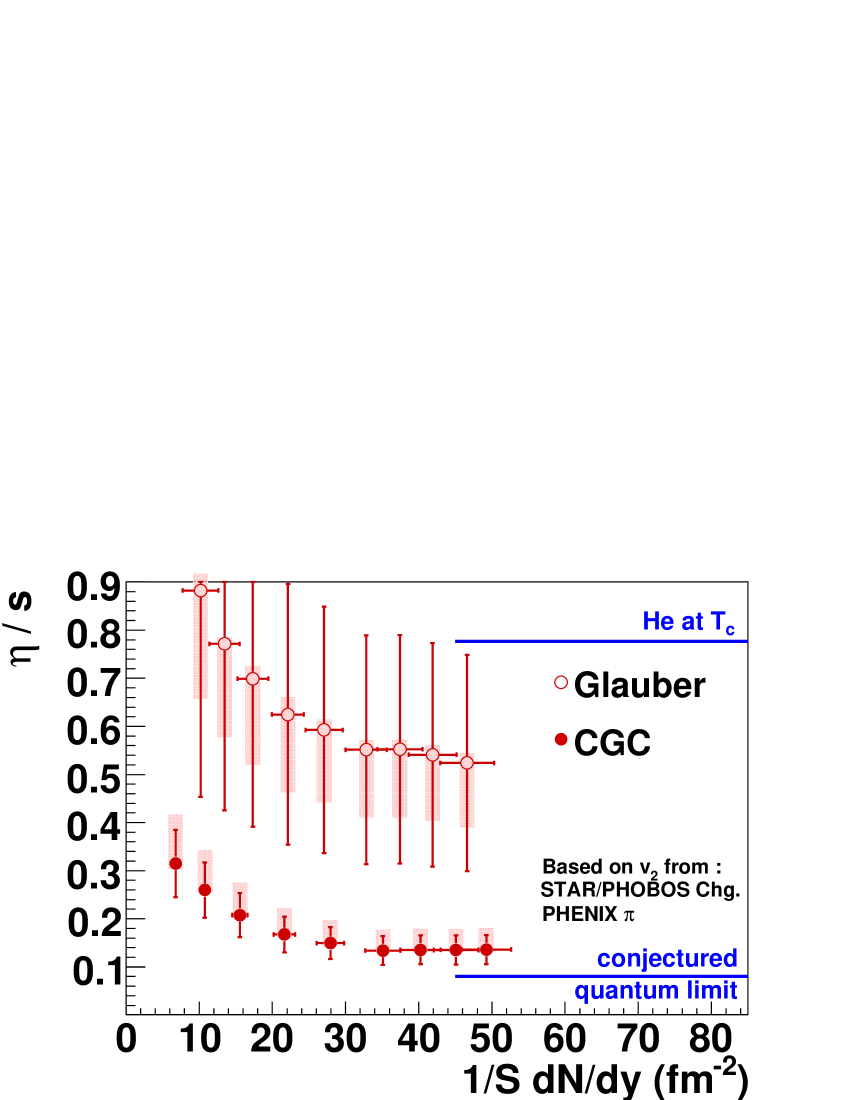
The Knudsen number obtained from this procedure can be used to calculate . Following [15], the viscosity for a classical gas of massless particles with isotropic differential cross sections is [16]. It is arguable to apply the formula to strongly interacting dense matter, however, in practice the viscosity recovered from this procedure agrees well with that obtained from viscous hydro calculations [14]. Taking the entropy density for a classical ultra-relativistic gas as , with the particle density, then can be calculated as . The temperature T is obtained from fitting STAR’s pion slope [17]. In Figure 3, is plotted as a function of for Glauber and CGC initial conditions. For both is lower than that for He at . for CGC initial condition is smaller than that for Glauber initial condition, because with CGC initial condition, a stronger saturation is seen in the shape of vs. , which gives a smaller K for same . This does not necessarily contradict to the conclusion arrived from viscous hydro calculations [6, 11], in which the Equation of State is chosen to be the same for the two initial conditions.
3 What is the perfection ?
The presented in previous section is an effective quantity which includes viscous effects over different phases. It is desirable to extract in QGP fluid phase, however, all “signatures”, spectra, flow, fluctuations, involve some time average over the history of plasma. One has to rely on models to infer the from QGP phase. It thus becomes important to understand the relative contribution from phases other than the QGP fluid phase. Theoretical work [18, 19] indicate that above , the increases with T, and below , decreases with it (Fig. 5). The divergence

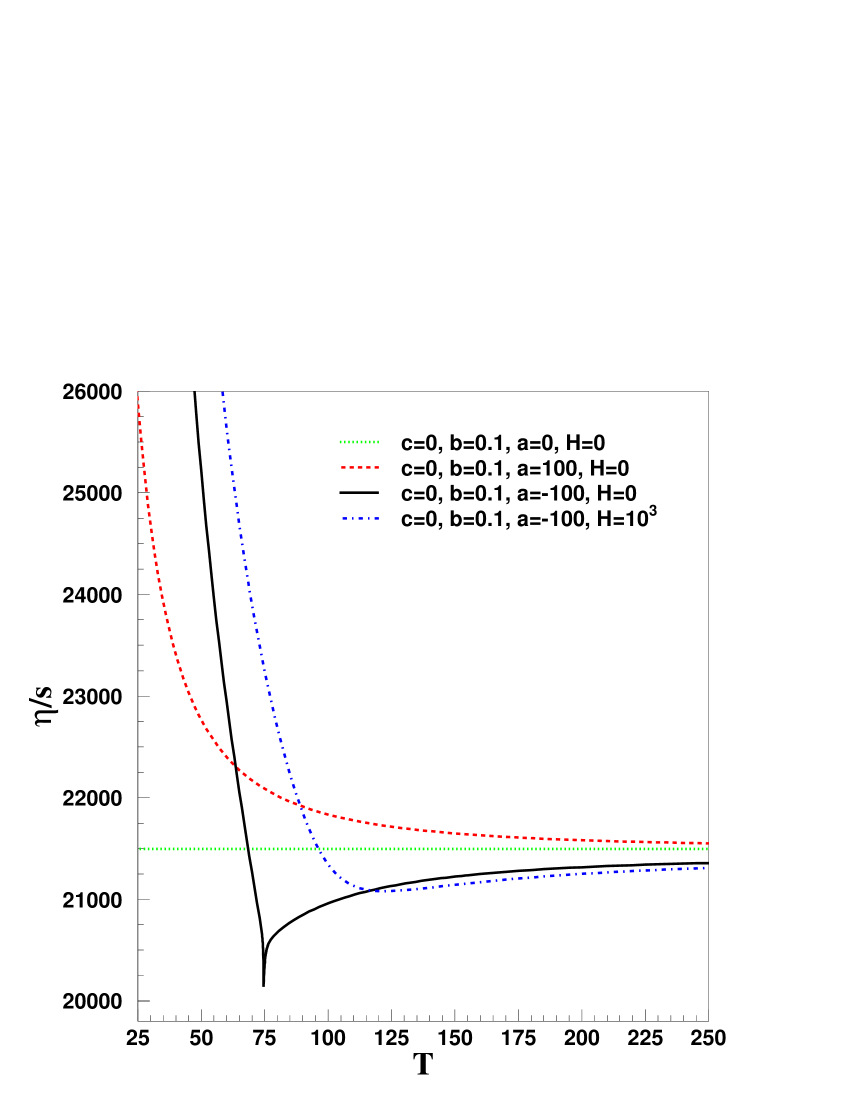
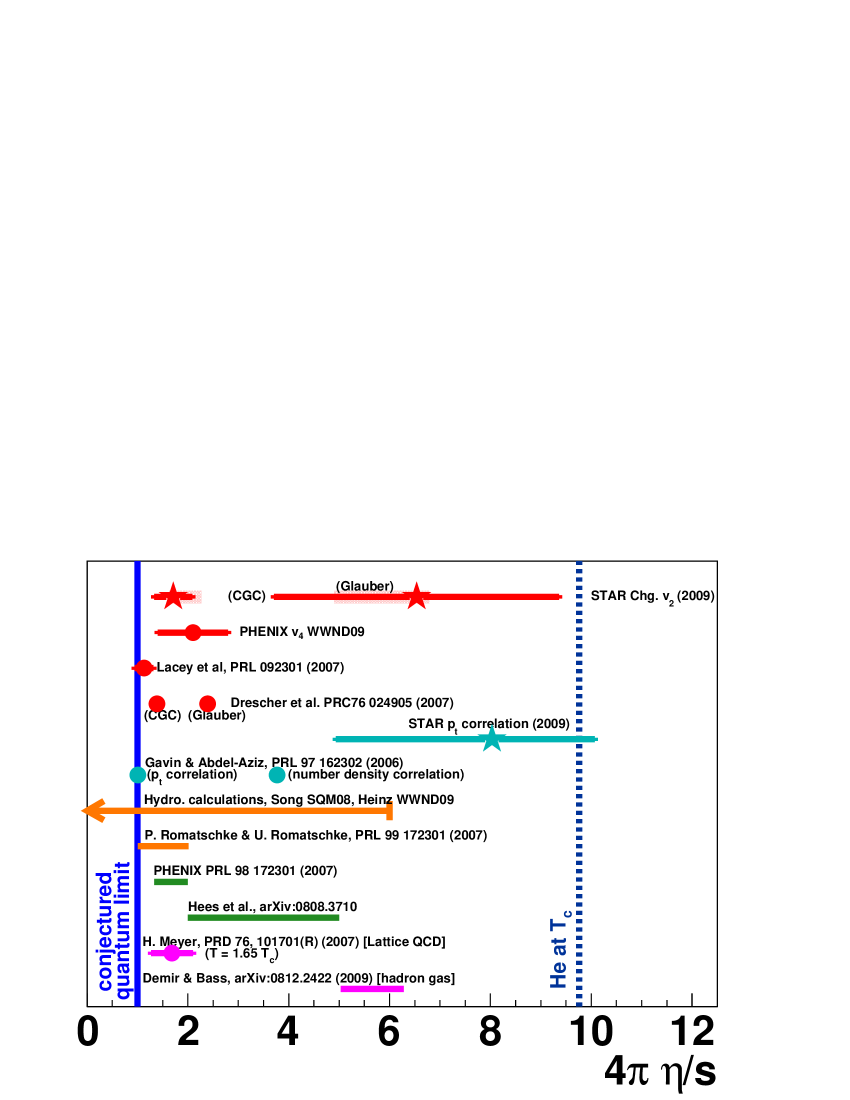
happens at and one can infer a minimum of near it. Note that if the system spends even a short period of time in the hadronic phase it may catch considerable amount of viscous effect. Indeed it is calculated [20] that the for hadronic gas is 0.4-0.5, a few times of the conjectured quantum limit. Nevertheless, if one collects calculations on the market (Fig. 4), although the result spread in a wide range from 0 to 10 times of the conjectured quantum limit, which reflects the current uncertainty in the calculation of , most of the calculated is below that of He at .
4 What is the ultimate say on partonic collectivity ?
and have been suggested as an ideal probe for partonic collectivity, because they have small hadronic cross section thus carry information from the early, partonic stage. The large statistics accumulated during RHIC run VII makes it possible to measure for and with unprecedented accuracy. In the right panel of Figure 6, it is found that and has sizable and they
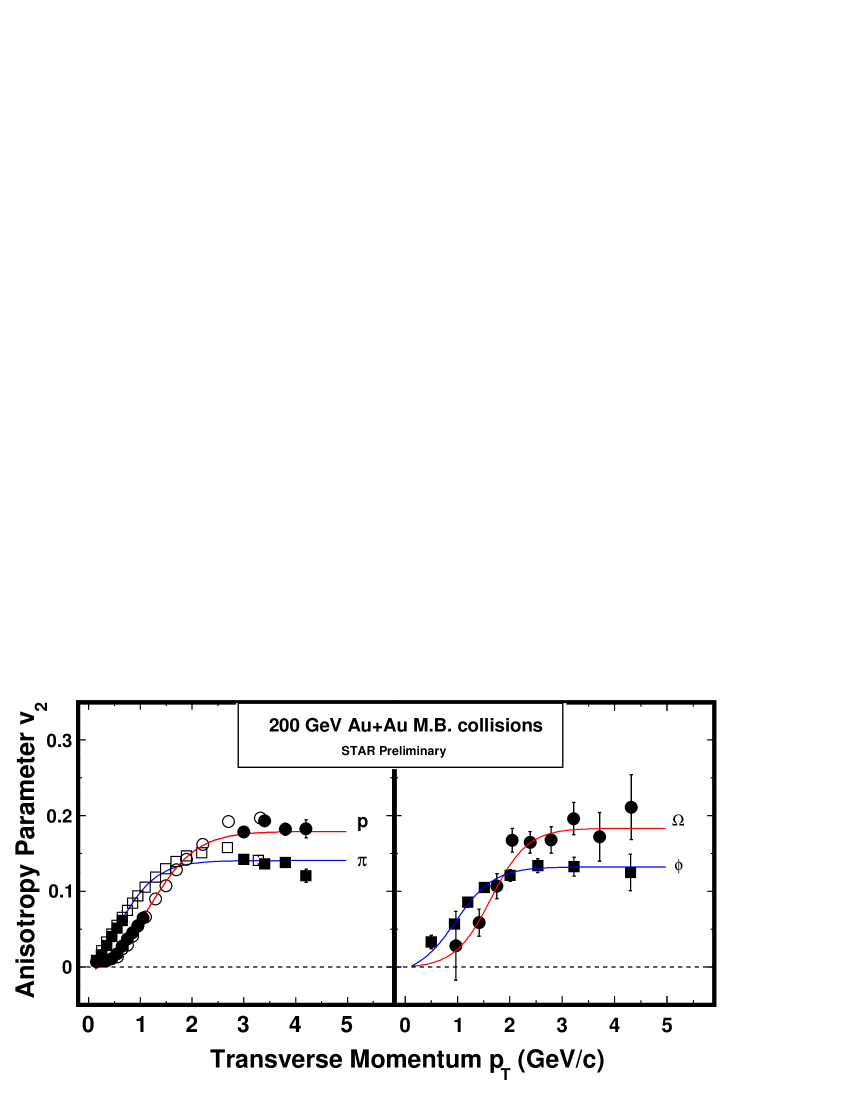
still follow Number of Constituent Quark (NCQ) scaling, just like light hadrons (shown in the left panel for comparison). This is the definite proof that partonic collectivity has been reached at RHIC.
5 What is the limit of Number of Constituent Quark scaling ?
The flow pattern of baryons and mesons can be explained well by the Number of Quark scaling [24], which is viewed as an evidence for the existence partonic degree of freedom. One does not expect the partonic phase to exist when the system is small and/or when the energy of the system is low, thus as a consequence, the NCQ scaling is expected to break down eventually. As a controlled reference, it would be interesting to find out the condition under which the NCQ scaling breaks down.
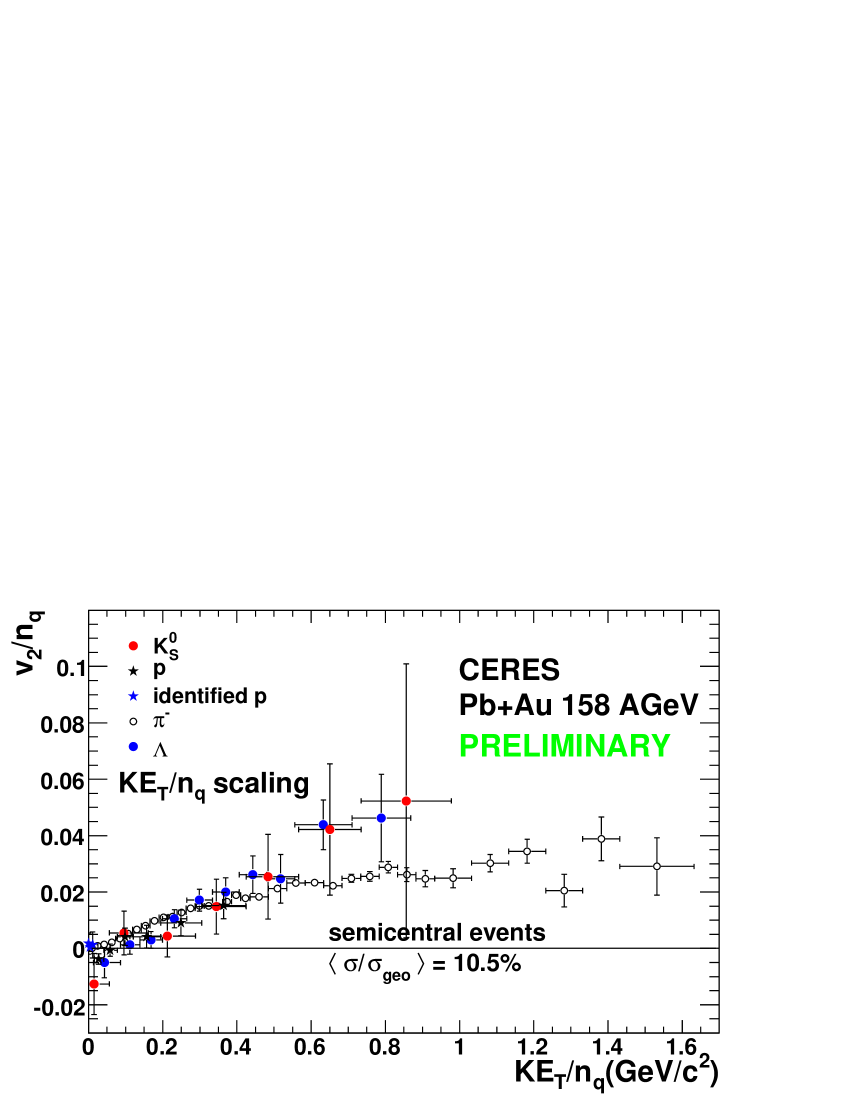
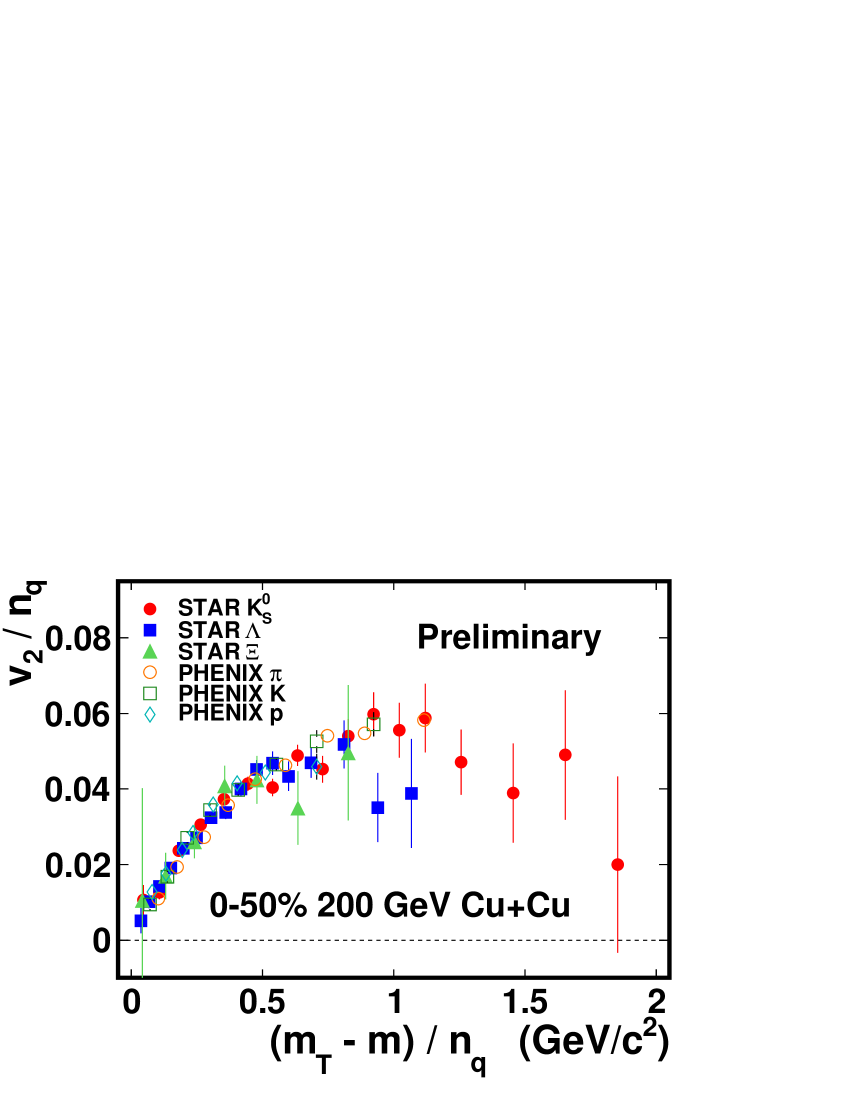
In the left panel of Figure 7, of identified particles are scaled by their constituent quarks and plotted as a function of , for Pb+Au collisions at 158 AGeV. We see that within errors, the result is still consistent with NCQ scaling up to . In the right panel, a similar plot is shown for Cu+Cu collisions at 200 GeV, for identified particles fall in a common trend well. No sign shows that NCQ breaks at these two conditions. NCQ is also studied at forward region in [26], within error there is no sign of breakdown.
Besides the partonic degree of freedom, NCQ scaling also implies that particles at intermediate are produced by quark coalescence. At large as hard process begins to kick in and particles are no longer produced by quark coalescence, thus the NCQ scaling is expected to break down. It is important to locate the range where the NCQ scaling breaks down, as it tells us the region of transition of particle production mechanism. It is as well important to examine the pattern with which the NCQ scaling breaks down for various hadrons. Such pattern will not only shed a light on the dynamics of jet fragmentation, it will also, being served as a counter example of NCQ scaling, deepen our understanding of quark coalescence.
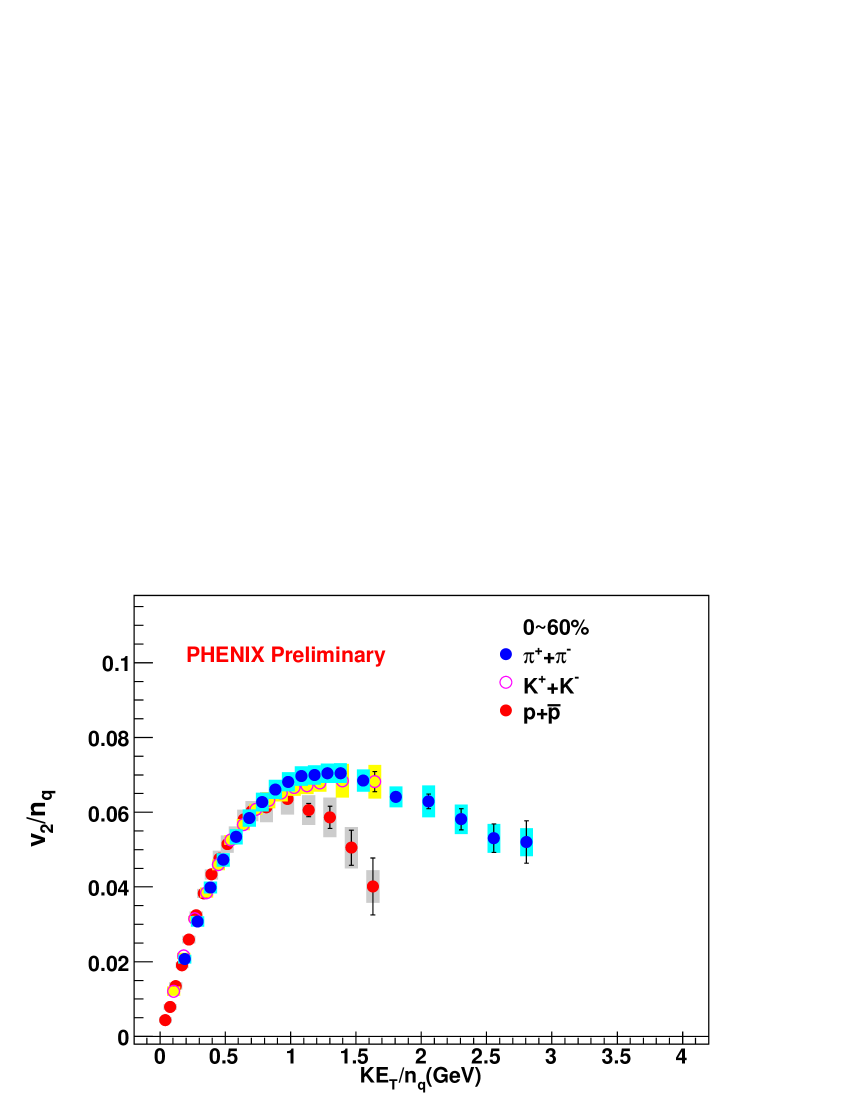
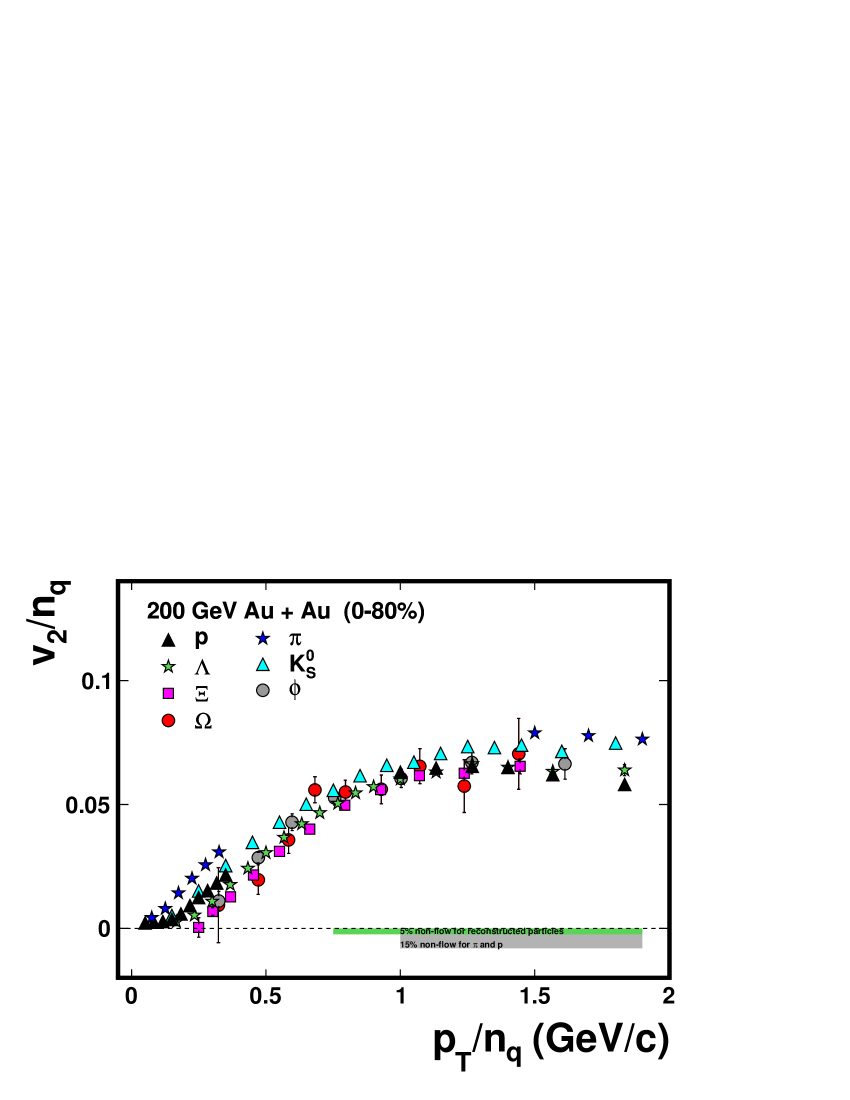
Figure 8 shows for identified particles from both PHENIX (left) and STAR (right). It is obvious that of protons and pions begin to diverge starting around , possible difference between lambda and pions is also observed.
6 Outlooks
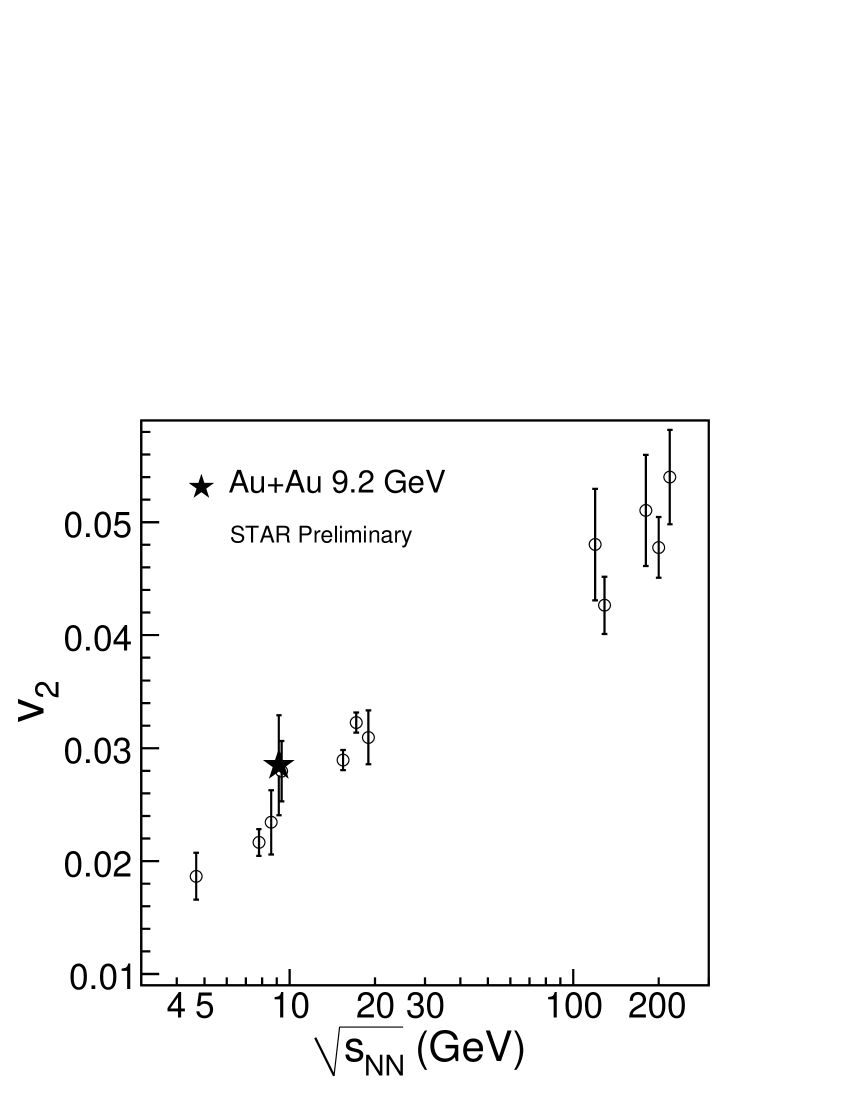
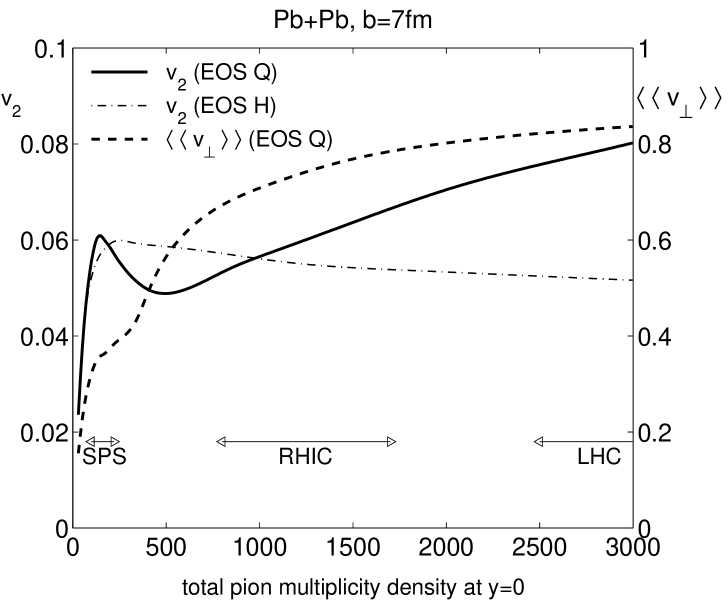
From the (3+1)-dimensional hydrodynamics with exact longitudinal boost-invariance [28], it is demonstrated that a phase transition from hadronic matter to QGP leads to non-monotonic behavior in both beam energy and impact parameter dependence. This is shown in right panel of Figure 9, in which for a combined Equation of State (EOS Q) that includes the phase transition between a resonance gas (EOS H) and for the QGP phase (EOS I), a dip is observed at the range of SPS energy. As begins to rise again for high density at LHC energies, the dip only covers the energy range between SPS and RHIC. The significance and the range it happens has to be determined by experiments. Left panel of Figure 9 shows the excitation function of . We see a general trend of increase with energy (thus density), with current error we cannot identify any possible abnormal around =10 Gev, the same energy at which the “horn” [29] is located. It is desirable to return to this energy range with accurate measurement to identify possible abnormalities.
Looking into RHIC II program and future heavy ion program at LHC, as part of a comprehensive test for the deviation from hydro limit, it is important to i) increase the system size while keep the energy the same (U+U collisions), and ii) increase the energy while keep the system size the same. The former will allow us to test if saturates or not by increasing the particle density in the transverse plane, and the latter will allow us to check if the viscosity increases as anticipated once we passed the transition temperature.
7 Summary
The deviation from ideal hydrodynamic limit is discussed. From the transport model based approach, it is found that the system is 30-50% away from the value at which it is supposed to saturate. The perfection of the nearly perfect liquid is reviewed. The current estimations of spread in a wide range from 0 to 10 times of the conjectured quantum limit, however, most of the calculated is below that of He at . It is concluded that the partonic collectivity has been reached at RHIC. The number of quark scaling is found to hold roughly at low energies, in small systems and in forward regions, however, signs of break down of NCQ scaling are observed at large . To the aspect of understanding the bulk property of the nearly perfect liquid, the importance of future heavy ion programs at RHIC and LHC is emphasized.
Acknowledgments
The author thank following people for providing inputs/plots for this paper: S. Esumi, P. Fachini, U. Heinz, T. Hirano, S. Huang, L. Kumar, R. Lacey, N. Li, H. Masui, J. Milosevic, J-Y. Ollitrault, A. Poskanzer, S. Sanders, M. Sharma, S. Shi, R. Snellings, H. Song, A. Taranenko, G. Usai, S. Voloshin, N. Xu.
References
- [1] BRAHMS, PHENIX, PHOBOS, and STAR Collaboration, Nuclear Physics A 757 (2005) Issues 1-2.
- [2] D. Teaney, Phys. Rev. C 68 (2003) 034913.
- [3] BRAHMS, PHENIX, PHOBOS, and STAR Collaboration, Hunting the Quark Gluon Plasma: Results from the First 3 Years at RHIC (Upton, NY: Brookhaven National Laboratory report No. BNL-73847-2005).
- [4] C. Adler et al., [STAR collaboration], Phys. Rev. C 66 (2002) 034904
-
[5]
A. Adil et al., Phys. Rev. C 74 (2006) 044905
T. Hirano et al., Phys. Rev. B 636 (2006) 299. - [6] H. Song and U. Heinz, Phys. Rev. C 78 (2008) 024902.
- [7] T. Hirano, (2008) arXiv:0812.4651.
- [8] S. Adler et al., [PHENIX collaboration], Phys. Rev. Lett. 94 (2005) 232302.
- [9] Y.Bai, Ph.D. Thesis. University Utrecht, the Netherlands, (2007).
- [10] G. Kestin and U. Heinz, Eur. Phys. J. C 61 (2009) 545-552.
- [11] M. Luzum and P. Romatschke, Phys. Rev. C 78 (2008) 034915.
- [12] R. S. Bhalerao, J. P. Blaizot, N. Borghini and J. Y. Ollitrault, Phys. Lett. B 627 (2005) 49.
- [13] H. J. Drescher, A. Dumitru, C. Gombeaud and J. Y. Ollitrault, Phys. Rev. C 76 (2007) 024905.
- [14] R. Snellings, H. Masui, J-Y. Ollitrault and A. Tang, (2009) this Quark Matter proceeding.
- [15] D. Teaney, Phys. Rev. C 68 (2003) 034913.
- [16] A. J. Kox, S. R de Groot, and W. A. van Leeuwen, Phys. A 84 (1976) 155.
- [17] B. Abelev et al., [STAR collaboration], Phys. Rev. C 79 (2009) 034909.
- [18] L. Csernai, J. Kapusta and L. McLerran, Phys. Rev. Lett. 97 (2006) 152303.
- [19] J-W. Chen, M Huang,Y-H. Li, E. Nakano and D-L. Yang, Phys. Lett. B (2008) 67018.
- [20] N. Demir and S. Bass, Phys. Rev. Lett. 102 (2009) 172302.
- [21] M. Issah and A. Taranenko for the PHENIX collaboration, (2006) arXiv:nucl-ex/0604011.
- [22] S. Shi for the STAR collaboration, (2009) arXiv:0907.2265.
- [23] X.Dong et al., Phys. Lett. B 597 (2004) 328.
- [24] J. Adams et al., [STAR collaboration], Phys. Rev. Lett. 95 (2005) 122301.
- [25] J. Milosevic for CERES collaboration, J. Phys. G 32 (2006) S97.
- [26] S. Sanders for the BRAHMS collaboration, (2009) this Quark Matter proceeding.
- [27] S. Huang for the PHENIX collaboration,J. Phys. G 35 (2008) 104105.
- [28] P. Kolb, J Sollfrank and U. Heinz, Phys. Rev. C 62 (2000) 054909.
- [29] S. Afanasiev et al., [NA49 collaboration], Phys. Rev. C 66 (2002) 054902.
- [30] L. Kumar for the STAR collaboration, arXiv:0907.1943