Evidence of kinetically arrested supercooled phases in the pervoskite oxide NdNiO3
Abstract
We report the time and temperature dependent response of thermopower in the non-magnetic perovskite oxide NdNiO3. We find that on cooling below the metal-insulator transition temperature the system evolves into a phase separated state which consists of supercooled metallic and insulating phases. This phase separated state exhibits out of equilibrium features such as cooling rate dependence and time dependence. The existence of these dynamical features is attributed to the transformation of supercooled metallic phases to the insulating state. On cooling a small fraction of supercooled phases gets kinetically arrested in a glassy state and these supercooled phases remain in that state down to low temperature. In the heating cycle the arrested states dearrest above 150 K and this results in the reappearance of time dependent features.
pacs:
64.60.My, 64.70.K-, 71.30.+h,I INTRODUCTION
First-order phase transition (FOPT) has been a topic of fundamental importance in the field of condensed matter physics. The materials undergoing such a transition often exhibit a phase-separated state in the vicinity of the transition. The phase separated state in many FOPT compounds displays a variety of interesting phenomena such as colossal magnetoresistance, CMR,Dagotto ; Zhang ; Uehara1 time dependent resistivity and magnetization,Morin ; Levy ; Ghivelder dependence of physical properties on rate of temperature change and enhanced 1/ noise.Fischer ; Uehara ; Podzorov From the last decade onwards, the main focus of research in FOPT studies is centered around understanding the origin of the phase separated state and its response to various perturbations such as magnetic and electric fields, pressure, x-ray and laser illumination, strain, temperature variation etc.Kimara ; Dagotto1 ; Casa ; Tomioka ; Kiryukhin ; Tokunaga ; Dong These studies reveal that coexisting phases have nearly equal free energies and the application of an external perturbation decreases the free energy of one phase relative to the other phase giving rise to a large change in the observed physical properties. Later it has been found that even in the absence of any apparent perturbations, such as mentioned above, the relative volumes of the coexisting phases can shift such that the total free energy decreases, which results in time dependence of physical properties at a fixed temperature.Devendra ; Levy
The existence of a mixed phase region with nearly equal free energies have its origin in the phenomenon of metastability, in particular supercooling or superheating. In a first order transition where heterogeneous nucleation is missing, the high temperature phase can survive below the thermodynamic transition temperature as a supercooled (SC) metastable phase.Chaikin The homogeneous nucleation will start when the thermal energy is of the order of the free energy barrier that separates the SC state from the ground state.Chaddah Each SC phase has a characteristic temperature known as the limit of metastability. Below this temperature the energy barrier separating the metastable state from the ground state vanishes and the SC phase is free to flip to the ground state. The SC phase will flip to the ground state only when their kinetics are not frozen their glass formation temperature is less than the limit of metastability .Chaddah1 Now if the glass forming temperature is higher than the limit of metastability, the SC phase will remain trapped down to low temperatures even when the free energy barrier vanishes. On subsequent heating the kinetics of these trapped phases will be restored to the metastable state above the temperature . In a phase separated system where the SC phases are not trapped in a glass-like state, the thermally activated stochastic switching of SC phases to the ground state will give rise to non-Debye relaxation in physical properties.Devendra So for time dependent effects will be observed only in the cooling cycle, while for time dependent effects will be observable both in heating and cooling cycle.
Here we have used the compound NdNiO3 to understand supercooling and glass formation in a polycrystalline material where a distribution of SC regions coexist, with each one of the different SC regions having a unique .Devendra NdNiO3 belongs to the family of rare earth nickelates and it undergoes a temperature driven metal to insulator transition and a para to antiferromagnetic transition at 200 K.Medarde ; Granados Now for the study of the dynamics of a phase separated system such as NdNiO3 the ideal probe to determine the fractional volume of the constituting phases could perhaps be a muon spin relaxation experiment.Torrance But for the lack of access to such facilities we depend on transport properties such as resistivity and thermopower to probe the system. These measurements suffer from the effects of percolation and inter-crystallite contact resistance and do not allow us to do an accurate estimate of the constituent volume fractions at temperatures far below the percolation threshold.Hurvits While thermopower and resistivity measurements on NdNiO3 as functions of temperature has been reported earlier by others, in this work we focus our attention on the dynamical aspects of the M-I phase transition through time dependent thermopower measurements. We find that at temperatures far below the percolation threshold, thermopower measurements are more sensitive to the presence of minority phases than that of resistivity. Further investigations suggest that on cooling the sample below the metal-insulator transition temperature, , while a majority of SC regions transform to the insulating state, a small fraction of SC regions get kinetically arrested in a glassy state. These SC regions present in the glassy metallic state exist down to low temperatures.
II Experimental Details
Polycrystalline NdNiO3 samples in the form of 6 mm diameter and 2 mm thick pellets were used in the thermopower measurements. The details of sample preparation and characterization are described elsewhere.Massa A temperature of 1000∘C and oxygen pressure of 200 bar is required to get good quality samples.
Below (200 K) NdNiO3 is not in thermodynamic equilibrium and it relaxes with time and thus any experimental result would depend on the procedure used for the measurement. We used the following procedure. While cooling we start with 300 K with the two sides of the NdNiO3 pellet kept at a temperature difference of 2 K, and then record the voltage () in steps of 1 K after allowing the temperature to stabilize at each point for about 30 s. In between two temperature points the sample was cooled at a fixed cooling rate of 2 K/min. During this process also care was taken to ensure that the temperature difference between the two ends of the sample remained at 2 K.endnote1 This procedure ensures that the two ends of the sample smoothly vary with temperature without any intermediate thermal oscillation. This condition is important since in our earlier measurements we have observed that thermal oscillations change the physical state of the system.Devendra To remove the effect of any stray thermo emf in the system, we recorded the voltage across the sample with the ends at zero temperature difference () in a different run under identical experimental conditions. This stray voltage was subtracted from at each temperature before calculating the absolute thermopower. After the cooling run was over the heating data were collected at every 1 K interval. The heating rate between two points was the same as the cooling rate used earlier. This cycle of measurement was also repeated with a different cooling and heating rate of 0.2 K/min.
It was observed that the thermopower above 200 K does not show any time dependence, and is independent of the history of the measurement. So to avoid the effect of any previous measurements all the time dependent measurements used the following protocol: for cooling cycle, first take the sample to 220 K, wait for half an hour, and then cool at 1.0 K/min to the temperature of interest and once the temperature is stabilized record the thermopower as a function of time. In the heating cycle the time dependent thermopower was done in a similar way: first take the sample to 220 K, wait for half an hour, then cool at 1.0 K/min to 85 K and then heat at 1.0 K/min to the temperature of interest, and once the temperature stabilized record the thermopower as a function of time. It was ensured that the temperature difference between the two ends of the sample was kept fixed at 2 K during all these measurements.
III Results
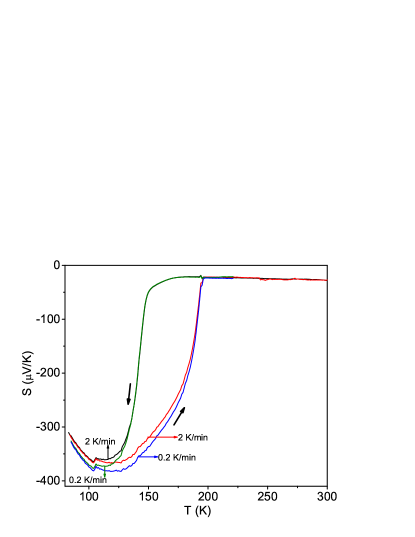
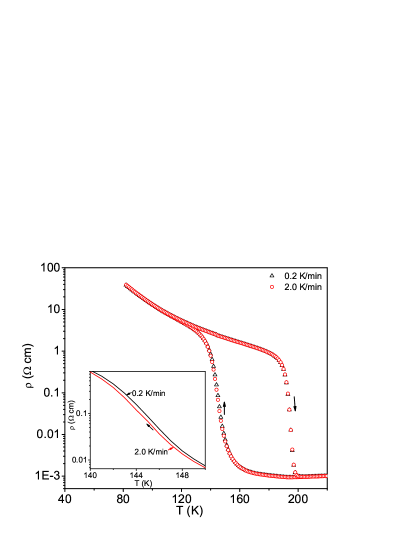
Figure 1 shows the thermopower of NdNiO3 as a function of temperature. The thermopower is multiple valued, the cooling and heating data differing significantly from each other and forming a large hysteresis loop. The sign of thermopower remains negative both in the metallic and insulating state which indicates that the charge carriers are electrons in both states. On cooling the sample below 300 K, the magnitude of thermopower decreases in magnitude till 200 K. Below this temperature the thermopower shows a strong temperature dependence with its magnitude attaining a maximum at about 115 K. The thermopower data indicates that NdNiO3 undergoes a metal to insulator transition at 200 K which is consistent with the resistivity (see Figure 1 ) and earlier thermopower measurements.Granados Below 115 K, the thermopower data does not follow the band gap model , unlike resistivity. A small jump in the thermopower has been observed at around 105 K, which is the region where the volume fraction of the metallic phases is small. Such behavior has been predicted from Bergman and Levy’s theory of effective thermopower of mixed phase systems and has been experimentally observed in Al-Ge thin films Bergman ; Hurvits .
Below the M-I transition, thermopower shows a significant dependence on the rate of temperature change. See Figure 1. A slower cooling rate of 0.2 K/min yields a higher absolute thermopower than that of the faster cooling rate 2.0 K/min. This rate dependence of thermopower is more readily seen below 125 K during a cooling run, while in resistivity, the cooling rate dependence is more significant near 145 K where the percolation of the metallic regions cease. In the heating cycle thermopower exhibits a large rate dependence at low temperatures and this rate dependence persists upto about 180 K before disappearing as we increase the temperature towards . In contrast to this we did not find any significant heating rate dependence in the resistivity data(See Figure 1).The presence of cooling and heating rate dependence in the thermopower data indicates that the system is not in its thermodynamic equilibrium both in cooling and as well as heating cycle. These observations are corroborated by the data shown in Figure 2 and Figure 3.
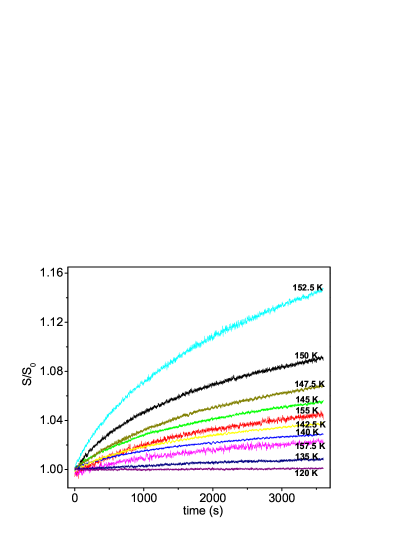
Figure 2 displays a subset of the time dependent thermopower data recorded at fixed temperatures in the cooling run. The data are presented as , where , so that the values are normalized for easy comparison. We found that below 170 K, the absolute value of thermopower increases with time. A maximum relative increase in thermopower of about 14 % was observed for a period of one hour at 152.5 K. The time dependence of thermopower is lower both above and below this temperature. Below 120 K, we did not find any detectable time dependence in the system. All the time dependence data were fitted to a stretched exponential form
| (1) |
where , , and are fit parameters with , and having negative value. The fits are quite good with value greater than 0.995 in most cases. See table 1.
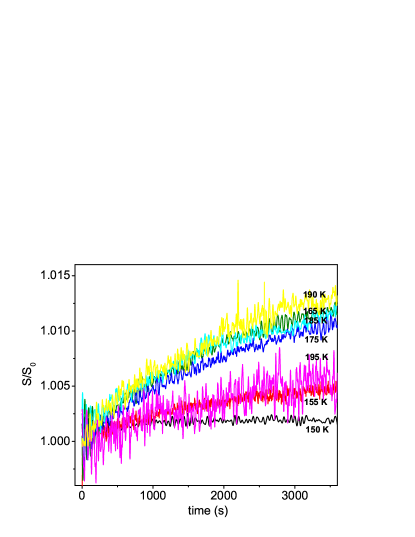
Figure 3 shows a part of time dependent thermopower data recorded at fixed temperatures in the heating runs. We did not find any significant time dependence up to 150 K. Above 150 K, the magnitude of thermopower increases with time. The maximum relative increase in thermopower in one hour is around 1% which is much smaller than that seen in the cooling runs. Above , the thermopower data is stable and no time dependence or cooling/heating rate dependence was observed .
| # | T(K) | (s) | ||||
|---|---|---|---|---|---|---|
| 1 | 140.0 | 0.0426(1) | 3.12(2) | 0.729(1) | 0.34 | 0.99705 |
| 2 | 145.0 | 0.0812(1) | 3.09(2) | 0.782(1) | 1.3 | 0.99837 |
| 3 | 147.5 | 0.0905(2) | 2.53(1) | 0.896(1) | 2.3 | 0.99853 |
| 4 | 150.0 | 0.118(1) | 2.34(1) | 0.826(1) | 3.2 | 0.99861 |
| 5 | 152.5 | 0.231(1) | 3.62(2) | 0.776(1) | 5.3 | 0.99905 |
| 6 | 155.0 | 0.0673(2) | 2.58(1) | 0.834(2) | 7.2 | 0.99687 |
IV Discussion
The presence of out of equilibrium features in thermopower is similar to that observed in our resistivity measurements reported earlier.Devendra Based on those observations we had proposed a model to understand the behavior of the phase separated regime. The model is as follows: The high temperature metallic phase survives below the metal to insulator transition in its supercooled metastable state. The supercooled metallic phase is not a single entity, but instead is made up of various regions which can make a transition or switch from the metallic to the insulating state independent of the neighboring regions. These regions are referred to as switchable regions (SR). Each SR in its metallic state has to cross an energy barrier to go to its insulating state and the barrier strength was determined to be , where is the volume of the SR, is its temperature of metastability, and is a constant. An SR will switch to the insulating state if (a) it attains its temperature of metastability or (b) it gains enough energy from thermal fluctuations so that it can cross the energy barrier . For and , supercooled phases will switch over to the insulating state stochastically which will cause time dependence in the physical properties. No time dependence in resistivity was observed in the heating cycle.Devendra On the basis of this it was claimed that all the SR’s switch to the insulating state on cooling implying that for all of them.
In thermopower measurements, during cooling, we got the maximum time dependence at around 152.5 K while in the case of resistivity the maximum time dependence occurs around 145 K. The maximum magnitude of change in thermopower in one hour () is 14 %, which is much smaller than that of resistivity ().Devendra We notice that the change in thermopower in one hour is much closer to the change in insulating volume fraction ().Devendra The time dependence of thermopower in the cooling cycle can be understood on the basis of our model. As we have discussed in the previous paragraph, below , the SR’s present in the SC state stochastically switch to the insulating state which enhances the volume fraction of insulating phase with time. This increase in insulating volume fraction results in a higher magnitude of thermopower. Thermopower being a transport property, the change in thermopower is also affected by percolation effects and thus the behavior of time dependence of thermopower and the time dependence of insulating volume fraction will not have a one-to-one monotonic correspondence.
Below 120 K no detectable time dependence was observed in the thermopower, but cooling rates of 2 K/min and 0.2 K/min lead to slightly different low temperature states with differing thermopower. This suggests that a tiny fraction of SR’s must remain in the supercooled state even below 120 K. Since we did not find any time dependence below 120 K, we argue that the kinetics of these SR’s are arrested and and they end up in a glass-like state. Now, the question arises why there is no rate dependence in resistivity below 120 K neither in cooling runs nor in the subsequent heating runs. To answer this question we suggest that the small fraction of SR’s trapped in the glassy state are not detectable in a resistivity measurement. This idea is in consonance with the fact that thermopower measurements show a small time dependence of about 1% over a period of an hour in heating runs (Figure 3) while no detectable time dependence was observed in the heating runs of resistivity measurements.Devendra
The advantage of thermopower over resistivity in detecting tiny amounts of SC metallic regions (SR’s) dispersed in an insulating matrix can perhaps be understood as follows. When the fraction of SC metallic regions is small they will be completely surrounded by insulating regions. Now the net contribution of a tiny metallic region embedded in an insulating matrix on the total resistivity of the material will be determined by the resistance of the metallic region plus its inter-crystallite resistances in the current path. Now we conjecture, based on our experience on the contact resistance of polycrystalline NdNiO3, that the inter-crystallite resistance between a metallic and an insulating crystallite will be very high compared to the resistance of the metallic crystallite. This implies that the tiny metallic region will be essentially shut out of the current path and will not be able to affect the resistivity of the material significantly. The boundary effects are much less significant in the case of thermopower compared to resistivity because the thermal conductivities of the metallic and insulating regions are comparable and this makes the thermopower sensitive to the embedded metallic regions.Cooper ; Jhou
In a heating run, the SR’s present in a glassy state will remain arrested in that state till their respective ’s are attained. In cooling runs we found time dependence down to 120 K while in heating runs we did not find any time dependence until 150 K which suggests that the SR’s which are arrested in the glassy state have their ’s above 150 K. On heating the system above 150 K, the kinetics of the SR’s gets dearrested and it can cross the free energy barrier and flip to the insulating state with a probability of flipping . In the time dependence data presented in Figure 3 the flipping of the SR’s to the insulating state raises the insulating volume fraction with time and this enhances the magnitude of thermopower with time. The fact that we get noticeable time dependence all the way upto suggests that the ’s are distributed quite broadly upto . We might now say that each SR has a unique temperature of metastability and a unique temperature of kinetic arrest . In a cooling run, the majority of the SR’s present in the supercooled state switch to the insulating state by the time their is attained and only a small fraction of SR’s get arrested in the glassy state and this suggests that the majority of the SR’s have their greater than .
V Conclusion
Our experimental results and analyses suggest the following picture for the NdNiO3 system. Below the system consists of SC metallic and insulating regions. Each of the SC metallic region has a unique temperature of metastability and a unique temperature of kinetic arrest . For the majority of the SC regions is greater than . Thus when the sample is cooled below , while the majority of the SC regions switch to insulating state when their temperature of metastability is reached, a small fraction of the SC regions which have get arrested in a glassy state and remain in that state down to low temperature. Such SC regions have their greater than about 150 K. In a heating run, these SC metallic regions remain trapped in their glassy metallic state till their temperature of kinetic dearrest () is reached. Above this temperature, these regions switch over to the insulating state stochastically.
VI Acknowledgement
DK thanks the University Grants Commission of India for financial support. JAA and MJM-L acknowledge the Spanish Ministry of Education for funding the Project MAT2007-60536 .
References
- (1) E. Dagotto 2002 Nanoscale phase separation and Colossal Magnetoresistance (Springer Berlin).
- (2) L. Zhang, C. Israel, A. Biswas, R. L. Greene and A. de Lozanne 2002 Science 298 805.
- (3) M. Uehara, S. Mori, C. H. Chen and S.-W. Cheong 1999 Nature 399 560.
- (4) F. J. Morin 1959 Phys. Rev. Lett. 3 34.
- (5) P. Levy, F. Parisi, L. Granja, E. Indelicato and G. Polla 2002 Phys. Rev. Lett. 89 137001.
- (6) L. Ghivelder and F. Parisi 2005 Phys. Rev. B 71 184425.
- (7) L. M. Fisher, A. V. Kalinov, I. F. Voloshin, N. A. Babushkina, D. I. Khomskii, Y. Zhang and T. T. M. Palstra 2004 Phys. Rev. B 70 212411.
- (8) M. Uehara and S.-W. Cheong 2000 Europhys. Lett. 52 674.
- (9) V. Podzorov, M. Uehara, M. E. Gershenson, T. Y. Koo and S. W. Cheong 2000 Phys. Rev. B 61 R384.
- (10) T. Kimura, Y. Tomioka, R. Kumai, Y. Okimoto and Y. Tokura 1999 Phys. Rev. Lett. 83 3940.
- (11) E. Dagotto 2005 Science 309 257.
- (12) D. Casa, V. Kiryukhin, O. A. Saleh, B. Keimer, J. P. Hill, Y. Tomioka and Y. Tokura 1999 Europhys. Lett. 47 90.
- (13) Y. Tomioka, A. Asamitsu, Y. Moritomo, H. Kuwahara and Y. Tokura 1995 Phys. Rev. Lett. 74 5108.
- (14) V. Kiryukhin, D. Casa, J. P. Hill, B. Kelmer, A. Vigliante, Y. Tomioka and Y. Tokura 1997 Nature 386 813.
- (15) M. Tokunaga, Y. Tokunaga and T. Tamegai 2004 Phys. Rev. Lett. 93 037203.
- (16) S. Dong, C. Zhu, Y. Wang, F. Yuan, K. F. Wang and J-M Liu 2007 J. Phys: Condensed Matter 19 266202 and refrences within this paper.
- (17) Devendra Kumar, K. P. Rajeev, J. A. Alonso and M. J. Martínez- Lope 2009 J. Phys: Condensed Matter 21 185402. Preprint is also avilable at arXiv:0811.1836v1.
- (18) P. M. Chaikin and T. C. Lubensky 1998 Principles of Condensed Matter Physics (Cambridge University Press) chapter 4.
- (19) P. Chaddah and S. B. Roy 1999 Phys. Rev. B 60 11926.
- (20) P. Chaddah, Kranti Kumar and A. Banerjee 2008 Phys. Rev. B 77 100402(R) .
- (21) M. L. Medarde 1997 J. Phys.: Condens. Matter 9 1679.
- (22) X. Granados, J. Fontcuberta, X. Obradors, Ll. Mañosa and J. B. Torrance 1993 Phys. Rev. B 48 11 666.
- (23) J. B. Torrance, P. Lacorre, A. I. Nazzal, E. J. Ansaldo and Ch. Niedermayer 1992 Phys. Rev. B 45 8209.
- (24) G. Hurvits, R. Rosenbaum and D. S. McLachlan 1993 J. Appl. Phys. 73 7441.
- (25) N. E. Massa, J. A. Alonso, M. J. Martínez-Lope and I. Rasines 1997 Phys. Rev. B 56 986.
- (26) This gives the effective cooling rate of 1 K/min.
- (27) D. J. Bergman and O. Levy 1991 J. Appl. Phys. 70 6821.
- (28) J-R. Cooper, B. Alavi, L. W. Zhou, W. P. Beyermann and G. Grun̈er 1987 Phys. Rev. B 35 8749(R).
- (29) J-S. Zhou, J. B. Goodenogh and B. Dabrowski 2003 Phys. Rev. B 67 020404(R).