Experimental realization of directed percolation criticality in turbulent liquid crystals
Abstract
This is a comprehensive report on the phase transition between two turbulent states of electroconvection in nematic liquid crystals, which was recently found by the authors to be in the directed percolation (DP) universality class [K. A. Takeuchi et al., Phys. Rev. Lett. 99, 234503 (2007)]. We further investigate both static and dynamic critical behavior of this phase transition, measuring a total of 12 critical exponents, 5 scaling functions, and 8 scaling relations, all in full agreement with those characterizing the DP class in 2+1 dimensions. Developing an experimental technique to create a seed of topological-defect turbulence by pulse laser, we confirm in particular the rapidity symmetry, which is a basic but nontrivial consequence of the field-theoretic approach to DP. This provides the first clear experimental realization of this outstanding, truly out-of-equilibrium universality class, dominating most phase transitions into an absorbing state.
pacs:
64.60.Ht, 64.70.mj, 47.27.Cn, 05.45.-aI introduction
Absorbing states, i.e., states which systems may fall into but never escape from, and phase transitions into them are expected to be ubiquitous in nature. For instance, spreading or contamination processes like fires or epidemics exhibit such transitions when the propagation rate changes: initially active (infected) regions eventually disappear forever at low rates, i.e., the absorbing state is reached, while they can be sustained (pandemic regime) for fast-enough propagation. Examples abound far beyond: hundreds of numerical models, describing, e.g., catalytic reactions, granular flows, and calcium dynamics in living cells, to name but a few, have been shown to exhibit such absorbing phase transitions Hinrichsen-AdvPhys2000 ; Henkel_etal-Book2008 . Such phase transitions also naturally arise from general problems such as synchronization Baroni_etal-PRE2001 ; Ahlers_Pikovsky-PRL2002 , self-organized criticality Dickman_etal-BrazJPhys2000 , spatiotemporal intermittency Pomeau-PhysD1986 , and depinning Buldyrev_etal-PRA1992 ; Ginelli_etal-PRE2003 . The vast majority of these transitions share the same critical behavior, that of the “directed percolation” (DP) class Hinrichsen-AdvPhys2000 ; Henkel_etal-Book2008 , as long as they are continuous.
Deep theoretical issues underpin this situation. Whereas universality is well understood for systems in thermodynamic equilibrium, this is still not the case for systems driven out of equilibrium, where even the relevant ingredients determining the class are not well understood. In this context, absorbing phase transitions are central because of their genuine nonequilibrium character, since absorbing states directly imply violation of the detailed balance. Janssen and Grassberger Janssen-ZPhysB1981 ; Grassberger-ZPhysB1982 conjectured that the DP universality class contains all continuous transitions into a single effective absorbing state in the absence of any extra symmetry or conservation law. The DP class thus appears as the simplest, and most common case, as testified by overwhelming numerical evidence.
However, the situation has been quite different in experiments. Over the last twenty years and more, a number of experiments have been performed in situations where DP-class transitions would be theoretically expected, but they have always yielded mixed and/or partial results with limited accuracy Ciliberto_Bigazzi-PRL1988 ; Daviaud_etal-PRA1990 ; Buldyrev_etal-PRA1992 ; Michalland_etal-EurophysLett1993 ; Willaime_etal-PRE1993 ; Degen_etal-PRE1996 ; Colovas_Andereck-PRE1997 ; Tephany_etal-PhysA1997 ; Daerr_Douady-Nature1999 ; Cros_LeGal-PhysFluids2002 ; Rupp_etal-PRE2003 ; Lepiller_etal-PhysFluids2007 ; Pirat_etal-PRL2005 (Table 1). This lack of fully convincing experimental realizations, in contrast with the wealth of numerical results, has been found surprising and a matter of concern in the literature Grassberger-Monograph1997 ; Hinrichsen-AdvPhys2000 .
Recently, though, studying a spatiotemporal intermittency regime occurring in turbulent liquid crystals, we found a transition whose complete set of static critical exponents match those of the DP class Takeuchi_etal-PRL2007 . The goal of the present paper is to provide a comprehensive report on this transition including not only a more complete description of experiments designed to investigate the static critical behavior, but also new experiments giving access to dynamic critical behavior.
| (1+1)D System | Size222Number of effective degrees of freedom indicated by the corresponding authors. | Refs. | |||||
| annular Rayleigh-Bénard | Ciliberto_Bigazzi-PRL1988 | ||||||
| annular Rayleigh-Bénard | Daviaud_etal-PRA1990 | ||||||
| linear Rayleigh-Bénard | Daviaud_etal-PRA1990 | ||||||
| interface roughening | Buldyrev_etal-PRA1992 | ||||||
| viscous fingering | Michalland_etal-EurophysLett1993 | ||||||
| vortices of fluid | Willaime_etal-PRE1993 | ||||||
| Taylor-Deen | Degen_etal-PRE1996 | ||||||
| Taylor-Couette | - | Colovas_Andereck-PRE1997 | |||||
| granular flow | Daerr_Douady-Nature1999 ; Hinrichsen_etal-PRL1999 | ||||||
| torsional Couette | Cros_LeGal-PhysFluids2002 | ||||||
| ferrofluidic spikes | Rupp_etal-PRE2003 | ||||||
| lateral heat convection in annulus | Lepiller_etal-PhysFluids2007 | ||||||
| DP333Some exponents are obtained using scaling relations. Errors are then estimated by the law of propagation of error. | 444See also the remark Note4 . | 444See also the remark Note4 . | Jensen-JPhysA1999 | ||||
| (2+1)D System | Size | Refs. | |||||
| liquid columns | Pirat_etal-PRL2005 | ||||||
| DSM1-DSM2 (present paper)555Only some of the measured exponents are shown. See Table 2 for the complete list. | —– | ||||||
| DP333Some exponents are obtained using scaling relations. Errors are then estimated by the law of propagation of error. | 444See also the remark Note4 . | 444See also the remark Note4 . | Grassberger_Zhang-PhysA1996 ; Voigt_Ziff-PRE1997 | ||||
The paper is organized as follows. We first illustrate the coarse-grained dynamics of the turbulent regime of electroconvection studied and our basic experimental setup (Sec. II), with further details on image analysis given in the Appendix. To characterize the critical behavior, we perform three series of experiments: (a) steady-state experiment under constant applied voltages (Sec. III), (b) critical-quench experiment starting from fully active initial conditions (Sec. IV), and (c) critical-spreading experiment starting from a single active seed, prepared with a novel experimental technique using pulse laser, developed in this work (Sec. V). In Sec. VI, our results are summarized and we discuss why clear DP-class critical behavior is observed rather easily in our system, contrary to many other experiments performed in the past in this context.
II experimental setup
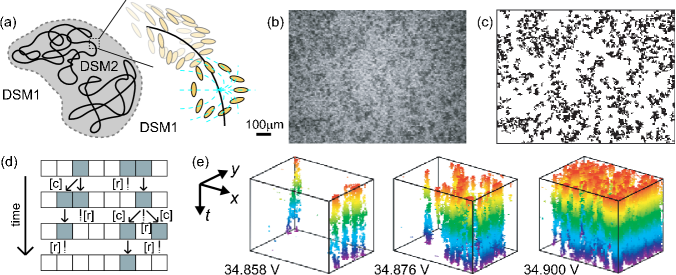
We work on the electrohydrodynamic convection of nematic liquid crystals, which occurs when a thin layer of liquid crystal is subjected to an external voltage strong enough to trigger the Carr-Helfrich instability Dubois-Violette_etal-JPhysParis1971 ; deGennes_Prost-Book1993 . This is a priori a suitable system to study critical behavior thanks to its possibly large aspect ratio, fast response time, and easy controllability. We focus on the transition between two turbulent regimes, called dynamic scattering modes 1 and 2 (DSM1 and DSM2), observed successively upon increasing the root-mean-square amplitude of the voltage at relatively low frequencies deGennes_Prost-Book1993 ; Kai_etal-JPSJ_PRL . The difference between DSM1 and DSM2 lies in their density of topological defects in the director field [Fig. 1(a)]. In the DSM2 state, a large quantity of these defects, called disclinations, are present Nehring-PRA1973 . They elongate and split constantly under the shear due to the fluctuating turbulent flow around. In DSM1, on the other hand, disclinations are present but kept smaller than the critical size and disappear immediately. Their density thus remains very low. The many disclinations in DSM2 lead to the loss of macroscopic nematic anisotropy and to a lower light transmittance than in DSM1.
Our basic experimental setup is shown in Fig. 2. The sample cell is made of two parallel glass plates spaced by a polyester film of thickness . Both inner surfaces are covered with transparent electrodes of size , coated with polyvinyl alcohol and then rubbed in order that molecules are planarly aligned in the direction, defined thereby. The cell is filled with -(4-methoxybenzylidene)-4-butylaniline (MBBA; purity , Tokyo Chemical Industry) doped with 0.01 wt.% of tetra--butylammonium bromide. The temperature of the cell is kept constant carefully by a handmade thermocontroller, composed of heating wires and Peltier elements controlled by a proportional-integral-derivative feedback loop with a lock-in amplifier [Fig. 2(b)]. Windows of the thermocontroller are made of sapphire in order to improve the spatial homogeneity of the temperature. Throughout each series of experiments, the cell temperature is maintained at with fluctuations typically of a few , unless otherwise stipulated, measured by three thermistors placed at different positions close to the cell.
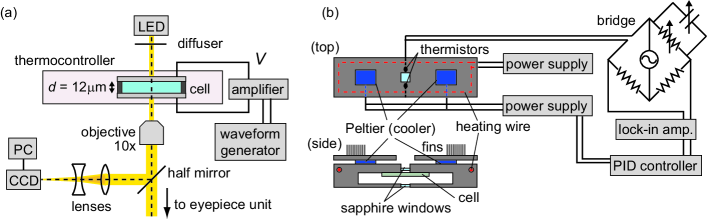
We observe the electroconvection through the transmitted light from a handmade stabilized light source made of light-emitting diodes, recorded by a charge-coupled device camera. The observed region is a central rectangle of size (Fig. 2, inset). Since there is a minimum linear size of DSM2 domains, Kai_etal-JPSJ_PRL , we can roughly estimate the number of effective degrees of freedom at for the convection area and for the observation area. Note that the meaningful figure is that of the total system size, which is at least four orders of magnitude larger than in earlier experimental studies (Table 1). In the following, we vary and fix the frequency at , at roughly one third of the cutoff frequency which separates the conducting and the dielectric regimes of electroconvection Dubois-Violette_etal-JPhysParis1971 ; deGennes_Prost-Book1993 .
Disclinations being topological defects, the spontaneous nucleation of DSM2 in a DSM1 domain is in principle forbidden. It is indeed an essentially unobservable rare event, except along the edges of the electrode and for very high voltages, far from the range investigated in the present paper. Therefore, the fully DSM1 state serves as an absorbing state. On the other hand, DSM2 domains introduced externally, or present initially in the system can remain sustained in the bulk for large enough voltages, but eventually disappear for voltages lower than a certain threshold . Closely above , a regime of spatiotemporal intermittency (STI) is observed, with DSM2 patches moving around on a DSM1 background [Fig. 1(b), and Movie S1 of Ref. EPAPS ]. The basic dynamics of the observed STI is illustrated in Fig. 1(d): active DSM2 patches evolve in space-time essentially by contamination of neighboring inactive (absorbing) DSM1 regions and by relaxation into the DSM1 state. This suggests an absorbing phase transition induced by change in rates of both elementary processes Pomeau-PhysD1986 , which are functions of the applied voltage here. The order parameter is then simply the ratio of the surface occupied by active DSM2 regions to the whole area.
Prior to any analysis, we must distinguish DSM2 domains from DSM1. This binary reduction can be easily performed by our eyes, so we automated it, based on the facts that DSM2 domains have lower transmittance, longer time correlations, and have a minimum area of Kai_etal-JPSJ_PRL (see Appendix for details). A typical result is shown in Fig. 1(c), and in Movie S2 of Ref. EPAPS . Figure 1(e) displays spatiotemporal diagrams obtained this way, showing how DSM2 patches evolve in the steady state. This supports the qualitative dynamics illustrated in Fig. 1(d) and indeed looks like the directed percolation of, say, water in a porous medium under gravitational field.
III steady-state experiment
We first observe STI in the steady state under constant voltage , in the range of . The voltage for the onset of steady roll convection (Williams domain) is . Spatiotemporal distributions of DSM2 patches are recorded over the period , which is longer than correlation times defined from the fluctuations of the order parameter .
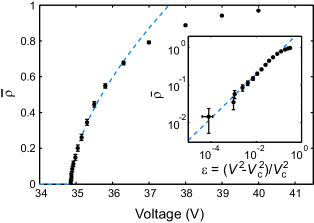
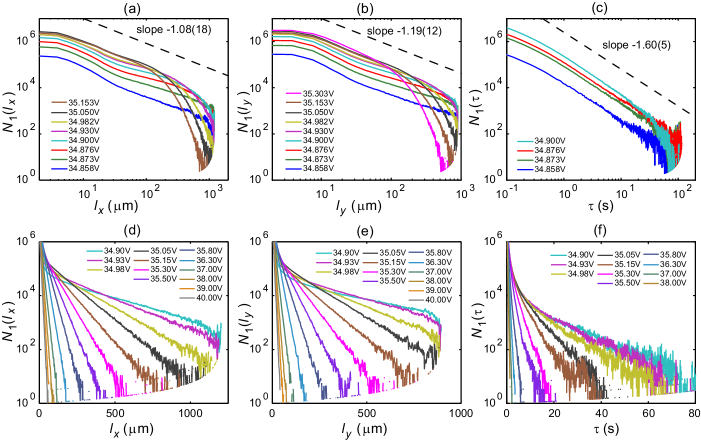
Figure 3 shows the time-averaged order parameter , i.e., the average fraction of DSM2. It shows that the transition is continuous and that scales algebraically near the critical point. Fitting these data with the usual scaling form Note1
| (1) |
the critical voltage and the critical exponent are found to be
| (2) |
where the numbers in parentheses indicate the range of errors in the last digits Note-Error . Our estimate is in good agreement with the value for -dimensional DP, Grassberger_Zhang-PhysA1996 ; Voigt_Ziff-PRE1997 .
We then measure the distributions of the sizes and durations of inactive (DSM1) regions, or intervals between two neighboring active (DSM2) patches. Histograms are made separately for each spatial direction, and , to take account of the anisotropy of DSM1 Strangi_etal-PRE1999 ; Nagaya_etal-JPSJ1999 . Care is also taken to compensate missing intervals due to the finite observation window: since an interval of size may not be captured within a frame of size , i.e., either edge of the interval may not be in the frame, with probability , the unbiased distributions are estimated from the observed ones by Note2 .
The results are shown in Fig. 4. We find that the DSM1 distributions decay algebraically within the observed length/time scale for voltages very close to criticality, while for higher voltages they start to decay exponentially from certain characteristic length/time scales, as expected for continuous absorbing phase transitions Henkel_etal-Book2008 . The observed power-law decays are fitted as and with
| (3) |
where and indicate the exponent measured in the and direction, respectively. These exponents are directly connected to the fractal dimensions of the DSM2 clusters measured in the corresponding direction as . The critical exponents and for DP can be estimated using scaling relations with the order parameter exponent and the correlation length/time exponents and , namely Henkel_etal-Book2008 ,
| (4) |
They give and for dimensions Voigt_Ziff-PRE1997 . Although the existence of slight discrepancies of order in Eq. (4) is suggested from numerical studies Hede_etal-JSP1991 ; Henkel_Peschanski-NuclPhysB1993 , our estimates in Eq. (3) agree with values expected for the DP class at any rate.
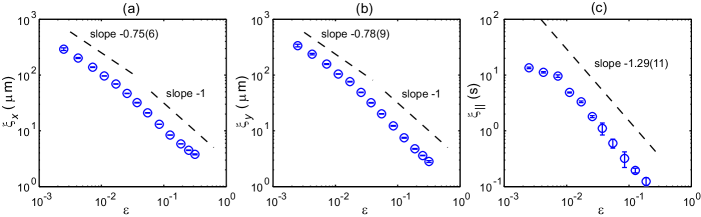
Moreover, the DSM1 distributions allow estimating correlation length and time scales, and , respectively, from their exponential tails shown in Fig. 4(d-f). Fitting distributions with an empirical form Ciliberto_Bigazzi-PRL1988 ; Rupp_etal-PRE2003
| (5) |
with powers and fixed at the estimates in Eq. (3), we obtain the results shown in Fig. 5. Both and show algebraic divergence
| (6) |
near criticality as expected, except for the first two points in Fig. 5(c), which deviate from the power law presumably due to finite length of movies () used to count the distributions. Fitting Eq. (6) to the data in scaling regions (the first five points for and all the points except the first two for ), we obtain
| (7) |
They are in good agreement with the DP values and Grassberger_Zhang-PhysA1996 ; Voigt_Ziff-PRE1997 . In addition, the facts that no significant anisotropy is found between and and that they can be even shorter than the cell depth [Fig. 5(a,b)] suggest that distributions of DSM2 patches are practically not influenced by the anisotropy of DSM1 Strangi_etal-PRE1999 ; Nagaya_etal-JPSJ1999 and by the existence of coherent roll structure of width roughly behind DSM1 Nagaya_etal-JPSJ1999 .
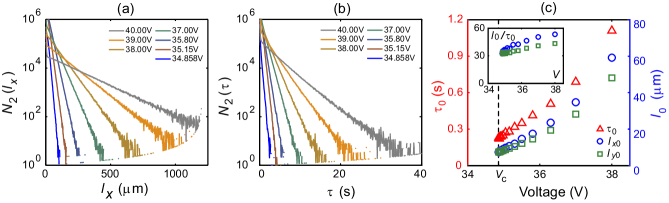
On the other hand, distributions of sizes of active (DSM2) patches do not show any long range correlations even close to criticality [Fig. 6(a,b)]. It implies that the local recession of DSM2 into DSM1 sketched in Fig. 1(d) is indeed always present. The effective relaxation rate can be directly estimated, just as an inverse of the characteristic time from the exponential tail of the temporal DSM2 distribution, shown in Fig. 6(c). The characteristic time increases linearly with except for high voltages, where it is not simply determined from the dynamics of individual patches because of the saturation of the DSM2 fraction (Fig. 3). In particular, it exhibits no sign of criticality. All these observations are consistent with, e.g., the dynamics of the so-called contact process Harris-AnnProb1974 (depicted in Fig. 1(d)), a prototypical model showing a DP-class transition Hinrichsen-AdvPhys2000 ; Henkel_etal-Book2008 , indicating that such process indeed governs the coarse-grained dynamics of our STI regime in liquid crystal turbulence.
Similarly, the spatial distributions of DSM2 sizes yield characteristic length scales and [Fig. 6(c)]. Although they appear to be also dominated by the relaxation process, as suggested from an effectively constant ratio [inset of Fig. 6(c)], they clearly show anisotropy [Fig. 6(c)], as opposed to the correlation lengths and estimated from DSM1-size distributions [Fig. 5(a,b)]. This implies that the contamination process of DSM2 is indeed driven by the anisotropic, fluctuating shear flow of surrounding DSM1. The larger effective contamination rate in is in line with the fact that the turbulent structure of DSM1 remains mainly in the - plane Strangi_etal-PRE1999 , but at odds with the global elliptic shape of growing DSM2 nuclei, longer in , observed for higher voltages Kai_etal-JPSJ_PRL ; Note3 . Both would be explained if we assume that turbulent flow behind is faster and more correlated in the direction, but further studies are necessary on this point.
IV critical-quench experiment
A typical experiment performed usually on numerical models showing absorbing phase transitions is the critical decay of active patches from fully active initial conditions Hinrichsen-AdvPhys2000 ; Henkel_etal-Book2008 . In such critical-quench experiments, correlation length and time grow in time, and, as long as they remain much smaller than the system size, scaling estimates are free from finite-size effects.
Experiments are performed as follows: we first apply to the cell and wait until it is entirely invaded by DSM2 domains. We then suddenly decrease the applied voltage to a value in the range of , i.e., near , and observe the time decay of activity for . We repeat this times for each and average the results over this ensemble.
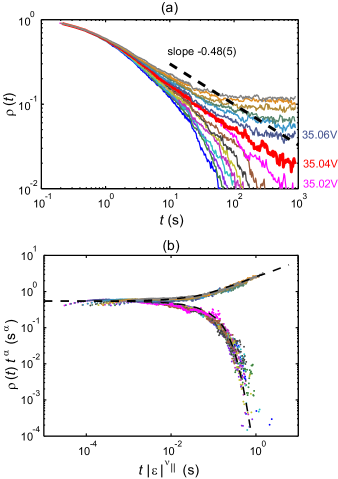
We first measure the decay of the order parameter after the quench [Fig. 7(a)]. As expected, decays exponentially with a certain characteristic time for lower voltages, converges to a finite value for higher voltages, and in-between at , it decays algebraically over the whole observation time. A simple scaling ansatz implies the following functional form for in this case:
| (8) |
where is the deviation from criticality and is a universal scaling function. From the slopes of the algebraic regimes for the three values closest to the threshold, we estimate
| (9) |
Note that measured here is slightly higher than in the steady-state experiments. In fact, the roll convection onset was also higher. We believe this is because of possible slight shift in the controlled temperature, and also of the ageing of our sample, a well known property of MBBA, during the days which separated the two sets of experiments. On the other hand, no measurable shift of was detected during a given set of experiments. We also confirmed that here is consistent with a threshold roughly estimated from steady state just before the critical-quench experiments. Our estimate of the critical exponent is again in good agreement with the DP value Voigt_Ziff-PRE1997 .
Furthermore, the scaling form of Eq. (8) implies that the time series for different voltages collapse on a single curve when is plotted as a function of . Our data do collapse reasonably well [Fig. 7(b)], where the upper and lower branches correspond to and , respectively. It is compared and found in good agreement with the universal scaling function of the DP class [dashed curve in Fig. 7(b)], calculated numerically from the -dimensional contact process. It shows that the decay of DSM2 patches is governed by this DP universal function, except for the very early stage where it is influenced by microscopic features of the liquid crystal, as expected.
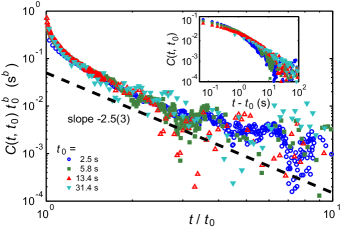
We also measure the autocorrelation function , defined as
| (10) |
where denotes average in space and over ensembles. During the critical decaying process, is not a function of (inset of Fig. 8) but scaled rather by , a feature sometimes referred to as “ageing” in the literature Henkel-JPhysCM2007 . Our data can be collapsed (Fig. 8) using the expected scaling form
| (11) |
with
| (12) |
Both are in agreement with DP values and , estimated from the scaling relations Baumann_Gambassi-JStatMech2007
| (13) |
where is the spatial dimension.
The dynamic aspect of critical behavior can also be characterized using first-passage quantities Majumdar-CurrSci1999 . One of these is the local persistence probability , defined as the probability that the local state at a given point in space has not changed until time , which typically shows a power-law decay . The non-trivial local persistence exponent is known to be in general independent of usual critical exponents such as , and far less is known about its universality, mainly due to the fact that persistence is a quantity involving an infinite-point correlation function.
In the context of DP, local persistence is measured from the probability that initially inactive “sites” do not become active up to time . (The persistence of activity is always dominated by the local relaxation into the inactive state and shows only exponential decay, similarly to Fig. 6.) Initial conditions are typically set to be random in numerical studies Hinrichsen_Koduvely-EPJB1998 ; Albano_Munoz-PRE2001 ; Menon_etal-EPL2003 ; Fuchs_etal-JStatMech2008 , which is, however, impossible in this experiment at present. We therefore consider, as “initial condition” for the local persistence, configurations chosen at some moment during the critical quench and measure the persistence probability .
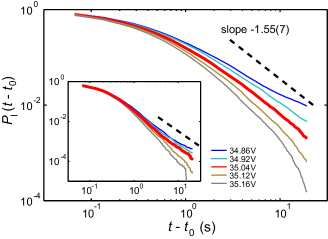
The scaling regime for the order parameter decay observed in Fig. 7 starting only after times of typically -, we further limit ourselves to values larger than this microscopic, non-universal time. Typical results are shown for in Fig. 9. The local persistence probability is found to converge to a finite constant for and to decay exponentially for , as expected from numerical studies of absorbing phase transitions Hinrichsen_Koduvely-EPJB1998 ; Albano_Munoz-PRE2001 ; Menon_etal-EPL2003 ; Fuchs_etal-JStatMech2008 ; Grassberger-arXiv2009 . At criticality, decays algebraically (again beyond some time of the order of ) with
| (14) |
The value of for -dimensional DP is still a matter of debate, with different estimates in past numerical studies: Albano_Munoz-PRE2001 , Fuchs_etal-JStatMech2008 , and very recently , found with an improved algorithm Grassberger-arXiv2009 . Our value, which is rather robust with respect to changing the initial conditions and the initial time (Fig. 9), is in agreement with all numerical estimates to our accuracy.
V critical-spreading experiment
In order to complete the characterization of the dynamic critical behavior of the DSM1-DSM2 transition, we performed critical spreading experiments, which start from a single seed of active, DSM2 region. This allows to measure other critical exponents, such as the one governing the scaling of the probability that a cluster starting from a single active seed survives forever: , known to serve as another order parameter characterizing absorbing phase transitions Hinrichsen-AdvPhys2000 ; Henkel_etal-Book2008 .
The two exponents and are known to be equal to each other for the DP class, thanks to an extra symmetry linked to time-reversal, the so-called rapidity symmetry Hinrichsen-AdvPhys2000 ; Henkel_etal-Book2008 . This symmetry also implies that where is defined from the time decay of the survival probability at threshold, .
We stress, however, that the rapidity symmetry and the resulting scaling relations do not hold generically in absorbing phase transitions. Although a value of consistent with DP was suggested from the critical scaling of hysteresis loops in the DSM1-DSM2 transition Takeuchi-PRE2008 , it remains important to assess all spreading exponents as accurately and independently as possible, in order to complete our characterization of DP-class critical behavior and check directly the rapidity symmetry.
V.1 Technique for nucleating DSM2
In contrast to numerical simulations, it is not easy, in experiments, to prepare an initial, single, localized seed of DSM2 in an otherwise homogeneous DSM1 system. We developed an experimental technique for nucleating a DSM2 patch artificially, using a pulse laser.
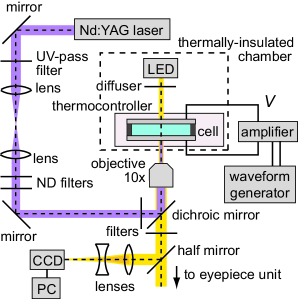
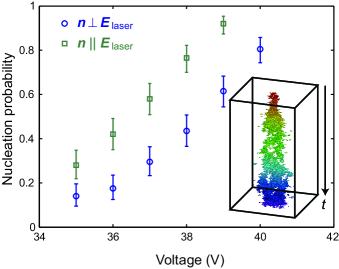
The experimental setup for the critical-spreading experiments is schematically shown in Fig. 10. We emit - pulses of Nd:YAG laser (MiniLase II 20Hz, New Wave Research), focused by an objective lens (, NA , UPlanFLN, Olympus), into the cell. Using its third harmonic at , around which MBBA has a broad absorption band Mizuno_Shinoda-MolCrystLiqCryst1978 ; Mizuno_Shinoda-MolCrystLiqCryst1981 , and reducing its energy to roughly at the cell, we can indeed nucleate DSM2 from the absorbing DSM1 state (inset of Fig. 11) without any observable damage to the sample. Figure 11 shows the probability of the DSM2 nucleation induced by emitting five successive laser pulses at . The nucleation probability increases with voltage and is significantly higher for laser polarized along the mean director field. This confirms that nucleation is indeed brought about by the laser absorption of MBBA, since its absorbance is higher along the long axis of the molecule Mizuno_Shinoda-MolCrystLiqCryst1978 ; Mizuno_Shinoda-MolCrystLiqCryst1981 . Moreover, the electronic structure of MBBA reveals that the ultraviolet absorption band stems from the C–N and C–C bonds between the aniline and benzyliden rings and is strongly coupled with twist angles there Mizuno_Shinoda-MolCrystLiqCryst1981 . We therefore speculate that absorption of ultraviolet laser pulses might lead to a sudden conformation change in the molecular structure, creating a topological defect and thus triggering a DSM2 nucleation.
V.2 Results
We perform the critical-spreading experiments with the technique above. For each measurement we emit ten successive pulses polarized along the molecules (in the direction), with which DSM2 is always nucleated for voltages of interest. In order to make reliable statistics for the survival probability, it is necessary to repeat experiments at least hundreds of times for each voltage. This led us to improve further the temperature control of the cell, both in short and long time scales. This is achieved by placing the thermocontroller in a thermally-insulated chamber (Fig. 10), made of plastic foam stage, wall, and ceiling, whose temperature inside is kept constant by circulating constant-temperature water. The cell temperature is finally stabilized at with fluctuations at most over two weeks. This allows us to repeat the experiment - times for each voltage in the range of . The roll convection onset and the critical voltage roughly measured in steady state were and , respectively.
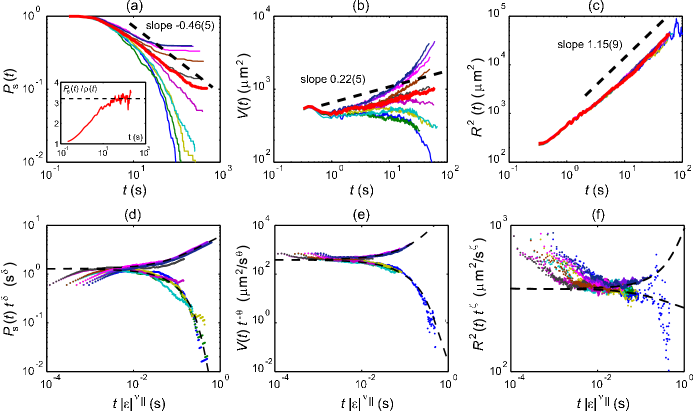
We measure not only the survival probability but also the volume and the mean square radius of DSM2 clusters, averaged over all the repetitions, even if the cluster dies before time . The following relations are then expected from the scaling ansatz Hinrichsen-AdvPhys2000 ; Henkel_etal-Book2008 :
| (15) | ||||
| (16) | ||||
| (17) |
where are universal scaling functions.
The experimental results are shown in Fig. 12. Except for where all the data are almost overlapping, which is also typically the case in simulations of DP-class models, the data show opposite curvatures below and above a certain voltage. Seeking for the curve with the longest algebraic regime in , which is statistically most reliable, we locate the critical voltage at
| (18) |
We then measure the three critical exponents from the algebraic regime for three voltages around , yielding
| (19) |
All of them are in good agreement with the DP exponents, , and Voigt_Ziff-PRE1997 . This confirms the scaling relations expressing the rapidity symmetry. It is further confirmed by plotting the ratio of the survival probability to the DSM2 fraction in the critical-quench experiments [inset of Fig. 12(a)], which shows that the two order parameters become asymptotically proportional to each other
| (20) |
with the coefficient .
We also tested data collapse [Fig. 12(d-f)], which provides reasonable results given the limited statistical accuracy of the data. The obtained scaling functions coincide satisfactorily with those of the -dimensional contact process [dashed curves in Fig. 12(d-f)]. As in the data collapse of [Fig. 7(b)], the collapsed data show typical time scales above which the corresponding quantities are governed by the DP scaling functions.
VI summary and discussion
We have performed three series of experiments, namely, steady-state experiments, critical-quench experiments, and critical-spreading experiments, to characterize the critical behavior of the DSM1-DSM2 transition in liquid crystal turbulence. Table 2 summarizes the main results. We have measured in total 12 critical exponents with reasonable accuracy, typically over a few orders of magnitude of power-law regimes. All of the measured exponent values agree within a few percent with those defining the DP universality class. Given that most of them are theoretically linked through scaling relations, we can equivalently say that we have experimentally confirmed those scaling relations, 8 in total, that connect the measured exponents (Table 3). Among them, we have confirmed in particular the rapidity symmetry , providing also the asymptotic amplitude of the ratio between the two order parameters, . Moreover, we have also tested the expected scaling forms of Eqs. (8), (11), (15)-(17) through data collapse, and found them in good agreement with numerically-obtained DP universal scaling functions. Based on all these results, we conclude that the DSM1-DSM2 transition constitutes an unambiguous experimental realization of an absorbing phase transition in the DP universality class.
| Exponent | DSM1-DSM2111For and exponents measured in and direction are shown in this order. | DPGrassberger_Zhang-PhysA1996 ; Voigt_Ziff-PRE1997 | ||
|---|---|---|---|---|
| density order parameter | ||||
| correlation length | ||||
| correlation time | ||||
| inactive interval in space | 222See also the remark Note4 . | |||
| inactive interval in time | 222See also the remark Note4 . | |||
| density decay | ||||
| local persistence | Grassberger-arXiv2009 | |||
| ageing in autocorrelator | ||||
| survival probability | ||||
| cluster volume | ||||
| cluster mean sqr. radius | ||||
| Scaling relations | LHS | RHS | DPGrassberger_Zhang-PhysA1996 ; Voigt_Ziff-PRE1997 | |
|---|---|---|---|---|
| 111See also the remark Note4 . | (in ) | |||
| (in ) | ||||
| 111See also the remark Note4 . | ||||
| 222The value of is used for . | ||||
| 222The value of is used for . | ||||
| 222The value of is used for . | ||||
We now return to our initial remark concerning the surprising scarcity of experimental realizations of DP-class transitions (Table 1).
One central difficulty lies in the necessity to avoid, as much as possible, quenched disorder, which is known to be relevant. It is theoretically known that such disorder does affect DP criticality and even destroys it for strong disorder Hooyberghs_etal-PRL2003 . Recent theoretical and numerical studies show that even weak disorder changes the asymptotic critical behavior Hoyos-PRE2008 ; Vojta_etal-PRE2009 ; Fallert_Taraskin-PRE2009 , but the characteristic length/time scale separating DP and disordered, so-called “activated” critical behavior grows fast with decreasing strength of disorder Hoyos-PRE2008 ; Vojta_etal-PRE2009 . It is therefore important to work with systems made of macroscopic units, where quenched disorder is expected to be negligible. We consider that the quenched disorder in our system, which may take the form of inhomogeneities in the electrodes or impurities in the sample, is also sufficiently weak.
Still, our DSM1-DSM2 transition seems to be the only fully convincing one. Three factors explain, in our view, why our experiments provided such clear DP scaling laws.
(a) Large system size and fast response. As already mentioned, one great advantage to work with electroconvection is that very large aspect ratios can easily be realized. The number of effective degrees of freedom of our cell is , which is orders of magnitude larger than any earlier experiment (Table 1). This considerably suppresses finite-size effects and allows to observe scaling on several orders of magnitude. Similarly, the typical microscopic timescales of liquid crystals are very short (of the order of ), providing accurate statistics in reasonable laboratory time.
(b) Almost perfectly absorbing state. The condition for being an absorbing state, i.e., that the system can never escape once it entered, appears to be somewhat too strict from the experimental point of view. Indeed, spontaneous nucleation of the active state seems to have been present at least in some of the past experiments Hinrichsen-AdvPhys2000 ; Rupp_etal-PRE2003 , which blurs the critical behavior beyond some finite scales.
On the other hand, our active state, DSM2, consists of topological defects, whose spontaneous formation is in principle forbidden. Of course this may occur in practice, as suggested from the observation of vanishing hysteresis at the DSM1-DSM2 transition Takeuchi-PRE2008 , but the nucleation rate remains so low that we cannot directly observe it, constituting an almost perfectly absorbing state.
(c) Fluctuating absorbing state. In most earlier experiments and numerical studies, the absorbing state has been essentially fluctuation-free, or laminar. This is indeed a natural choice suggested from the minimal theory of DP, and causes of course no problem in numerical studies. In experiments, however, such absorbing states may typically cause long-range effects through the rigidity of their laminar pattern and/or the propagation of soliton-like objects, which may further reduce the effective system size and even break DP scaling Hinrichsen-AdvPhys2000 ; Henkel_etal-Book2008 . In contrast, our absorbing state, DSM1, is itself a fluctuating, turbulent state. Long-range interactions are then likely to be killed by the local turbulent fluctuations of DSM1, which may have led to the observation of clean DP critical behavior. It is noteworthy to remark that the Chaté-Manneville coupled map lattice Chate_Manneville-PhysD1988 , a deterministic numerical model for absorbing phase transitions with a non-chaotic (laminar) absorbing state, exhibits non-DP critical behavior probably due to soliton-like objects propagating through laminar regions. Interestingly, an elementary modification to render its absorbing state itself chaotic does lead to DP scaling Chate-unpublished .
In conclusion, we have experimentally found that the DSM1-DSM2 transition in the electroconvection of nematic liquid crystals, showing an absorbing transition into spatiotemporal intermittency, clearly belongs to the DP universality class. Both static and dynamic critical behavior has been investigated with the help of the newly developed experimental technique to create a seed of DSM2, confirming a total of 12 critical exponents, 5 scaling functions, 8 scaling relations, and in particular the rapidity symmetry, in full agreement with those characterizing the DP class in dimensions. We hope that this first clear and comprehensive experimental realization of a DP-class transition will trigger further studies of absorbing phase transitions and of related situations with genuinely non-equilibrium critical properties. In this respect the recent works of Corté et al. Corte_etal-NatPhys2008 and of Mangan et al. Mangan_etal-PRL2008 are especially encouraging, concerning experiments and realistic situations, respectively, for absorbing transitions with a conserved field.
Acknowledgements.
The authors are grateful to I. Dornic, F. Ginelli, J. A. Hoyos, S. Kai, and N. Oikawa for fruitful discussions. We would also like to thank M. Henkel and G. I. Menon for drawing our attention to ageing and Ref. Henkel_Peschanski-NuclPhysB1993 and to local persistence, respectively. This work is supported in part by Grant-in-Aid for Scientific Research (18068005) and for JSPS Fellows. *Appendix A Binarizing images
Every analysis presented in the paper is performed using binarized images, where DSM2 domains are distinguished from the absorbing DSM1 background. We give here a detailed description of the binarizing algorithm we used.
The binarization is carried out in the following manner: (a) We prepare three successive images taken at 15 frames per second, and remove the inhomogeneity of the incident light intensity. (b) We then normalize the obtained intensity of the three images with respect to mean and standard deviation of the DSM1 intensity at a given voltage, namely . Note that we can separately measure the intensity of the fully DSM1 state even above the threshold , since DSM1 always appears first when the voltage is applied. (c) Since DSM2 domains have lower transmittance than DSM1, we extract the regions where the normalized intensity is less than a certain threshold . Here we chose , determined so as to obtain a good agreement with direct visual observations, particularly in movies. (d) Taking into consideration that DSM2 domains move much slower than the local intensity fluctuations in DSM1 (recall that DSM1 is itself a turbulent state) and that the minimum DSM2 area is Kai_etal-JPSJ_PRL , where is the depth of the cell, we take the logical intersection (“AND” operator) of the three successive images, and then remove clusters with area smaller than . Clusters are screened out in this way, and their binarized images in the middle frame are used as final images. In other words, the intersection is used only for comparison with the minimum area. (e) Finally, we cut off the periphery of the image of width , since this region is biased in the step (d). The size of the binarized images reduces to , which roughly corresponds to effective degrees of freedom. We confirmed that the chosen threshold () works well all over the range of voltages we investigate, and that no DSM2 region is falsely detected when binarizing images of the fully DSM1 phase. Typical results of the binarization are shown in Fig. 1(c) and (e), and Movie S2 of Ref. EPAPS , where we can confirm that DSM2 domains are precisely detected.
For the critical-spreading experiments presented in Sec. V, we have slightly modified the binarization algorithm in order to detect DSM2 patches originating only from the prepared seed, and not to miss them. To this end, we have reduced the intensity threshold to , and instead, binarized only within a target region, defined from positions of DSM2 patches in previous images (position of the seed for the first image) and assumed maximal displacement of DSM2, which is chosen to be much larger than the actual displacement, namely, during successive two images taken at fps and extrapolated diffusively. We again confirmed that binarized images from a single set of parameters closely follow the actual evolution of DSM2 patches for all the voltages of interest. A typical result is shown in the inset of Fig. 11.
References
- (1) H. Hinrichsen, Adv. Phys. 49, 815 (2000).
- (2) M. Henkel, H. Hinrichsen, and S. Lübeck, Non-Equilibrium Phase Transitions, Volume I: Absorbing Phase Transitions (Springer, Dordrecht, 2008).
- (3) L. Baroni, R. Livi, and A. Torcini, Phys. Rev. E 63, 036226 (2001).
- (4) V. Ahlers and A. Pikovsky, Phys. Rev. Lett. 88, 254101 (2002).
- (5) R. Dickman, M. A. Muñoz, A. Vespignani, and S. Zapperi, Braz. J. Phys. 30, 27 (2000).
- (6) Y. Pomeau, Physica D 23, 3 (1986).
- (7) S. V. Buldyrev et al., Phys. Rev. A 45, R8313 (1992).
- (8) F. Ginelli et al., Phys. Rev. E 68, 065102(R) (2003).
- (9) H. K. Janssen, Z. Phys. B 42, 151 (1981).
- (10) P. Grassberger, Z. Phys. B 47, 365 (1982).
- (11) S. Ciliberto and P. Bigazzi, Phys. Rev. Lett. 60, 286 (1988).
- (12) F. Daviaud, M. Bonetti, and M. Dubois, Phys. Rev. A 42, 3388 (1990).
- (13) S. Michalland, M. Rabaud, and Y. Couder, Europhys. Lett. 22, 17 (1993).
- (14) H. Willaime, O. Cardoso, and P. Tabeling, Phys. Rev. E 48, 288 (1993).
- (15) M. M. Degen, I. Mutabazi, and C. D. Andereck, Phys. Rev. E 53, 3495 (1996).
- (16) P. W. Colovas and C. D. Andereck, Phys. Rev. E 55, 2736 (1997).
- (17) H. Téphany, J. Nahmias, and J. A. M. S. Duarte, Physica A 242, 57 (1997).
- (18) A. Daerr and S. Douady, Nature 399, 241 (1999).
- (19) A. Cros and P. Le Gal, Phys. Fluids 14, 3755 (2002).
- (20) P. Rupp, R. Richter, and I. Rehberg, Phys. Rev. E 67, 036209 (2003).
- (21) V. Lepiller, A. Prigent, F. Dumouchel, and I Mutabazi, Phys. Fluids 19, 054101 (2007).
- (22) C. Pirat, A. Naso, J. -L. Meunier, P. Maïssa, and C. Mathis, Phys. Rev. Lett. 94, 134502 (2005).
- (23) H. Hinrichsen, A. Jiménez-Dalmaroni, Y. Rozov, and E. Domany, Phys. Rev. Lett. 83, 4999 (1999).
- (24) I. Jensen, J. Phys. A: Math. Gen. 32, 5233 (1999).
- (25) P. Grassberger and Y. C. Zhang, Physica A 224, 169 (1996).
- (26) C. A. Voigt and R. M. Ziff, Phys. Rev. E 56, R6241 (1997).
- (27) Scaling relations used for and [Eq. (4)] may be slightly violated in the order of , due to some intermittency effects in DP Hede_etal-JSP1991 ; Henkel_Peschanski-NuclPhysB1993 .
- (28) B. Hede, J. Kertész, and T. Vicsek, J. Stat. Phys. 64, 829 (1991).
- (29) M. Henkel and R. Peschanski, Nucl. Phys. B 390, 637 (1993).
- (30) P. Grassberger, in Nonlinearities in Complex Systems, edited by S. Puri and S. Dattagupta (Narosa, New Delhi, 1997), p. 61.
- (31) K. A. Takeuchi, M. Kuroda, H. Chaté, and M. Sano, Phys. Rev. Lett. 99, 234503 (2007).
- (32) E. Dubois-Violette, P. G. de Gennes, and O. Parodi, J. Phys. (Paris) 32, 305 (1971).
- (33) P. G. de Gennes and J. Prost, The Physics of Liquid Crystals (Oxford Univ. Press, Oxford, ed. 2, 1993).
- (34) S. Kai, W. Zimmermann, M. Andoh, and N. Chizumi, J. Phys. Soc. Jpn. 58, 3449 (1989); Phys. Rev. Lett. 64, 1111 (1990).
- (35) J. Nehring, Phys. Rev. A 7, 1737 (1973). Note that topological defects observed there are obtained by switching off the applied voltage from DSM2. See also Ref. Kai_etal-JPSJ_PRL .
-
(36)
See EPAPS Document No. E-PRLTAO-99-056749 for Movies S1 and S2 (available from
Ref. Takeuchi_etal-PRL2007
). For more information on EPAPS, see
http://www.aip.org/pubservs/epaps.html. - (37) The deviation from criticality is measured in terms of instead of by convention, since the dielectric torque that drives the electroconvection is proportional to Dubois-Violette_etal-JPhysParis1971 ; deGennes_Prost-Book1993 . The results do not change if is used.
- (38) Confidence intervals of the critical exponents given in the present paper are determined as follows. (a) For values estimated from a finite number of independent data points [Eqs. (2) and (7)], confidence intervals in the sense of Student’s t are provided. (b) For values estimated from a continuous curve [Eqs. (3), (9), (14), (12), (19)], range of fitting is varied within reasonable regions, and both the dependence on fitting regions and the confidence interval from each fitting are incorporated in the final estimate of error. When the threshold is simultaneously determined [Eqs. (9) and (19)], uncertainty in the estimate of the threshold is also considered. (c) For values determined from data collapsing [Eq. (12)], we provide the range of values of the exponent with which no systematic shift in data collapsing is seen. (d) For values derived from an equation, the range of error is estimated by the law of propagation of error. (e) For values cited from literature, we simply borrow the range of errors provided by the corresponding authors.
- (39) G. Strangi et al., Phys. Rev. E 59, 5523 (1999).
- (40) T. Nagaya, T. Takeda, and H. Orihara, J. Phys. Soc. Jpn. 68, 3848 (1999).
- (41) This correction was not made in Ref. Takeuchi_etal-PRL2007 . Although algebraic decays in the distributions are not much influenced, this correction is significant to have exponential decays in sufficiently large scales to estimate the correlation length and time.
- (42) T. E. Harris, Ann. Prob. 2, 969 (1974).
- (43) Note that parallel and perpendicular directions ( and in our notation) in the second reference of Ref. Kai_etal-JPSJ_PRL are opposite.
- (44) M. Henkel, J. Phys.: Condens. Matter 19, 065101 (2007).
- (45) F. Baumann and A. Gambassi, J. Stat. Mech. 2007, P01002.
- (46) S. N. Majumdar, Curr. Sci. (India) 77, 370 (1999), and references therein.
- (47) H. Hinrichsen and H. M. Koduvely, Eur. Phys. J. B 5, 257 (1998).
- (48) E. V. Albano and M. A. Muñoz, Phys. Rev. E 63, 031104 (2001).
- (49) G. I. Menon, S. Sinha, and P. Ray, Europhys. Lett. 61, 27 (2003).
- (50) J. Fuchs, J. Schelter, F. Ginelli, and H. Hinrichsen, J. Stat. Mech. 2008, P04015.
- (51) P. Grassberger, arXiv:0907.4021 (2009).
- (52) K. A. Takeuchi, Phys. Rev. E 77, 030103(R) (2008).
- (53) M. Mizuno and T. Shinoda, Mol. Cryst. Liq. Cryst. 41, 155 (1978).
- (54) M. Mizuno and T. Shinoda, Mol. Cryst. Liq. Cryst. 69, 103 (1981).
- (55) J. Hooyberghs, F. Iglói, and C. Vanderzande, Phys. Rev. Lett. 90, 100601 (2003).
- (56) J. A. Hoyos, Phys. Rev. E 78, 032101 (2008).
- (57) T. Vojta and M. Dickison, Phys. Rev. E 72, 036126 (2005); T. Vojta, A. Farquhar, and J. Mast, ibid. 79, 011111 (2009).
- (58) C. J. Neugebauer, S. V. Fallert, and S. N. Taraskin, Phys. Rev. E 74, 040101(R) (2006); S. V. Fallert and S. N. Taraskin, ibid. 79, 042105 (2009).
- (59) H. Chaté and P. Manneville, Physica D 32, 409 (1988).
- (60) H. Chaté (unpublished).
- (61) L. Corté, P. M. Chaikin, J. P. Gollub, and D. J. Pine, Nat. Phys. 4, 420 (2008).
- (62) N. Mangan, C. Reichhardt, and C. J. Olson Reichhardt, Phys. Rev. Lett. 100, 187002 (2008).