BLAST Observations of Resolved Galaxies: Temperature Profiles and the Effect of AGN on FIR to Submillimeter Emission
Abstract
Over the course of two flights, the Balloon-borne Large Aperture Submillimeter Telescope (BLAST) made resolved maps of seven nearby ( Mpc) galaxies at 250, 350, and 500 µm. During its June 2005 flight from Sweden, BLAST observed a single nearby galaxy, NGC 4565. During the December 2006 flight from Antarctica, BLAST observed the nearby galaxies NGC 1097, NGC 1291, NGC 1365, NGC 1512, NGC 1566, and NGC 1808. We fit physical dust models to a combination of BLAST observations and other available data for the galaxies observed by Spitzer. We fit a modified blackbody to the remaining galaxies to obtain total dust mass and mean dust temperature. For the four galaxies with Spitzer data, we also produce maps and radial profiles of dust column density and temperature. We measure the fraction of BLAST detected flux originating from the central cores of these galaxies and use this to calculate a “core fraction,” an upper limit on the “AGN fraction” of these galaxies. We also find our resolved observations of these galaxies give a dust mass estimate 5–19 times larger than an unresolved observations would predict. Finally, we are able to use these data to derive a value for the dust mass absorption co-efficient of m2 kg-1 at 250 µm. This study is an introduction to future higher-resolution and higher-sensitivity studies to be conducted by Herschel and SCUBA-2.
I. Introduction
Much of the bolometric luminosity produced by entire galaxies is emitted as thermal radiation from dust grains in the interstellar medium (ISM) at temperatures of several tens of Kelvin. The heat source is predominantly optical and ultra-violet (UV) light from stars, as well as matter accretion onto an active galactic nucleus (AGN) in some objects. In either case, the spectrum of this light tends to peak in the range 60–200 µm. Since the launch of the Infrared Astronomical Satellite (IRAS) in 1983, observations at these wavelengths have been essential in a number of fields, ranging from the studies of the earliest stages of star-formation in dusty molecular clouds in our own Galaxy, to the detection of distant star-forming galaxies that emit most of their light in this previously unexploited band. Furthermore, excluding light from the Cosmic Microwave Background, it is known that approximately half of all of the light in the Universe is emitted at these wavelengths, the Cosmic Infrared Background (CIB) (Puget et al., 1996; Fixsen et al., 1998, see also Devlin et al. 2009).
Observations from the ground are impossible at wavelengths in the range 60–200 µm, the far infrared (FIR) band, due primarily to the absorption and emission from atmospheric water vapor. Therefore, most of the progress at these wavelengths since IRAS has also been undertaken by satellites: the Infrared Space Observatory (ISO), the Spitzer Space Telescope, and the Akari Space Telescope. However, the lack of data at longer wavelengths can bias the interpretation of these results toward the assumption of warmer dust temperatures, resulting in underestimates of luminosity and mass. At slightly longer wavelengths, 350–1000 µm, the submillimeter band, several spectral windows are available from dry, high-altitude sites such as Mauna Kea or the Atacama Desert. In particular, studies at 850 µm with SCUBA (e.g. Smail et al., 1997; Hughes et al., 1998; Holland et al., 1999; Eales et al., 2000; Dunne & Eales, 2001; Scott et al., 2002; Mortier et al., 2005; Stevens et al., 2005; Nutter & Ward-Thompson, 2007) have been used to detect very cool dust, both in our Galaxy, and in more distant galaxies. Typically in these surveys a dust temperature must be assumed in order to estimate redshifts and luminosities, because data are available only at a single wavelength. Therefore the combination of ground-based submillimeter observations with space-based FIR measurements has been required to assess the bolometric luminosities and apparent dust temperatures of everything from individual pre-stellar objects, up to entire galaxies at redshifts . However, the general lack of high signal-to-noise data in the crucial wavelength range 200–500 µm results in large uncertainties in these quantities.
In this paper we present results from a study at 250, 350, and 500 µm of several nearby galaxies using the 2-m Balloon-borne Large Aperture Submillimeter Telescope (BLAST). BLAST was built to fill the wavelength gap between ground-based submillimeter and space-based FIR instrumentation, using a prototype of the SPIRE camera for Herschel (Griffin et al., 2007).
In June 2005, BLAST was launched from Esrange, Sweden, for it’s first scientific flight, hereafter BLAST05. It acquired data for 100 hours before landing on Victoria Island, Canada. During this flight, BLAST observed the nearby galaxy NGC 4565. In December 2006, BLAST conducted its second science flight, BLAST06, carrying out 250 hours of observations above Antarctica. Six nearby galaxies were observed during BLAST06: NGC 1097, NGC 1291, NGC 1365, NGC 1512, NGC 1566, and NGC 1808.
All these galaxies are resolved by BLAST. The full widths at half-maximum (FWHM) of the BLAST06 beams are 36, 42, and 60 ″ at 250, 350, and 500 µm respectively. The BLAST05 flight suffered from degradation of the warm optics (Truch et al., 2008). The single galaxy in our sample from BLAST05 is nevertheless resolved, despite the large, non-Gaussian point spread functions due to the degraded optics during this flight. We are therefore able to map the temperature and luminosity distributions, and hence dust column density, with greater signal-to-noise ratio (SNR) than any existing work. Our study can be considered a precursor to The Herschel Reference Survey (Boselli et al., 2008) and the JCMT Nearby Galaxies Legacy Survey (Wilson et al., 2009) that will be undertaken by Herschel and SCUBA-2, respectively. A complete description of the BLAST instrument is given in Pascale et al. (2008).
The known correlation between SED shape and luminosity in IRAS galaxies (e.g. Soifer & Neugebauer, 1991) means good measurements of these quantities for rest-frame galaxies are required to put proper constraints on high-redshift FIR source count models (e.g. Chapin et al., in prep.). BLAST samples the Rayleigh-Jeans side of thermal emission from local galaxies; when combined with FIR measurements from other instruments, the dust thermal emission peak is bracketed, allowing robust determination of these quantities.
Resolved studies of galaxies are required to better model galactic structure and dynamics. The unprecedented ability of BLAST to make high resolution maps on large angular scales in the submillimeter band provides the best opportunity to-date to study the structure of diffuse dust in nearby galaxies. To properly estimate star formation rates from submillimeter fluxes of unresolved, high redshift galaxies, an understanding of the fraction of submillimeter flux originating from AGN-driven dust heating is required. Although BLAST is unable to distinguish AGN-driven dust heating from nuclear starburst driven heating, and this study involves nearby spirals, rather than high-redshift starbursts, we are still able to put limits on this AGN fraction by comparing flux measured from the core of these resolved galaxies with their total integrated flux. Furthermore, because BLAST can make high-fidelity large-area maps, it is able to measure the complete emission from these spatially extended galaxies.
II. Data Reduction
The common data reduction pipeline for BLAST has been presented in Truch et al. (2008) and Patanchon et al. (2008). Maps used in this analysis for NGC 4565 were made using the maximum-likelihood map maker sanepic (Patanchon et al., 2008) which was written explicitly for BLAST analysis.
Maps of BLAST observations of the remaining galaxies were produced using almagest (Wiebe, 2008), an iterative, maximum-likelihood map maker also written for BLAST analysis, and algorithmically similar to other iterative map makers used in CMB analysis (e.g. Prunet et al. 2000). Because most of these galaxies were observed only at a single scan direction, and hence lack cross-linking, the maps produced are artificially constrained to zero flux far from the observed galaxy to improve convergence properties of the iterative algorithm (see §3.8 of Patanchon et al. 2008). In relatively high SNR cases, such as these galaxy maps, almagest output is consistent with maps made with sanepic (Wiebe, 2008), but may be produced faster, and allow arbitrary constraints to be applied simply.
III. Observations
III.1. BLAST Observations
The seven nearby galaxies observed by BLAST were selected based on a number of competing criteria. First, the visibility requirements were restrictive, as they took into account BLAST’s limited elevation range (25∘–60∘), Sun and Moon avoidance criteria, and still had to make allowance for the changing latitude and longitude of the telescope arising from BLAST’s uncertain ground path while aloft. Second, the galaxies had to be sufficiently large to be resolved by BLAST’s optics (e.g. BLAST’s 36″ beam size at 250 µm corresponds to 2.5 kpc at the average distance of 14 Mpc for this galaxy sample). Third, they had to be sufficiently luminous for BLAST to be able to map them with a high SNR in the relatively small fraction of the flights scheduled for these observations. Finally, the sample needed to have measurements from the Infrared Astronomical Satellite (IRAS), the Spitzer Space Telescope, the Submillimeter Common-User Bolometer Array (SCUBA), or other experiments complementary to BLAST.
Table 1 summarizes relevant physical parameters of the BLAST nearby galaxy sample.111Instructions for obtaining BLAST maps used in this analysis may be found on http://blastexperiment.info/. The measured total flux density in each BLAST band is tabulated in Table 2.
III.2. Other Multiwavelength Data
As part of the Spitzer Infrared Nearby Galaxies Survey (SINGS; Kennicutt et al., 2003), four of our sample (NGC 1097, NGC 1291, NGC 1512, and NGC 1566, hereafter BLAST/SINGS galaxies), have also been observed by the Multiband Imaging Photometer for Spitzer (MIPS) at 160 µm, 70 µm, and 24 µm (Rieke et al., 2004) and the Infrared Array Camera (IRAC) at 8 µm, 6 µm, 4.5 µm, and 3.6 µm (Fazio et al., 2004), both on the Spitzer Space Telescope. The remaining galaxies in our sample were not observed by Spitzer. Spatially integrated Spitzer fluxes are taken from Dale et al. (2007), and MIPS maps used in this analysis come from the fifth SINGS public data release.222obtained from http://data.spitzer.caltech.edu/popular/ sings/
IRAS data for all of our sample except NGC 1291 have been extracted from SCANPI.333available at http://scanpi.ipac.caltech.edu:9000/ applications/Scanpi/index.html IRAS data for the fainter and more extended NGC 1291 are measured from HIRES generated maps (Aumann et al., 1990). These IRAS data are used, in addition to Spitzer, to constrain the spatially integrated SEDs of these galaxies. A 20% uncorrelated uncertainty is applied to all IRAS data. IRAS 25 µm data are not used in this analysis when equivalent MIPS 24 µm data are available.
Two of our sample have been observed by SCUBA: NGC 1097 at 850 µm (Dale et al., 2005), and NGC 1808 at both 450 and 850 µm (Stevens et al., 2005). These measurements do not cover the entire region of emission detected by BLAST and we omit these measurements from our fits for this reason.
For NGC 1808, we calculate aperture corrections for the Stevens et al. (2005) reported flux densities. We apply the Stevens et al. apertures to the BLAST observations and compare the 500 µm flux inside these apertures to the total 500 µm flux. From this, we calculate flux densities for NGC 1808 of and by applying the aperture corrections to the SCUBA measurements. These values are consistent with our modified blackbody model fit to BLAST plus 100 µm IRAS (§ IV.3). The aperture-corrected SCUBA measurements are plotted in Fig. 8, along with the model fit.
We also exclude data from the Infrared Space Observatory (ISO) for NGC 1365 and NGC 4565, again because of aperture effects.
III.3. Individual Galaxies
A brief description of each observed galaxy follows.
III.3.1 NGC 1097
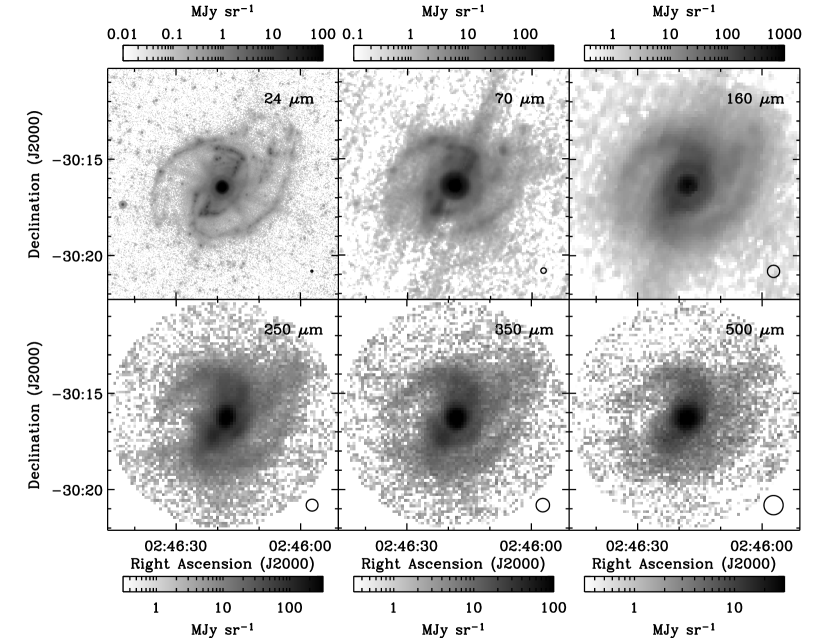
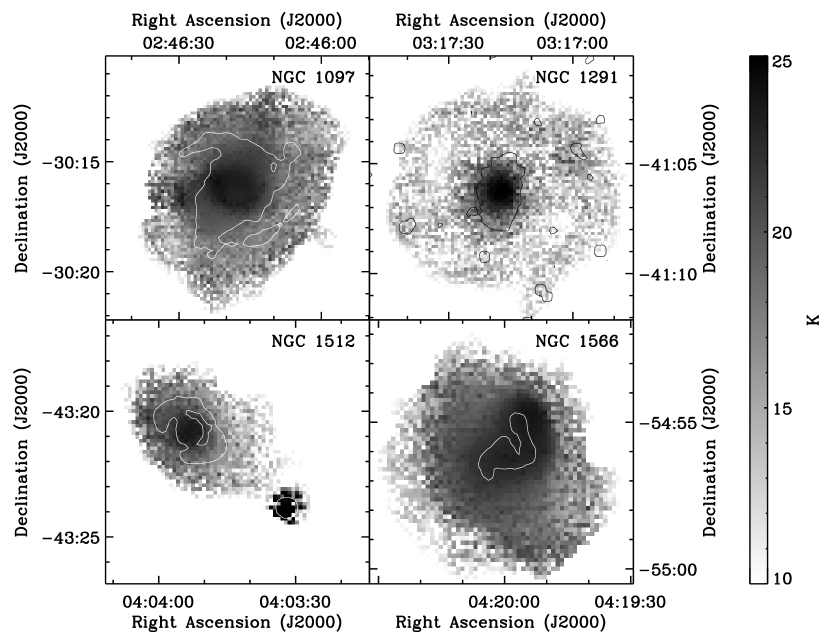
Features of NGC 1097, presented in Fig. 1, include a bar 20 kpc in length that tapers off into two spiral arms (Beck et al., 2005), as well as several fringe structures called jets or ‘rays’ (Wolstencroft & Zealey, 1975; Lorre, 1978). NGC 1097 has an active Seyfert 1/LINER nucleus, which is considered to have a low luminosity (Mason et al., 2007), and is surrounded by a 1.5 kpc diameter nuclear ring, containing M⊙ of molecular gas (Hsieh et al., 2008; Gerin et al., 1988). Thermal dust heating in the nuclear ring is dominated by a starburst (Mason et al., 2007) with a stellar production rate of 5 M⊙ yr-1 (Hummel et al., 1987). BLAST made two observations of a 0.25 deg2 area centered on NGC 1097, with a total integration time of 52 minutes. BLAST clearly resolves the bar and spiral arms of the galaxy, but has insufficient resolution to resolve the 1.5 kpc star forming ring.
III.3.2 NGC 1291
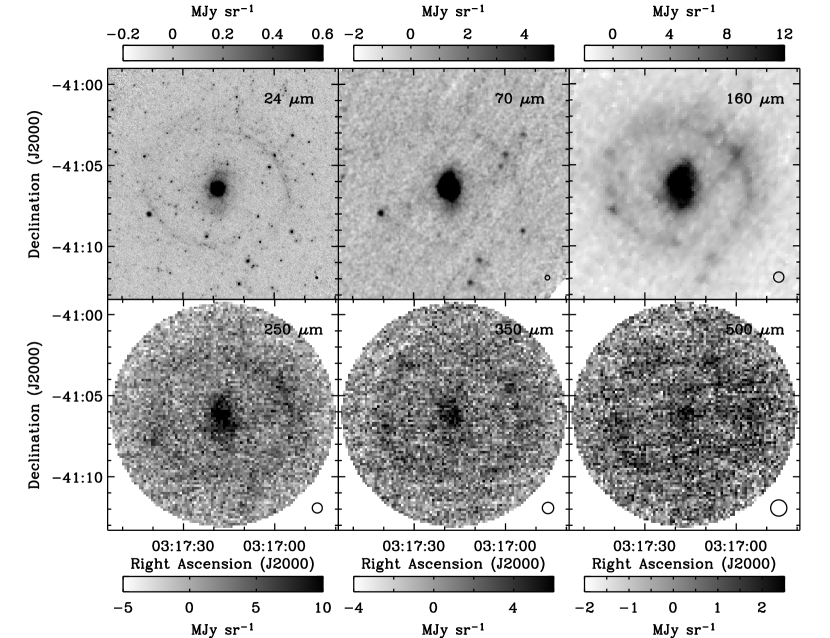
NGC 1291, presented in Fig. 2, is the brightest Sa galaxy in the Shapley-Ames Catalogue (Bregman et al., 1995). NGC 1291 has an orientation that is almost ‘face on’ and has a primary bar and secondary bar that have a 30∘ misalignment with each other (Pérez & Freeman, 2006). The total H I mass is M⊙, and there is little evidence for star formation in the central bulge (Hogg et al., 2001). BLAST made four observations of a 0.4 deg2 area centered on NGC 1291, with a total integration time of 92 minutes. Although diffuse, BLAST detects both the central core of the galaxy, as well as the ring-like spiral structure 4′ from the core.
III.3.3 NGC 1365
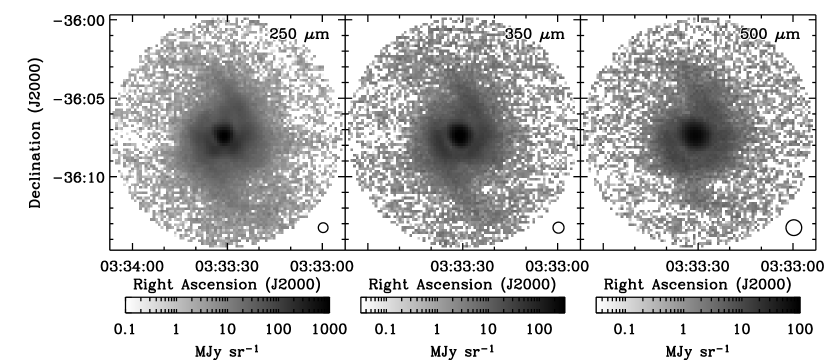
NGC 1365, presented in Fig. 3, is is usually classified as a Seyfert 1.5, but some authors list it as Seyfert 1 or Seyfert 2 (e.g., Galliano et al., 2005; Véron et al., 1980; Alloin et al., 1981). The AGN has low luminosity, but there is evidence from optical studies to suggest that there is star formation surrounding the nucleus (Komossa & Schulz, 1998). BLAST made three observations of a 0.25 deg2 area centered on NGC 1365, with a total integration time of 30 minutes. The brightest of our sample, BLAST’s observations prominently show both the bar and spiral arm structure of the galaxy.
III.3.4 NGC 1512
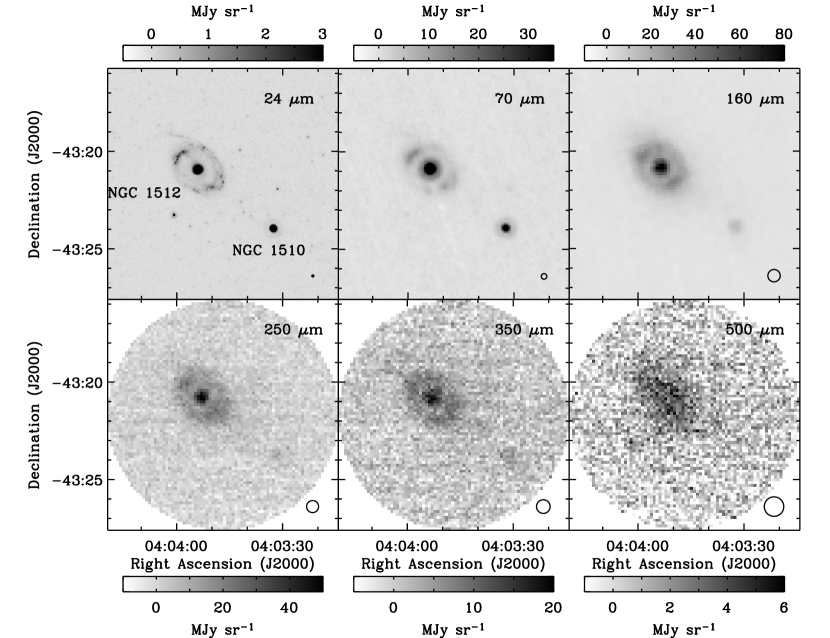
NGC 1512, presented in Fig. 4, has a nucleus surrounded by a circumnuclear ring (Maoz et al., 2000). Beyond the ring, its spiral arms are complicated by its satellite galaxy, NGC 1510 (Kinman, 1978). BLAST made three observations of a 0.45 deg2 area centered on NGC 1512, with a total integration time of 28 minutes. BLAST detects the core and tightly wound central spiral of NGC 1512. BLAST also detects the companion galaxy, NGC 1510.
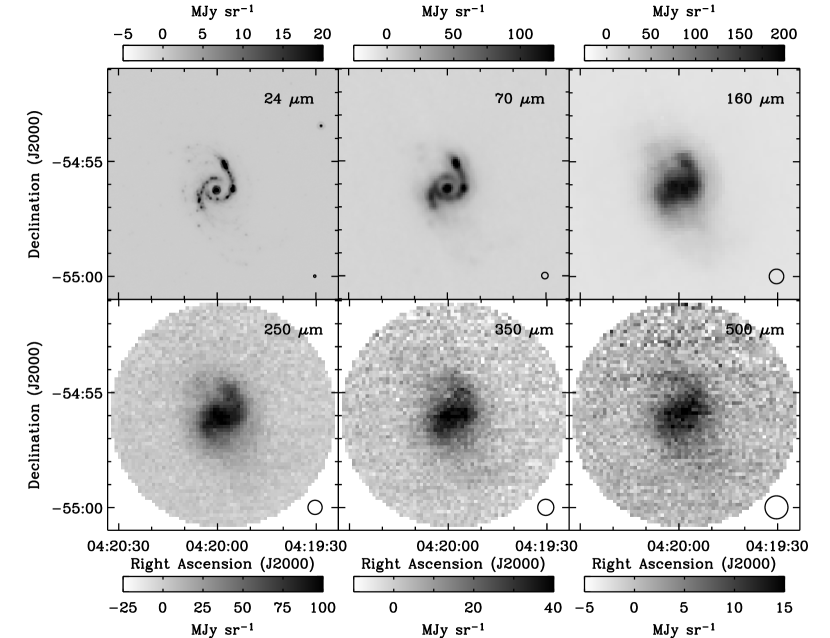
III.3.5 NGC 1566
NGC 1566, presented in Fig. 5, is the second brightest known Seyfert galaxy (de Vaucouleurs, 1973). Extending from the nucleus are two prominent spiral arms which continue outward to form the galaxy’s outer ring that is at an inclination of about 30° (de Vaucouleurs, 1975; Bottema, 1992). The arms contain a significant amount of star formation (Bottema, 1992). BLAST made two observations of a 0.7 deg2 area centered on NGC 1566, with a total integration time of 50 minutes. BLAST resolves the spiral structure of the galaxy, and the observations are dominated by submillimeter flux originating in the core of the galaxy.
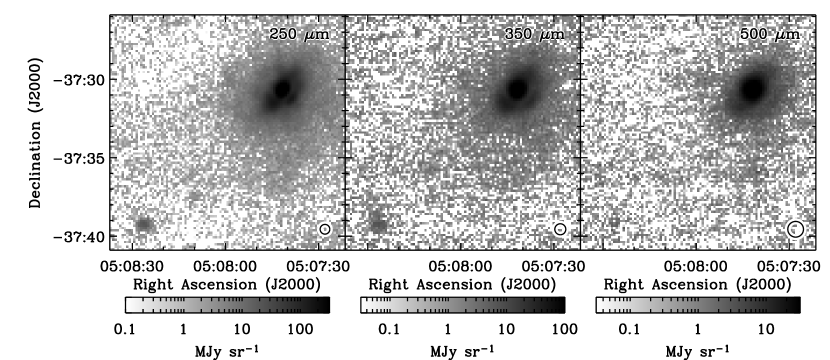
III.3.6 NGC 1808
NGC 1808, presented in Fig. 6, is a Seyfert 2 galaxy (Jiménez-Bailón et al., 2005). Subsequent measurement seems to indicate that a large part of the radiation emanating from the central 1 kpc of the galaxy is from an active galactic nucleus as well as a high rate of star formation (Förster Schreiber et al., 2003; Maiolino et al., 2003). Using ROSAT, Junkes et al. (1995) estimate a star formation rate of between 5 and 13 M⊙ yr-1, and a supernova event rate of 0.09 yr-1. A companion galaxy, not observed by BLAST, NGC 1792 is located 40′ from NGC 1808 (130 kpc at a distance of 10.9 Mpc) and may be responsible for an accelerated star formation rate in NGC 1808 (Jiménez-Bailón et al., 2005). BLAST made four observations of a 1 deg2 area centered on NGC 1808, with a total integration time of 179 minutes. BLAST detects both the core and disk of the galaxy. BLAST also detects excess flux in this map near the location of the interacting galaxies ESO 305-IG 010 (, , ).
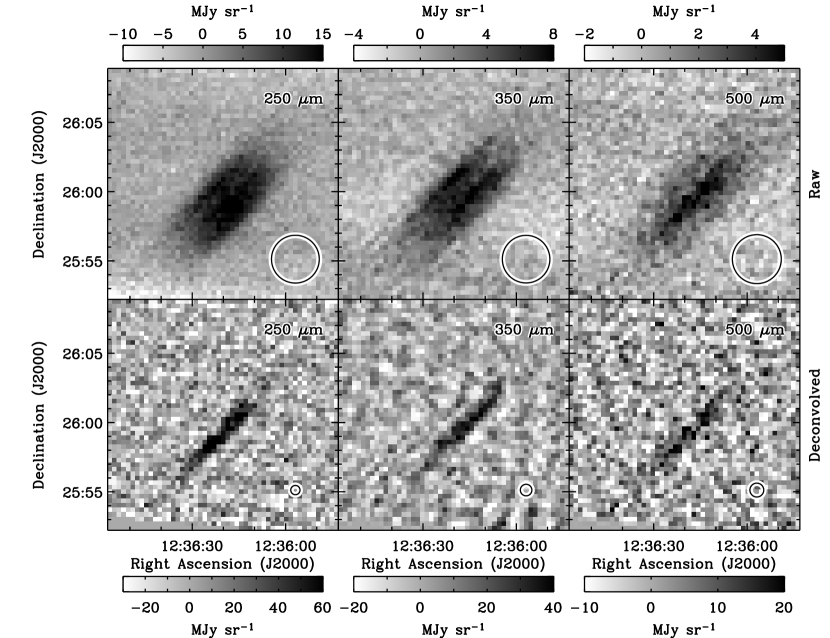
III.3.7 NGC 4565
NGC 4565, presented in Fig. 7, is an edge-on barred-spiral galaxy in the constellation Coma Berenices. It has an apparent size of about 12′ 25. Although degraded by the large point-spread functions of BLAST05 (186–189″, Truch et al., 2008), NGC 4565 is still resolved by BLAST. BLAST made one observation of a 0.4 deg2 area centered on NGC 4565, with a total integration time of 49 minutes. A beam-deconvolved image, using the method described in §2.4 of Chapin et al. (2008), is shown in the bottom row of Fig. 7.
We fit an exponential profile to the beam-deconvolved maps of the form , where is a spatial variable aligned along the major axis of the galactic disk and is the scale length, and find that ″, 156″, and 142″ at 250 µm, 350 µm, and 500 µm, respectively. The 250 µm fit, which has the highest signal-to-noise ratio, agrees well with scale lengths measured at other wavelengths (e.g., van der Kruit & Searle, 1981; Engargiola & Harper, 1992; Rice et al., 1996). In this fit we have ignored the central 3′ region of the galaxy. This region corresponds to an area of reduced 250 µm flux density, possibly corresponding to the molecular ring seen in 12CO (Neininger et al., 1996).
IV. SED Fitting
IV.1. Physical Dust Models
For the four BLAST/SINGS galaxies, we fit the silicate-graphite-PAH dust models of Draine & Li (2007), hereafter DL07, to BLAST, MIPS, IRAS, and IRAC data. These models have already been applied, without the benefit of BLAST observations, to the same galaxies in Draine et al. (2007), hereafter Dr07. We independently recreate this analysis with the inclusion of the BLAST data. These models provide the dust emissivity per hydrogen atom, , dependent on three model parameters:
-
1.
, the fraction of total dust mass in polycyclic aromatic hydrocarbons (PAHs) containing less than carbon atoms;
-
2.
, a starlight intensity factor characterizing the radiation field heating the diffuse ISM;
-
3.
, a starlight intensity factor characterizing the radiation field in more intense star forming regions, including photodissociative regions (PDRs).
Both and are relative to the specific energy density of starlight measured by Mathis et al. (1983). Dr07 consider a fourth model parameter, , which is the exponent characterizing the power-law decrease in starlight intensity: . They find the model fits to be insensitive to its value, and the models provided have .
Our fitting procedure follows that of Dr07. We restrict ourselves to the seven Milky Way dust model sets444obtained from http://www.astro.princeton.edu/draine/ dust/dust.html (Weingartner & Draine 2001, updated by DL07). These seven model sets have values of between % and %. We take linear combinations of these to produce 43 different model sets for a finer-grained sampling of . Each set contains values of for twenty-two values of between 0.1 and 25, and for five “PDR models” with values of (, , , , ), plus one “diffuse ISM model” with .
These dust models are combined with a stellar blackbody to produce a galactic model:
| (1) |
where is the solid angle subtended by stars, is the Planck function, the nominal stellar temperature K, is the total dust mass, the mass of a hydrogen atom, the distance to the galaxy, and a mixing fraction between the diffuse ISM () and PDR () dust models. The hydrogen-to-dust mass ratio, , is set by the model choice, and varies from 96 to 100.
Like Dr07, we find that the best fits for the four galaxies are insensitive to the choice of , and so set . We obtain the best-fit values of , , , , and through minimization (see § IV.5).
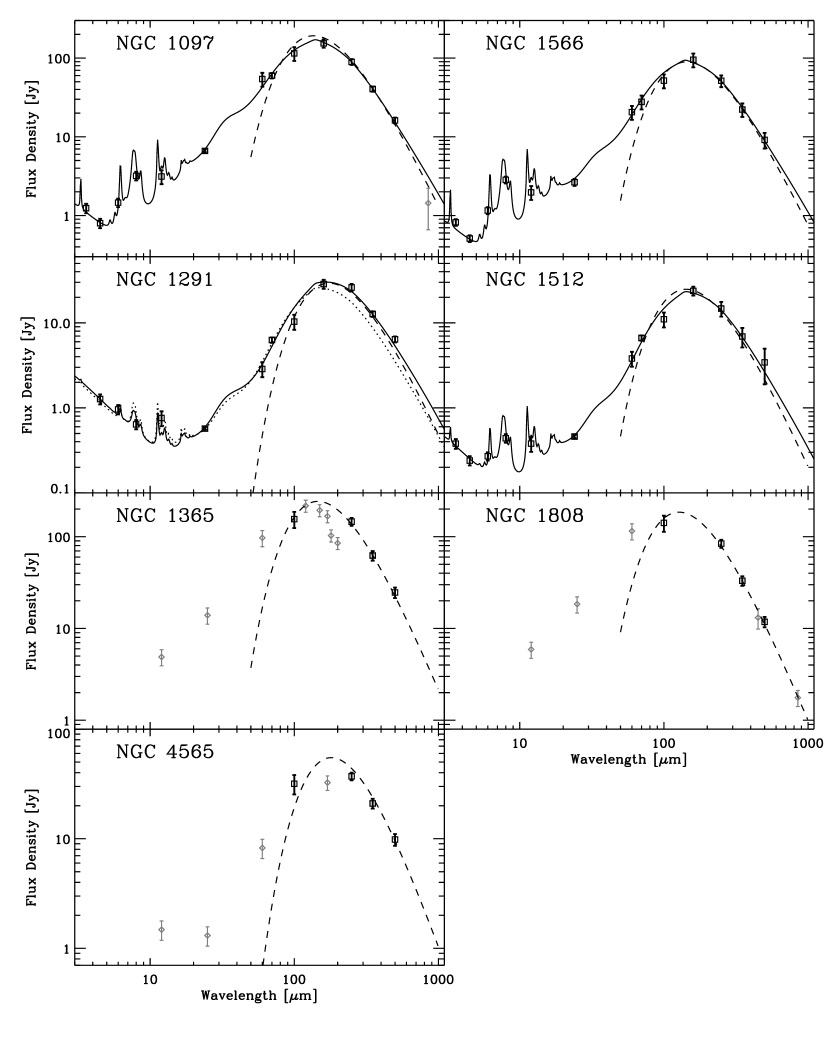
The best-fit models for the galaxies to the extended Spitzer-IRAS-BLAST data set are plotted in Fig. 8. This figure also plots the spatially integrated Spitzer and IRAS, BLAST, and SCUBA measurements for these galaxies.
The model parameters are tabulated in Table 3. We also tabulate the dust-weighted mean starlight intensity scale factor
| (2) |
and the dust luminosity calculated from the model fit.
IV.2. Modified Blackbody SEDs
In addition to the DL07 models, we also fit BLAST plus available MIPS 70 and 160 µm and IRAS 100 µm data to a single-component modified blackbody SED:
| (3) |
where the dust emissivity index, , is fixed to 2, and to 1.2 THz250 µm. An uncertainty of Mpc is assumed for all galaxy distances. This simplified SED model is needed in the absence of Spitzer data, where the DL07 models are insufficiently constrained. We also use this model in our subgalactic SED fits (§ IV.4) due to its computational simplicity.
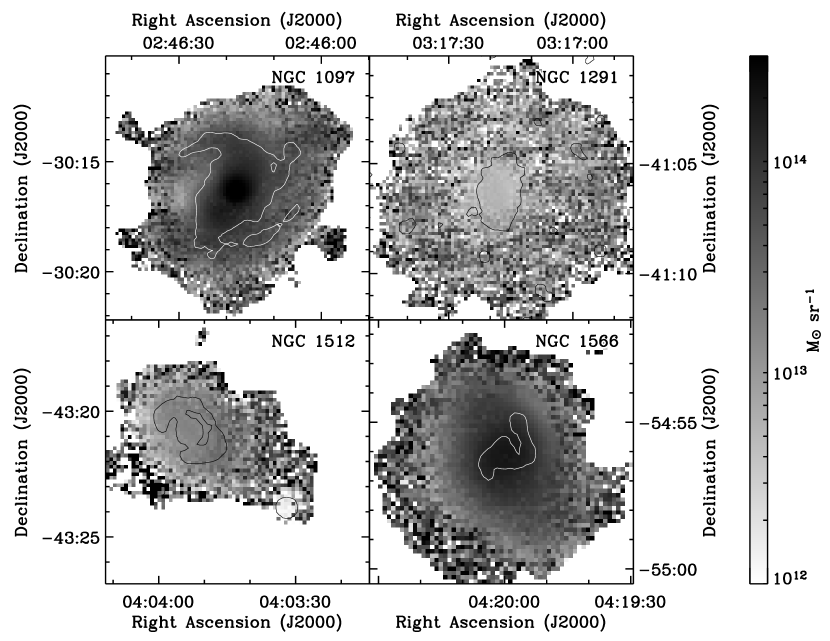
The dust mass absorption co-efficient at , , is not well determined, and depends on the object investigated (see Netterfield et al. 2009 for a discussion). For each BLAST/SINGS galaxy, we calculate a value for by comparing the DL07 fit to the fit found for the spatially integrated modified blackbody SED (§ IV.3). The values of for each galaxy are summarized in Table 3. These values are used in the calculation of the column density maps presented in Fig. 10. For the galaxies without Spitzer observations, we use the mean value, m2 kg-1, to calculate dust mass from the modified blackbody fits. Assuming a evolution, this corresponds to m2 kg-1, smaller than the m2 kg-1 value calculated by James et al. (2002). It is also lower than the 250 µm values of Draine & Lee (1984) and Casey (1991).
For each fit, a brute-force grid search is performed to simultaneously fit and to the data. The temperature, , is sampled at 1000 uniformly-spaced points between 5 K and 30 K. This range was determined by first letting temperatures vary over a much wider range (1 K–100 K) and then discarding those portions of the parameter space discovered to be irrelevant to the fitting procedure. Because the dust mass, , may vary by several orders of magnitude, the sampling limits for the dust mass are automatically adjusted as necessary for the fit, and sampled uniformly at 1000 points. As with the DL07 models, goodness-of-fit is assessed using a test (§ IV.5). The marginalized likelihood is used to determine medians and 68% confidence intervals for the two fit parameters.
IV.3. Spatially Integrated SED Fits
For the three galaxies without Spitzer data, we fit Equation 3 to BLAST plus IRAS 100 µm. The IRAS and BLAST measurements used to constrain the fits, and the results from these fits are presented in Fig. 8, which also plots additional data from IRAS, ISO and SCUBA, not used in this analysis.
For the four BLAST/SINGS galaxies, we also fit Equation 3 to BLAST, plus 160, 100, and 70 µm data from MIPS or IRAS, to compare with the results of the DL07 models. These fits are plotted in Fig. 8 as dashed curves. We note reasonably good agreement between the two models for all galaxies near the thermal peak. On the Wien side of the peak, as expected, the single-component modified blackbody quickly falls off in comparison to the DL07 model fit. On the Raleigh-Jeans side, due to the adoption of an emissivity index , the modified blackbody also falls off faster than the DL07 model fit. For NGC 1097 and NGC 1291, the modified blackbody fit underpredicts the 500 µm flux density by more than 1-.
Dust temperatures from these fits for all galaxies in the sample are listed in Table 2, as are dust masses for the three galaxies without Spitzer observations.
IV.4. Subgalactic SED Fits
Because the MIPS beams at 70 µm and 160 µm are of comparable size to the BLAST beams, we also investigate the dust properties on sub-galactic scales for the four BLAST/SINGS galaxies. To do this, the BLAST maps produced for the four galaxies were made on the same 9″ pixel grid as the MIPS 160 µm maps. The 70 µm MIPS images, which have a compatibly aligned 45 pixel grid, are rebinned to 9″ to put them on the same grid. All five maps are then convolved (smoothed) to the resolution of the 500 µm data (60″) and our modified blackbody template (Equation 3) is fit to the data at each pixel in the map.
The central twelve pixels of NGC 1097 have 70 µm surface brightness in excess of 200 MJy sr-1. For these twelve pixels, the 70 µm data are excluded, due to possible non-linearities,555http://data.spitzer.caltech.edu/popular/sings/ 20070410_enhanced_v1/Documents/sings_fifth_delivery_v2.pdf and the model is fit to four photometric points only.
Resultant temperature and column density maps for the four galaxies are presented in Figs. 9 and 10. NGC 1510, the companion galaxy to NGC 1512, appears quite prominently in these maps as seemingly hotter (25 K) than NGC 1512. This is not believed to be a real effect, and is likely due to poor performance by the fitting routine on the data for NGC 1510, for which is probably not an appropriate choice.
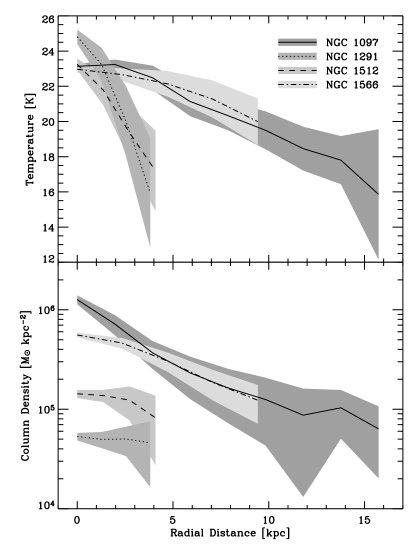
Radially-averaged temperature and column density profiles are plotted in Fig. 11. We note a general decrease in both column density and dust temperature with increasing radius. Of the four galaxies, we notice two subgroups of two galaxies each. The brighter NGC 1097 and NGC 1566, for which BLAST detects high intensity emission continuously from the core to disk of the galaxy, have relatively flat temperature profiles. NGC 1291 and NGC 1512, which BLAST detects with a more isolated core, fall off more steeply. We also potentially detect the 1.5 kpc star-forming ring in NGC 1097, which causes the kink in the temperature profile.
IV.5. Calculation
We use minimization to assess goodness of fit for both the DL07 models and the modified blackbody model. The BLAST calibration uncertainties are highly correlated between observational bands (Truch et al., 2008, 2009). Given observational data, , and band-convolved model predictions, , we compute
| (4) |
where is the inverse data covariance matrix, and denotes the transpose. Given the calibration uncertainty correlation matrix, , the data covariance matrix is:
| (5) |
where is the measurement uncertainty, the calibration uncertainty, and an uncertainty associated with the model. For the DL07 models, in order to compare with their results, we follow Dr07 and adopt . For the modified blackbody model, we use . We assume that IRAS and Spitzer uncertainties are uncorrelated between bands, and set for non-BLAST measurements.
For the BLAST measurements, we set to the value of the Pearson correlation matrices computed as outlined in Truch et al. (2008, 2009). For both the calibration uncertainty () and the calibration uncertainty correlation matrix (), we add to the values given in those papers an additional source of uncertainty associated with our ability to measure the BLAST band passes. We estimate the error in the bandpass measurements to be at most 5%. We additionally assume that this uncertainty is uncorrelated between bands.
The magnitude of the effect of bandpass measurement error on the BLAST calibration uncertainties depends on the spectrum of the object observed. A source with the same spectrum as our calibrators (e.g., for BLAST06, VY Canis Majoris, for which Truch et al. (2009) find a best-fit single-component modified blackbody with K and ) is unaffected by bandpass errors, but for a source with a significantly different spectrum, the effect can be non-negligible, especially in the high SNR case. This is the case in this study, and we have adjusted our calibration uncertainties accordingly.
Because the underlying spectrum of the galaxies is unknown, we use the modified blackbody model as a proxy. The calculated calibration uncertainties affect the best fit of the model, so this is an iterative process: we first fit the model using a guess for the calibration uncertainties, and then update the uncertainties based on the best fit. This process is iterated until convergence is achieved. In general only one iteration after the initial guess is required for convergence.
For this procedure, we have calculated calibration uncertainties and uncertainty correlations for various modified blackbody models with temperatures in the range 15–25 K. The resulting calibration uncertainties vary most with choice of model at 250 µm (12–14% for BLAST06), with smaller variations at 350 µm (10.0–10.5%) and 500 µm (8.00–8.25%). The uncertainty correlations calculated show similar behavior, varying between 0.80 and 0.97 for the 250–350 µm correlation but only 0.91–0.92 for the 350–500 µm correlation.
When reporting goodness of fit, we report per degree of freedom:
| (6) |
where is the number of observational bands considered in the fit, and the number of model parameters (five for the DL07 models and two for the modified blackbody model). The number of bands ranges from four (3 BLAST + 100 µm IRAS) for modified blackbody fits in the absence of Spitzer data, to thirteen (4 IRAC, 3 IRAS, 3 MIPS, 3 BLAST) when fitting the DL07 models.
V. Discussion
V.1. Dust Models
Of the four galaxies observed by both BLAST and Spitzer, the DL07 fits we find for all but NGC 1291 are consistent with the best-fit models determined without BLAST data in Dr07. For NGC 1291 we find a dust mass approximately two times larger than Dr07. This discrepancy is due to the restriction imposed by Dr07 in the absence of SCUBA data. We fore-go this restriction for our fit of NGC 1291, and find a best-fit . Constraining results in a fit consistent with that of Dr07 (=2.8%, =0.7, log(/)=7.36, %), but a poor fit to BLAST data (). This fit is plotted in Fig. 8 for comparison.
V.2. Fraction of Core to Total Emission
BLAST’s unique ability to spatially resolve the submillimeter flux of these nearby galaxies allows us to investigate the fraction of submillimeter flux which arises from the extended disks compared to their central core and circumnuclear regions. Although BLAST’s resolution is insufficient to resolve the central AGN of these galaxies (where present), we can still put limits on the contribution made to the submillimeter flux by the nuclear accretion and star formation activity towards their circumnuclear regions (typically within a few kpc of the nucleus).
For each galaxy, except the edge-on NGC 4565, we find the 3 db radial flux contour (that is, the radius at which the radially averaged flux has dropped to half of the peak flux) at 250 µm and use this radius to define the core of the galaxy. Fluxes in all three BLAST bands from this core region are presented in Table 4. Also in this table is the “core fraction,” the fraction of the total BLAST measured flux which originates in the core of the galaxy.
Most of the sample have core fractions in the range 7.5% to 15%. NGC 1566 is a clear outlier, with roughly one third of the submillimeter flux in the core of the galaxy. The second brightest known Seyfert galaxy (de Vaucouleurs, 1973), NGC 1566, has a core whose submillimeter flux originates largely from the AGN. The galaxy with the smallest core fraction is NGC 1291, a galaxy with no known active nucleus. Other than in NGC 1566, the bulk of the submillimeter emission in the core of the galaxy could be explained by nuclear star formation.
All galaxies show a decrease in core fraction with increasing wavelength, a result of the core dust temperature being generally warmer than the dust in the surrounding disk (see Fig. 11). Other than NGC 1566, most galaxies have weak or no AGN, although BLAST is unable to separate AGN derived flux from star formation in the central regions of the galaxies. In the case of NGC 1097, the unresolved 18″ circumnuclear starburst ring (e.g., Hummel et al., 1987; Barth et al., 1995; Quillen et al., 1995; Kotilainen et al., 2000), likely provides a sizable contribution to the total core flux.
BLAST’s ability to measure the compact to extended flux ratio of these galaxies is a result of BLAST’s high sensitivity and resolution. This indicates that current and future, higher-sensitivity and higher-resolution FIR and submillimeter experiments, such as Herschel, SCUBA-2, SPICA, JWST, ALMA, LMT, and GBT, which will be able to spatially separate non-thermal components from extended star formation emission, are important for understanding the relationship between FIR-submillimeter luminosity and star formation rates in both local and high-redshift galaxies.
V.3. Comparison of Resolved and Unresolved Mass and Luminosity Estimates
Our resolved measurements of the mass distribution in these galaxies allow us to investigate how mass estimates may be affected in more distant and smaller galaxies that are unresolved. For the four galaxies for which we have dust column density maps (Fig. 10), we apply the same aperture used to calculate our total flux measurements to the column density maps. The masses contained in these apertures, along with the aperture diameters, are listed in Table 5.
In all cases, the resolved mass estimate is significantly higher than the mass estimate obtained by the DL07 fit to the unresolved total flux from the galaxy. The ratio of resolved to unresolved mass estimates ranges from 5, for NGC 1566, to 19, for NGC 1291. Furthermore, the mass ratio follows the behavior of the radial temperature profile (Fig. 11), with a larger temperature gradient corresponding to a larger mass ratio. This effect is independent of the choice of , since both our resolved and unresolved mass estimates use the same to derive dust mass from the SED fit.
As a check, we performed a similar analysis to measure the difference between resolved and unresolved luminosity estimates. Using the same aperture, we summed the 60–1000 µm luminosity in the resolved maps, and compared this to the 60–1000 µm found from the modified blackbody fit to the galaxy as a whole. As expected, these values agree with one another to within measurement uncertainty.
Clearly, while luminosity, and hence star-formation rate, is unaffected by resolution, accurate dust mass measurements rely on resolved observations. Since luminosity, and therefore observed flux density, is a strong function of temperature, there is a potential for unresolved observations of galaxies to hide cool dust. For the four galaxies we investigate, a disproportionate fraction of their total SEDs is produced by their relatively warmer, less massive cores. A single temperature modified blackbody fit to such data tends to infer a warmer temperature and shallower (i.e. smaller) value of , and hence lower, incorrect, dust mass. Our data are consistent with the model of Dunne & Eales (2001), who use a two-component modified blackbody SED to separate the cool (15–25 K) dust component from warmer ( K) emission in the SCUBA Local Universe Galaxy Survey (SLUGS).
The upcoming higher-resolution experiments should be able to better estimate the quantity of dust in distant galaxies.
VI. Summary
BLAST made resolved observations of seven nearby galaxies over the course of two flights. Four of these galaxies, NGC 1097, NGC 1291, NGC 1512, and NGC 1566, have complementary Spitzer observations as part of the SINGS survey. For these four galaxies, we fit the models of Draine & Li (2007) to BLAST, Spitzer, and IRAS observations. Best-fit parameters are tabulated in Table 3.
The best-fit models for three of these four galaxies are consistent with the best-fit models calculated in Draine et al. (2007) without BLAST data. For the fourth galaxy, NGC 1291, we find a dust mass roughly two times larger than the dust mass determined by Draine et al. (2007). We also calculate a value for the dust mass absorption coefficient at 250 µm m2 kg-1 by comparing the Draine & Li models with a modified blackbody model.
For these four galaxies, we also produce maps of dust column density and mean dust temperature based on BLAST and MIPS observations fit to a single component modified blackbody model (Figs. 9 and 10), as well as radial profiles of the same quantities (Fig. 11). For the remaining three galaxies observed by BLAST but not observed by Spitzer, NGC 1365, NGC 1808, and NGC 4565, we calculate spatially integrated dust temperatures and dust masses by fitting a modified blackbody model to BLAST and IRAS data. We find mean dust temperatures for our galaxy sample to be in the range 16–23 K.
We calculate the fraction of the submillimeter detected flux originating in the core of the galaxy as a fraction of the total submillimeter emission from the galaxy. Although BLAST is unable to resolve the nucleus of these galaxies, the ratio of compact to extended flux measured by BLAST puts an important upper limit on the fraction of submillimeter radiation driven by a central AGN.
Only one of our sample, NGC 1365, the second brightest known Seyfert galaxy, has a significant fraction of its flux (30%) emanating from the core of the galaxy. In the remainder the core fraction is small (15%) and may be accountable primarily to nuclear star formation. In all cases, the core fraction increases with decreasing wavelength, indicating that dust in the core of these galaxies is warmer than the dust in the surrounding disk, agreeing with the radial temperature profile of Fig. 11.
We compare the total dust mass in our column density maps to the dust mass estimate based on the observation of the galaxies as a whole (i.e., an unresolved observation). We find 5–19 times more dust mass in the resolved maps than the unresolved estimate, a result of the unresolved measurements hiding cool dust. We perform a similar analysis with luminosity and find no discrepancy between the resolved and unresolved 60–1000 µm luminosity estimates.
Finally, for NGC 4565, we calculate a scale length of 118″, 156″, 142″ at 250 µm, 350 µm, and 500 µm, respectively, in good agreement with measurements at other wavelengths.
Acknowledgements.
The BLAST collaboration acknowledges the support of NASA through grant numbers NAG5-12785, NAG5-13301, and NNGO-6GI11G, the Canadian Space Agency (CSA), Canada’s Natural Sciences and Engineering Research Council (NSERC), and the UK Particle Physics & Astronomy Research Council (PPARC). We would also like to thank the Columbia Scientific Balloon Facility (CSBF) staff for their outstanding work. LO acknowledges partial support by the Puerto Rico Space Grant Consortium and by the Fondo Istitucional para la Investigacion of the University of Puerto Rico. CBN acknowledges support from the Canadian Institute for Advanced Research. This research has been enabled by the use of WestGrid computing resources. This work is based in part on observations made with the Spitzer Space Telescope, and has also made use of the NASA/IPAC Extragalactic Database (NED), both of which are operated by the Jet Propulsion Laboratory, California Institute of Technology, under contracts with the National Aeronautics and Space Administration. This research also made use of the SIMBAD database, operated at the Centre de Donées astronomiques de Strasbourg (CDS), Strasbourg, France.References
- Alloin et al. (1981) Alloin, D., Edmunds, M. G., Lindblad, P. O., & Pagel, B. E. J. 1981, A&A, 101, 377
- Alton et al. (1998) Alton, P. B., et al. 1998, A&A, 335, 807
- Aumann et al. (1990) Aumann, H. H., Fowler, J. W., & Melnyk, M. 1990, AJ, 99, 1674
- Barth et al. (1995) Barth, A. J., Ho, L. C., Filippenko, A. V., & Sargent, W. L. 1995, AJ, 110, 1009
- Beck et al. (2005) Beck, R., Fletcher, A., Shukurov, A., Snodin, A., Sokoloff, D. D., Ehle, M., Moss, D., & Shoutenkov, V. 2005, A&A, 444, 739
- Boselli et al. (2008) Boselli, A., et al. 2008, in SF2A-2008, ed. C. Charbonnel, F. Combes, & R. Samadi, 361
- Bottema (1992) Bottema, R. 1992, A&A, 257, 69
- Braine & Hughes (1999) Braine, J., & Hughes, D. H. 1999, A&A, 344, 779
- Bregman et al. (1995) Bregman, J. N., Hogg, D. E., & Roberts, M. S. 1995, Astrophys. J. , 441, 561
- Casey (1991) Casey, S. C. 1991, Astrophys. J. , 371, 183
- Chapin et al. (2008) Chapin, E. L., et al. 2008, Astrophys. J. , 681, 428
- Dale et al. (2005) Dale, D. A., et al. 2005, Astrophys. J. , 633, 857
- Dale et al. (2007) —. 2007, Astrophys. J. , 655, 863
- de Vaucouleurs (1973) de Vaucouleurs, G. 1973, Astrophys. J. , 181, 31
- de Vaucouleurs (1975) —. 1975, ApJS, 29, 193
- de Vaucouleurs et al. (1991) de Vaucouleurs, G., de Vaucouleurs, A., Corwin, Jr., H. G., Buta, R. J., Paturel, G., & Fouque, P. 1991, Third Reference Catalogue of Bright Galaxies
- Devlin et al. (2009) Devlin, M. J., et al. 2009, Nature (London), 458, 737
- Draine et al. (2007) Draine, B. T., et al. 2007, Astrophys. J. , 663, 866
- Draine & Lee (1984) Draine, B. T., & Lee, H. M. 1984, Astrophys. J. , 285, 89
- Draine & Li (2007) Draine, B. T., & Li, A. 2007, Astrophys. J. , 657, 810
- Dunne & Eales (2001) Dunne, L., & Eales, S. A. 2001, MNRAS, 327, 697
- Eales et al. (2000) Eales, S., Lilly, S., Webb, T., Dunne, L., Gear, W., Clements, D., & Yun, M. 2000, AJ, 120, 2244
- Engargiola & Harper (1992) Engargiola, G., & Harper, D. A. 1992, Astrophys. J. , 394, 104
- Fazio et al. (2004) Fazio, G. G., et al. 2004, ApJS, 154, 10
- Fixsen et al. (1998) Fixsen, D. J., Dwek, E., Mather, J. C., Bennett, C. L., & Shafer, R. A. 1998, Astrophys. J. , 508, 123
- Förster Schreiber et al. (2003) Förster Schreiber, N. M., Sauvage, M., Charmandaris, V., Laurent, O., Gallais, P., Mirabel, I. F., & Vigroux, L. 2003, A&A, 399, 833
- Galliano et al. (2005) Galliano, E., Alloin, D., Pantin, E., Lagage, P. O., & Marco, O. 2005, A&A, 438, 803
- Gerin et al. (1988) Gerin, M., Combes, F., & Nakai, N. 1988, A&A, 203, 44
- Griffin et al. (2007) Griffin, M., et al. 2007, Advances in Space Research, 40, 612
- Hogg et al. (2001) Hogg, D. E., Roberts, M. S., Bregman, J. N., & Haynes, M. P. 2001, AJ, 121, 1336
- Holland et al. (1999) Holland, W. S., et al. 1999, MNRAS, 303, 659
- Hsieh et al. (2008) Hsieh, P.-Y., Matsushita, S., Lim, J., Kohno, K., & Sawada-Satoh, S. 2008, ArXiv e-prints, 805
- Hughes et al. (1998) Hughes, D. H., et al. 1998, Nature (London), 394, 241
- Hummel et al. (1987) Hummel, E., van der Hulst, J. M., & Keel, W. C. 1987, A&A, 172, 32
- James et al. (2002) James, A., Dunne, L., Eales, S., & Edmunds, M. G. 2002, MNRAS, 335, 753
- Jiménez-Bailón et al. (2005) Jiménez-Bailón, E., Santos-Lleó, M., Dahlem, M., Ehle, M., Mas-Hesse, J. M., Guainazzi, M., Heckman, T. M., & Weaver, K. A. 2005, A&A, 442, 861
- Junkes et al. (1995) Junkes, N., Zinnecker, H., Hensler, G., Dahlem, M., & Pietsch, W. 1995, A&A, 294, 8
- Kennicutt et al. (2003) Kennicutt, Jr., R. C., et al. 2003, PASP, 115, 928
- Kinman (1978) Kinman, T. D. 1978, AJ, 83, 764
- Komossa & Schulz (1998) Komossa, S., & Schulz, H. 1998, A&A, 339, 345
- Kotilainen et al. (2000) Kotilainen, J. K., Reunanen, J., Laine, S., & Ryder, S. D. 2000, A&A, 353, 834
- Lawrence et al. (1999) Lawrence, A., et al. 1999, MNRAS, 308, 897
- Lorre (1978) Lorre, J. J. 1978, ApJ, 222, L99
- Maiolino et al. (2003) Maiolino, R., et al. 2003, MNRAS, 344, L59
- Maoz et al. (2000) Maoz, D., Barth, A. J., Ho, L. C., Sternberg, A., & Filippenko, A. V. 2000, in Bulletin of the American Astronomical Society, Vol. 32, Bulletin of the American Astronomical Society, 1529
- Mason et al. (2007) Mason, R. E., Levenson, N. A., Packham, C., Elitzur, M., Radomski, J., Petric, A. O., & Wright, G. S. 2007, Astrophys. J. , 659, 241
- Mathis et al. (1983) Mathis, J. S., Mezger, P. G., & Panagia, N. 1983, A&A, 128, 212
- Mortier et al. (2005) Mortier, A. M. J., et al. 2005, MNRAS, 363, 563
- Neininger et al. (1996) Neininger, N., Guelin, M., Garcia-Burillo, S., Zylka, R., & Wielebinski, R. 1996, A&A, 310, 725
- Netterfield et al. (2009) Netterfield, C. B., et al. 2009, ApJ, submitted
- Nutter & Ward-Thompson (2007) Nutter, D., & Ward-Thompson, D. 2007, MNRAS, 374, 1413
- Pascale et al. (2008) Pascale, E., et al. 2008, Astrophys. J. , 681, 400
- Patanchon et al. (2008) Patanchon, G., et al. 2008, Astrophys. J. , 681, 708
- Pérez & Freeman (2006) Pérez, I., & Freeman, K. 2006, A&A, 454, 165
- Prunet et al. (2000) Prunet, S., Netterfield, C. B., Hivon, E., & Crill, B. P. 2000, in Energy Densities in the Universe, Proceedings of the XXXVth Rencontre de Moroid
- Puget et al. (1996) Puget, J.-L., Abergel, A., Bernard, J.-P., Boulanger, F., Burton, W. B., Desert, F.-X., & Hartmann, D. 1996, A&A, 308, L5+
- Quillen et al. (1995) Quillen, A. C., Frogel, J. A., Kuchinski, L. E., & Terndrup, D. M. 1995, AJ, 110, 156
- Rice et al. (1996) Rice, W., Merrill, K. M., Gatley, I., & Gillett, F. C. 1996, AJ, 112, 114
- Rieke et al. (2004) Rieke, G. H., et al. 2004, ApJS, 154, 25
- Scott et al. (2002) Scott, S. E., et al. 2002, MNRAS, 331, 817
- Smail et al. (1997) Smail, I., Ivison, R. J., & Blain, A. W. 1997, ApJ, 490, L5+
- Soifer & Neugebauer (1991) Soifer, B. T., & Neugebauer, G. 1991, AJ, 101, 354
- Spinoglio et al. (2002) Spinoglio, L., Andreani, P., & Malkan, M. A. 2002, Astrophys. J. , 572, 105
- Stevens et al. (2005) Stevens, J. A., Amure, M., & Gear, W. K. 2005, MNRAS, 357, 361
- Stickel et al. (2004) Stickel, M., Lemke, D., Klaas, U., Krause, O., & Egner, S. 2004, A&A, 422, 39
- Truch et al. (2009) Truch, M. D. P., et al. 2009, Astrophys. J. , submitted
- Truch et al. (2008) —. 2008, Astrophys. J. , 681, 415
- van der Kruit & Searle (1981) van der Kruit, P. C., & Searle, L. 1981, A&A, 95, 105
- Véron et al. (1980) Véron, P., Lindblad, P. O., Zuiderwijk, E. J., Veron, M. P., & Adam, G. 1980, A&A, 87, 245
- Vlahakis et al. (2005) Vlahakis, C., Dunne, L., & Eales, S. 2005, MNRAS, 364, 1253
- Weingartner & Draine (2001) Weingartner, J. C., & Draine, B. T. 2001, Astrophys. J. , 548, 296
- Wiebe (2008) Wiebe, D. V. 2008, PhD thesis, University of Toronto
- Willmer et al. (2009) Willmer, C. N. A., Rieke, G. H., LeFloc’h, E., Hinz, J. L., Engelbracht, C. W., Marcillac, D., & Gordon, K. D. 2009, AJ, 138, 146
- Wilson et al. (2009) Wilson, C. D., et al. 2009, Astrophys. J. , 693, 1736
- Wolstencroft & Zealey (1975) Wolstencroft, R. D., & Zealey, W. J. 1975, MNRAS, 173, 51P
- Xilouris et al. (2004) Xilouris, E. M., Georgakakis, A. E., Misiriotis, A., & Charmandaris, V. 2004, MNRAS, 355, 57
| Galaxy | R.A. | Dec. | Dist. | Type66footnotemark: 6(a) | Nucleus |
|---|---|---|---|---|---|
| (J2000) | (J2000) | [Mpc] | |||
| NGC 1097 | 2h46m19.s0 | 30∘16′30″ | 16.977footnotemark: 7(b) | SB(s)b | Sy1 |
| NGC 1291 | 3h17m18.s6 | 41∘06′29″ | 9.788footnotemark: 8(b) | (R)SB(s)0/a | |
| NGC 1365 | 3h33m36.s4 | 36∘08′25″ | 18.499footnotemark: 9(c) | SB(s)b | Sy2 |
| NGC 1512 | 4h03m54.s3 | 43∘20′56″ | 10.41010footnotemark: 10(b) | SB(r)a | |
| NGC 1566 | 4h20m00.s4 | 54∘56′16″ | 18.01111footnotemark: 11(b) | SAB(s)bc | Sy1 |
| NGC 1808 | 5h07m42.s3 | 37∘30′47″ | 10.91212footnotemark: 12(d) | (R)SAB(s)a | Sy2 |
| NGC 4565 | 12h36m20.s8 | 25∘59′16″ | 12.6131313a(e) | SA(s)b | Sy2 |
| Galaxy | 250 µm | 350 µm | 500 µm | ||
|---|---|---|---|---|---|
| [Jy] | [Jy] | [Jy] | [K] | ||
| NGC 1097 | 89.40.27.7 | 40.50.13.0 | 16.20.11.4 | 21.30.3 | 1414footnotemark: 14(a) |
| NGC 1291 | 26.10.22.6 | 12.70.11.0 | 6.40.10.5 | 16.60.4 | 1515footnotemark: 15(a) |
| NGC 1365 | 145.80.312.9 | 62.30.24.6 | 24.70.12.1 | 19.90.4 | 8.72 |
| NGC 1512 | 14.70.11.3 | 6.90.10.5 | 3.40.10.3 | 20.30.3 | 1616footnotemark: 16(a) |
| NGC 1566 | 51.50.24.6 | 22.20.11.7 | 9.10.10.8 | 20.10.4 | 171717a(a) |
| NGC 1808 | 84.00.17.1 | 33.10.12.5 | 11.80.11.0 | 22.80.5 | 7.85 |
| NGC 4565 | 37.20.54.5 | 21.00.32.1 | 9.80.30.8 | 16.1 | 8.21 |
This modified blackbody fit is used to calculate from the DL07 model fit, so no independent mass is determined.
Note. — Flux uncertainties reported are first the measurement error (), and then the calibration error (). Temperatures and dust masses are extracted from the modified blackbody fits presented in Fig. 8.
| Galaxy | 1818footnotemark: 18(a) | |||||||
|---|---|---|---|---|---|---|---|---|
| % | % | m2 kg-1 | ||||||
| NGC 1097 | 8.37 | 10.80 | 3.0 | 2.00 | 1.5 | 2.80 | 0.58 | 0.299 |
| NGC 1291 | 7.62 | 9.42 | 1.6 | 0.46 | 0.4 | 1.10 | 3.47 | 0.290 |
| NGC 1291191919a(b) | 7.43 | 9.45 | 3.1 | 0.77 | 0.7 | 0.70 | 5.66 | |
| NGC 1512 | 7.25 | 9.42 | 3.2 | 1.10 | 1.0 | 0.80 | 0.87 | 0.247 |
| NGC 1566 | 8.21 | 10.58 | 4.6 | 1.74 | 1.5 | 1.30 | 1.13 | 0.305 |
at 250 µm 1919footnotetext: bwith constraint
| Core | Band | Core | Core Flux | ||
|---|---|---|---|---|---|
| Galaxy | Radius | Flux | Fraction | ||
| [′] | [kpc] | [µm] | [Jy] | [%] | |
| NGC 1097 | 0.37 | 1.8 | 250 | 13.350.03 | 14.930.06 |
| 350 | 4.970.02 | 12.260.07 | |||
| 500 | 1.360.01 | 8.440.08 | |||
| NGC 1291 | 0.71 | 2.0 | 250 | 1.410.02 | 5.420.10 |
| 350 | 0.640.01 | 5.040.17 | |||
| 500 | 0.230.01 | 3.580.17 | |||
| NGC 1365 | 0.29 | 1.6 | 250 | 13.970.16 | 9.580.13 |
| 350 | 5.380.10 | 8.620.19 | |||
| 500 | 1.350.05 | 5.460.23 | |||
| NGC 1512 | 0.40 | 1.2 | 250 | 1.510.01 | 10.260.08 |
| 350 | 0.610.01 | 8.790.21 | |||
| 500 | 0.140.01 | 3.430.06 | |||
| NGC 1566 | 0.98 | 5.1 | 250 | 19.070.04 | 37.040.19 |
| 350 | 7.720.04 | 34.780.37 | |||
| 500 | 2.840.02 | 31.040.46 | |||
| NGC 1808 | 0.29 | 0.9 | 250 | 10.860.01 | 12.940.03 |
| 350 | 3.660.01 | 11.060.07 | |||
| 500 | 0.920.01 | 7.790.05 | |||
Note. — Flux uncertainties reported are measurement errors () only.
| Unresolved Mass202020a(a) | Resolved Mass | Ratio | Aperture | |
|---|---|---|---|---|
| Galaxy | Diameter | |||
| [′] | ||||
| NGC 1097 | 8.37 | 9.17 | 6.3 | 10.9 |
| NGC 1291 | 7.62 | 8.90 | 19.1 | 13.2 |
| NGC 1512 | 7.25 | 8.38 | 13.5 | 5.8 |
| NGC 1566 | 8.21 | 8.92 | 5.1 | 6.8 |
DL07 model mass estimate from Table 3