Probing the near infrared stellar population of Seyfert galaxies
Abstract
We employ IRTF SpeX NIR (0.8m–2.4m) spectra to investigate the stellar population (SP), active galactic nuclei (AGN) featureless continuum () and hot dust properties in 9 Sy 1 and 15 Sy 2 galaxies. Both the starlight code and the hot dust as an additional base element were used for the first time in this spectral range. We found evidence of correlation among the equivalent widths () Si I 1.59m Mg I 1.58m, equally for both kinds of activity. Part of the and strengths may be related to galaxy inclination. Our synthesis shows significant differences between Sy 1 and Sy 2 galaxies: the hot dust component is required to fit the -band spectra of 90% of the Sy 1 galaxies, and only of 25% of the Sy 2; about 50% of the Sy 2 galaxies require a component contribution 20%, while this fraction increases to about 60% in the Sy 1; also, in about 50% of the Sy2, the combined FC and young components contribute with more than 20%, while this occurs in 90% of the Sy1, suggesting recent star formation in the central region. The central few hundred parsecs of our galaxy sample contain a substantial fraction of intermediate-age SPs with a mean metallicity near solar. Our SP synthesis confirms that the 1.1m CN band can be used as a tracer of intermediate-age SPs. The simultaneous fitting of SP, and hot dust components increased in the number of AGNs with hot dust detected and the mass estimated. The NIR emerges as an excellent window to study the stellar population of Sy 1 galaxies, as opposed to the usually heavily attenuated optical range. Our approach opens a new way to investigate and quantify the individual contribution of the three most important NIR continuum components observed in AGNs.
keywords:
circumstellar matter – infrared: stars – infrared: stellar population – Active Galaxies – AGB – Post-AGB.1 Introduction
A key issue in modern astrophysics is to understand the origin of the energy source that powers the continuum and line-emitting gas in active galactic nuclei (AGN). The current paradigm proposes that accretion of material onto a supermassive black-hole located at the centre of the galaxy is the mechanism responsible for the observables associated with the AGN phenomena. In addition to this central engine, observational evidence over the past decade has shown that massive star forming regions are commonly detected in the central region of galaxies harbouring an AGN (e.g. Tokunaga et al., 1991; Mizutani, Suto & Maihara, 1994; Imanishi & Dudley, 2000; Storchi-Bergmann et al., 2000; Imanishi, 2002; Rodríguez-Ardila & Viegas, 2003; Riffel et al., 2007; Dors et al., 2008). In this scenario, black-holes and starburst clusters coexist in the nuclear region of galaxies. Currently, there is ample evidence indicating that both the active nucleus and starburst might be related to gas inflow, probably triggered by an axis-asymmetry perturbation like bars, mergers or tidal interactions (Shlosman, Frank & Begelman, 1989; Shlosman, Begelman & Frank, 1990; Maiolino et al., 1997; Knapen, Shlosman & Peletier, 2000; Fathi et al., 2006; Riffel et al., 2008a), providing support to the so-called AGN-starburst connection (Norman & Scoville, 1988; Terlevich et al., 1990; Heckman et al., 1997; Cid Fernandes, 1997; González-Delgado et al., 1998; Veilleux, 2000; Ferrarese & Merritt, 2000; Heckman, 2004; Riffel et al., 2008a, and references therein).
Another line of thought, however, claims that this AGN-starburst connection could be incidental, as many Seyferts do not show any evidence of starburst activity (e.g. Filippenko et al., 1993), and optical spectroscopic studies of large samples do not indicate that starbursts are more common in Seyferts than in normal galaxies (Pogge, 1989). In addition, Cid Fernandes et al. (2004, hereafter CF04) studied the optical stellar population (SP) of 65 Sy 2 and 14 other galaxies from the Joguet (2001) sample. They concluded that the star formation history (SFH) of the Sy 2 galaxies is remarkably heterogeneous. These results are similar to those obtained in the study of the UV and optical SP of Seyfert galaxies (mostly Sy 2) available in the literature (e.g. Bica, 1988; Schmitt et al., 1996; Cid Fernandes et al., 1998; González-Delgado et al., 1998; Bonatto et al., 2000; Raimann et al., 2003; González-Delgado et al., 2004; Cid Fernandes et al., 2005b, CF04, and references therein).
To determine if circumnuclear SPs and nuclear activity are closely related phenomena, or if they are only incidental, it is of utmost importance the correct characterisation of the former, since a substantial fraction of the energy emitted by a galaxy in the optical to NIR domain is starlight. Moreover, the analysis of the stellar content provides information on critical processes such as the star formation episodes and the evolutionary history of the galaxy. In this respect, the use of NIR features in the study of SP is not recent, dating back to nearly three decades ago. For example, Rieke et al. (1980) employed NIR spectroscopy to study NGC 253 and M 82. They report the detection of a strong 2.2m CO band, suggesting the presence of a dominant population of red giants and supergiants in the nuclear region of both sources. Since then, other authors have used the NIR to study star formation, in most cases based on the 2.2m CO band (e.g. Origlia, Moorwood & Oliva, 1993; Oliva et al., 1995; Engelbracht et al., 1998; Lançon et al., 2001, and references therein) or photometric methods (e.g. Moorwood & Glass, 1982; Hunt et al., 2003).
One reason to use the NIR to study the SP of AGNs is that it is the most convenient spectral region accessible to ground-based telescopes to probe highly obscured sources. However, tracking the star formation in the NIR is complicated (Origlia & Oliva, 2000). Except for a few studies such as those based on the Br emission or the CO(2-0) first overtone (e.g. Origlia, Moorwood & Oliva, 1993; Oliva et al., 1995), the SP of the inner few hundred parsecs of active galaxies in the NIR remains poorly known. Because stellar absorption features in the NIR are widely believed to provide a means for recognizing red supergiants (Oliva et al., 1995), they arise as prime indicators for tracing starbursts in galaxies. Besides the short-lived red supergiants, the NIR also includes the contribution of thermally- pulsating asymptotic giant branch (TP-AGB) stars, enhanced in young to intermediate age stellar populations ( Gyr, Maraston, 1998, 2005). The TP-AGB phase becomes fully developed in stars with degenerate carbon oxygen cores (see Iben & Renzini, 1983, for a review). Evidence of this population in the optical is usually missed, as the most prominent spectral features associated with this population fall in the NIR (Maraston, 2005).
With the new generations of Evolutionary Population Synthesis (EPS) models, which include a proper treatment of the TP-AGB phase (Maraston, 2005), it is now possible to study in more detail NIR SP of galaxies. According to these models, the effects of TP-AGB stars in the NIR spectra are unavoidable. Maraston (2005) models, by including empirical spectra of oxygen-rich stars (Lançon & Wood, 2000), are able to foresee the presence of NIR absorption features such as the 1.1m CN band (Riffel et al., 2007), whose detection can be taken as an unambiguous evidence of a young to intermediate age SP.
Given the above, we feel motivated to carry out the first detailed study of the SP in active galaxies in the NIR using the entire 0.8-2.4m spectral range. This paper is structured as follows: The data are presented in Sect. 2. NIR spectral indices are presented in Sect. 3. In Sect. 4 we describe the fitting method. Results are presented and discussed in Sect. 5. The final remarks are given in Sect. 6.
2 The Data Set
We chose for this work a subsample of 24 from the 47 AGNs with NIR spectra published by Riffel et al. (2006). The selected targets display prominent absorption lines/bands and are listed in Tab 1. All spectra were obtained at the NASA 3 m Infrared Telescope Facility (IRTF). The SpeX spectrograph (Rayner et al., 2003) was used in the short cross-dispersed mode (SXD, 0.8-2.4m). The detector used was a 10241024 ALADDIN 3 InSb array with a spatial scale of 0.15”/pixel. A 0.8”15” slit was employed giving a spectral resolution of 360 . The radius of the central integrated region is few hundred parsecs for almost all sources111Lower than 300 pc for 15 objects, between 300 pc and 500 pc for 6 and 500 for 3. For more details see col. 10 of Table 1 of Riffel et al. (2006). For more details on the instrumental configuration, data reduction, calibration processes and integrated region see Riffel et al. (2006). A rapid inspection of Figs. 9, 10 and 12 in Riffel et al. (2006) shows that all the chosen spectra are dominated by strong absorption features, the most prominent ones are identified in Fig .1 of Riffel et al. (2008b).
3 Near infrared spectral indices: direct measurements
For comparison with published works and future NIR stellar population studies, we compute the equivalent widths () of the NIR absorption features as well as selected continuum fluxes () in regions free from emission/absorption, normalized to unity at 1.223m. and are measured according to the definitions of Riffel et al. (2008b). The values of and are presented in Tabs. 1 and 2, respectively.
| Object/Ion | CaT1 | CaT2 | CaT3 | CN | Al i | Na i | Si i | Mg i | Si i | CO | Na i | Ca i | CO | CO | CO |
|---|---|---|---|---|---|---|---|---|---|---|---|---|---|---|---|
| BPb(m) | 0.8476 | 0.8520 | 0.8640 | 1.0780 | 1.1200 | 1.1335 | 1.2025 | 1.5720 | 1.5870 | 1.6110 | 2.1936 | 2.2570 | 2.2860 | 2.3150 | 2.3420 |
| BPr(m) | 0.8520 | 0.8564 | 0.8700 | 1.1120 | 1.1300 | 1.1455 | 1.2200 | 1.5830 | 1.5940 | 1.6285 | 2.2150 | 2.2740 | 2.3100 | 2.3360 | 2.3670 |
| center(m) | 0.8498 | 0.8542 | 0.8670 | 1.0950 | 1.1250 | 1.1395 | 1.2112 | 1.5771 | 1.5894 | 1.6175 | 2.2063 | 2.2655 | 2.2980 | 2.3255 | 2.3545 |
| (1) | (2) | (3) | (4) | (5) | (6) | (7) | (8) | (9) | (10) | (11) | (12) | (13) | (14) | (15) | (16) |
| Seyfert 2 | |||||||||||||||
| NGC 262() | 3.820.44 | 5.920.44 | 4.110.42 | - | - | - | - | 1.410.27 | 2.170.05 | - | 1.040.04 | - | 2.750.01 | 0.740.03 | 1.780.02 |
| Mrk 993 | 1.410.15 | 3.460.13 | 2.730.12 | - | - | 2.57 0.01 | - | 3.580.13 | 2.220.05 | 2.430.04 | 3.030.04 | - | 9.040.01 | 5.240.03 | 8.340.03 |
| NGC 591 | 5.800.39 | 4.570.29 | 4.720.17 | 16.950.13 | - | - | - | 3.830.07 | 2.470.02 | 2.810.03 | 4.510.21 | 5.390.13 | 9.830.11 | 1.390.03 | 10.140.09 |
| Mrk 573 | 3.800.18 | 4.040.18 | 3.080.17 | 14.050.15 | - | - | 2.860.01 | 3.920.01 | 2.060.01 | 2.760.05 | 2.770.04 | 1.480.03 | 7.870.43 | - | 4.260.13 |
| NGC 1144 | 4.720.43 | 5.880.35 | 4.280.21 | 18.900.21 | 2.140.01 | 3.41 0.01 | 3.300.01 | 4.270.04 | 2.310.13 | 2.810.01 | 4.010.02 | 1.700.09 | 10.630.09 | 5.760.01 | - |
| Mrk 1066 | 4.050.11 | 4.500.08 | 3.610.07 | 13.820.14 | - | 1.90 0.01 | - | 4.580.01 | 2.250.02 | 3.480.13 | 3.680.01 | 3.110.02 | 9.980.28 | 4.810.13 | 7.870.01 |
| NGC 1275 | - | - | - | - | - | - | - | - | - | 2.710.10 | 3.930.08 | 2.490.07 | - | - | - |
| NGC 2110() | 5.280.28 | 7.470.90 | 4.590.20 | 20.000.20 | - | 2.28 0.01 | - | 3.780.05 | 1.810.01 | 3.200.28 | 3.300.04 | 0.750.01 | 4.780.05 | 2.320.10 | 4.200.04 |
| ESO 428-G014 | 4.310.06 | 6.300.04 | 3.850.01 | - | - | 2.87 0.07 | - | 4.770.01 | 2.570.01 | 3.400.03 | 4.800.06 | 2.310.10 | 12.340.34 | 5.100.25 | 11.800.11 |
| Mrk 1210 | - | - | - | - | - | - | - | 6.540.19 | 2.820.16 | 3.350.13 | - | 1.070.16 | 7.730.15 | - | 3.410.47 |
| NGC 5728 | - | - | - | - | - | - | - | 5.410.17 | 3.740.29 | 5.730.12 | 8.740.42 | 5.440.14 | 8.160.01 | 8.980.01 | 10.270.01 |
| NGC 5929 | 3.560.19 | 5.580.17 | 4.060.15 | 15.420.25 | - | 1.00 0.91 | 2.170.91 | 4.270.49 | 1.700.19 | 3.520.21 | 5.430.17 | 3.670.36 | 13.770.06 | 6.780.03 | 11.420.04 |
| NGC 5953() | 4.680.23 | 6.500.17 | 5.260.13 | 12.650.35 | 1.950.01 | 1.98 0.01 | 1.620.01 | 3.980.08 | 1.900.04 | 3.610.15 | 3.820.03 | 2.670.04 | 13.370.20 | 7.740.03 | - |
| NGC 7674 | 2.240.51 | 3.420.43 | 3.570.31 | - | - | 3.20 0.36 | - | 2.350.14 | 1.980.03 | - | - | - | - | - | - |
| NGC 7682 | 3.220.20 | 4.530.17 | 1.490.30 | 11.000.23 | - | - | - | 4.040.08 | 2.920.02 | 2.700.02 | - | - | 9.420.26 | 8.330.08 | - |
| Seyfert 1 | |||||||||||||||
| Mrk 334 | - | - | - | 19.110.10 | - | - | 1.120.11 | 3.400.06 | 1.780.08 | 3.130.09 | 1.660.04 | 1.850.07 | 6.140.01 | 2.960.00 | 3.540.05 |
| NGC 1097 | 4.480.17 | 5.840.15 | 3.290.13 | 5.880.26 | 1.790.22 | 1.460.13 | 1.810.13 | 4.510.15 | 2.620.20 | 3.690.10 | 2.990.01 | 2.040.05 | 9.450.20 | 5.160.12 | 10.320.02 |
| MCG-5-13-17 | 2.350.10 | 3.180.08 | 3.840.08 | - | - | 1.910.21 | - | 2.870.04 | 2.250.05 | 3.070.06 | 1.430.05 | 1.970.02 | 7.950.11 | 3.870.03 | 6.550.05 |
| Mrk 124 | - | - | - | - | - | - | - | 2.190.06 | 1.290.30 | 2.120.05 | - | - | - | - | - |
| NGC 3227 | - | 1.670.06 | 2.090.05 | - | - | 5.780.15 | - | 3.430.03 | 1.580.03 | - | 2.360.03 | 1.350.04 | 6.240.01 | 2.790.00 | 4.470.03 |
| NGC 4051 | - | - | - | - | - | - | - | 3.220.01 | 1.930.03 | 3.190.08 | 1.130.01 | 0.730.01 | 3.690.11 | 0.660.08 | 3.500.02 |
| Mrk 291 | - | 2.400.07 | 4.450.09 | - | - | 2.560.01 | - | 3.430.02 | - | 3.800.11 | - | - | 11.900.05 | - | - |
| Arp 102B | - | - | - | - | - | - | - | 2.120.39 | 1.380.07 | 3.820.05 | 1.970.03 | 2.140.02 | 4.610.05 | 2.800.01 | - |
| Mrk 896 | - | - | - | - | - | - | - | 1.690.14 | 1.24 0.25 | 2.160.01 | 0.670.08 | 0.530.01 | 1.230.06 | 1.890.05 | - |
-
BPb and BPr are the blue and red bandpass boundaries. () The continuum of is affected by spurious emission. If we use only the points free from emission to set the continuum we get 3.280.20, 5.030.18 and 3.360.17 for CaT1, CaT2, CaT3, respectively.
The most studied absorption lines in the literature and present in our spectral range are the Calcium triplet lines (CaT222=,e.g. Terlevich et al., 1990; Garcia-Rissmann et al., 2005; Vega et al., 2008, and references therein).
We have four of our objects (Mrk 573, Mrk 1066, NGC 2110 and Mrk 1210) in common with Vega et al. (2008). For the first 3 objects we measure values larger than those reported by them. The difference is due to the different index definitions. While we use those of Bica & Alloin (1987) and Vega et al. (2008) use Cenarro et al. (2001). The CaT in Mrk 1210 occurs near the detection limit in our spectrum, which thus preclude measurements. Vega et al. (2008) report a value of 6.220.48Å for this feature. In addition, the differences between our measurements and those of Vega et al. (2008) can be related to the fact that they measure in their synthetic spectra, and therefore our measurements represent better the conditions observed in actual galaxy spectra. Other explanation for the discrepancies probably lies in the different apertures used in both works. They use a slit width of 2.0′′ (Garcia-Rissmann et al., 2005) while we use a slit 2.5 times narrower (Riffel et al., 2006). Terlevich et al. (1990) report CaT measurements for NGC 3227, NGC 262 (Mrk 348) and NGC 5953. Our WCaT value for the former is consistent with theirs, while for the latter two we measure higher values. The discrepancy is again due to the different continuum definitions333 In order to compare our values with those of Terlevich et al. (1990) we compute the of our NGC 5953 spectrum using their continuum definitio. The values thus obtained are: =1.7Å =4.3Å and =3.8Å. which are very similar to those of Terlevich et al. (1990). Note that, for NGC 3227, Terlevich et al. (1990) used an optional blue continuum band at 8582Å, wich provides a continuum slope very similar in both studies, wich thus explains the similarity in WCaT.
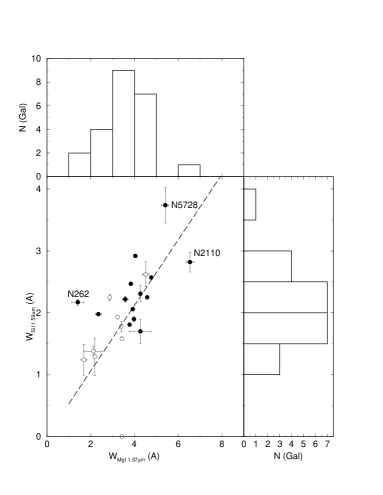
In Fig. 1 we compare 1.58m with 1.59m. These two absorption lines are correlated as =(0.530.02), with CC=0.67 (or =(0.710.21), CC=0.69). The correlation between of these two lines suggests that almost all the objects studied here follow the same chemical enrichment. This hypothesis can be associated with the fact that Si and Mg are more abundant than the other elements in the Galactic Globular Cluster NGC 6121, which is located near the Galaxy centre (=350.97o, = 15.97o, Mariano et al., 2008).
We have tried diagrams involving other NIR absorption lines (or bands), but only weak correlations are found. Since the values are studied in Riffel et al. (2006) we only present them in Tab. 2 for comparison purposes.
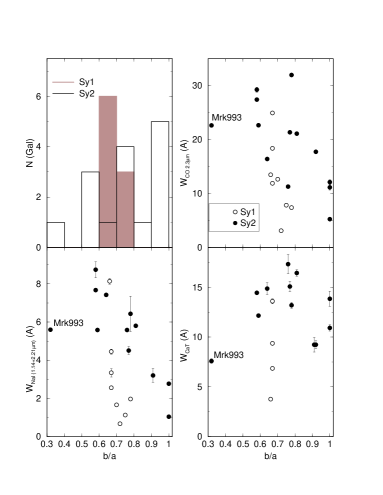
Our sample is composed mostly of spiral galaxies (Tab. 3), which tend to increase the optical with the inclination b/a (Bica et al., 1991). This could be the case of NGC 5728, which has a low b/a, high and displays the highest =3.09 mag value of our sample. In Fig. 2 we investigate the relation between galaxy inclination and of NIR absorption lines. The correlation suggests that the interstellar medium plays an important role in the NIR 444 The better NIR correlation can also be associated with the fact that the NIR probes SPs deeper in the dust and therefore the contribution of the Na i is enhanced by the intrinsic stellar light.. On the other hand, is weakly correlated with galaxy inclination (Fig. 2, top right), suggesting a weaker dependence on the interstellar medium. No correlation of with b/a is found. In addition, the correlation between Nai and 2.3m with b/a has no evident relation with Seyfert type (Fig. 2).
| Galaxy | F/F1.223μm | ||||||||
|---|---|---|---|---|---|---|---|---|---|
| 0.81 | 0.88 | 0.99 | 1.06 | 1.22 | 1.52 | 1.70 | 2.09 | 2.19 | |
| (1) | (2) | (3) | (4) | (5) | (6) | (7) | (8) | (9) | (10) |
| Seyfert 2 | |||||||||
| NGC 262 | 1.28 | 1.12 | 1.11 | 1.01 | 1.00 | 0.94 | 0.95 | 0.95 | 0.92 |
| Mrk 993 | 1.25 | 1.26 | 1.18 | 1.13 | 1.00 | 0.80 | 0.71 | 0.71 | 0.37 |
| NGC 591 | 1.08 | 1.05 | 1.05 | 1.01 | 1.00 | 0.76 | 0.67 | 0.67 | 0.35 |
| Mrk 573 | 1.26 | 1.27 | 1.23 | 1.15 | 1.00 | 0.79 | 0.72 | 0.72 | 0.45 |
| NGC 1144 | 1.25 | 1.25 | 1.21 | 1.16 | 1.00 | 0.76 | 0.67 | 0.67 | 0.34 |
| Mrk 1066 | 1.05 | 1.11 | 1.10 | 1.08 | 1.00 | 0.83 | 0.80 | 0.80 | 0.49 |
| NGC 1275 | 1.47 | 1.29 | 1.20 | 1.16 | 1.00 | 0.87 | 0.81 | 0.73 | 0.73 |
| NGC 2110 | 0.97 | 0.95 | 0.98 | 1.05 | 1.00 | 0.93 | 0.89 | 0.89 | 0.65 |
| ESO 428-G014 | 1.18 | 1.17 | 1.12 | 1.08 | 1.00 | 0.79 | 0.72 | 0.72 | 0.37 |
| Mrk 1210 | - | 1.25 | 1.27 | 1.16 | 1.00 | 0.85 | 0.82 | 0.82 | 0.65 |
| NGC 5728 | - | - | 1.01 | 1.00 | 1.00 | 0.82 | 0.76 | 0.76 | 0.42 |
| NGC 5929 | 1.25 | 1.24 | 1.15 | 1.10 | 1.00 | 0.80 | 0.73 | 0.73 | 0.35 |
| NGC 5953 | 1.28 | 1.26 | 1.17 | 1.12 | 1.00 | 0.76 | 0.69 | 0.69 | 0.33 |
| NGC 7674 | 1.21 | 1.12 | 1.08 | 1.02 | 1.00 | 0.97 | 1.02 | 1.02 | 1.10 |
| NGC 7682 | 1.04 | 1.06 | 1.07 | 1.05 | 1.00 | 0.83 | 0.74 | 0.74 | 0.35 |
| Seyfert 1 | |||||||||
| Mrk 334 | 1.07 | 1.07 | 1.08 | 1.06 | 1.00 | 0.93 | 0.91 | 0.91 | 0.69 |
| NGC 1097 | 1.08 | 1.25 | 1.16 | 1.15 | 1.00 | 0.81 | 0.74 | 0.74 | 0.39 |
| MCG-5-13-17 | 1.43 | 1.41 | 1.25 | 1.18 | 1.00 | 0.79 | 0.73 | 0.73 | 0.44 |
| Mrk 124 | - | - | 1.00 | 1.00 | 1.00 | 1.07 | 1.06 | 1.06 | 1.00 |
| NGC 3227 | 1.28 | 1.25 | 1.16 | 1.08 | 1.00 | 0.88 | 0.84 | 0.84 | 0.58 |
| NGC 4051 | - | 1.27 | 1.15 | 1.07 | 1.00 | 0.89 | 0.86 | 0.86 | 0.73 |
| Mrk 291 | 1.73 | 1.51 | 1.30 | 1.26 | 1.00 | 0.80 | 0.70 | 0.70 | 0.41 |
| Arp 102B | 1.48 | 1.33 | 1.24 | 1.23 | 1.00 | 0.77 | 0.69 | 0.69 | 0.40 |
| Mrk 896 | 1.31 | 1.20 | 1.12 | 1.07 | 1.00 | 0.95 | 0.93 | 0.93 | 0.73 |
-
The errors on are 3% in all cases.
4 spectral synthesis
In this section we study the NIR SP of our galaxy sample, fitting the underlying continuum of the 24 AGNs in the spectral range between 0.8m and 2.4m.
4.1 The base set
Clearly, the most important ingredient in the SP synthesis is the spectral base set, . An ideal base of elements should cover the range of spectral properties observed in the galaxy sample, providing enough resolution in age and metallicity to properly address the desired scientific question (Schmidt et al., 1991, CF05).
One improvement here over previous approaches that attempted to describe the stellar content of active galaxies using NIR spectroscopy is the inclusion of EPS models that take into account the effects of TP-AGB stars. Accordingly, we use as base set the EPS of Maraston (2005). The SSPs used in this work cover 12 ages, = 0.01, 0.03, 0.05, 0.1, 0.2, 0.5, 0.7, 1, 2, 5, 9, 13 Gyr, and 4 metallicities, namely: = 0.02 , 0.5 , 1 and 2 , summing up 48 SSPs.
When trying to describe the continuum observed in AGNs, the signature of the central engine cannot be ignored. Usually, this component is represented by a featureless continuum (, e.g. Koski, 1978, CF04) of power-law form that follows the expression . Therefore, this component was also added to the base of elements. The contribution of this continuum (in percentage) to the flux at (1.223m) is denoted by in Tab. 3. According to the unified model (e.g. Antonucci & Miller, 1985; Antonucci, 1993), the in Sy 2 galaxies (if present) is due to scattered light from the hidden Seyfert 1 (Sy 1) nucleus. However, the reader must bear in mind that a common problem in the study of the SP of Seyfert galaxies (especially in the optical) is that a reddened young starburst (5M yr) is indistinguishable from an AGN-type continuum (see Sec. 5.2; Cid Fernandes & Terlevich, 1995; Storchi-Bergmann et al., 2000, CF04). To avoid this problem we have not included very young SSPs in our base (this point is also discussed in Sec. 5.2).
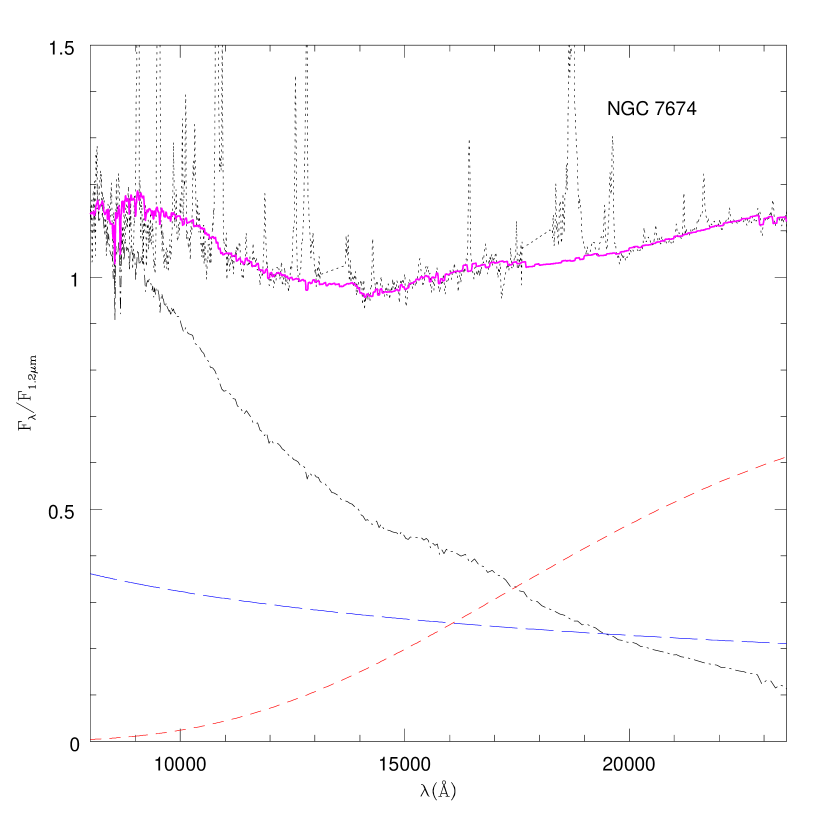
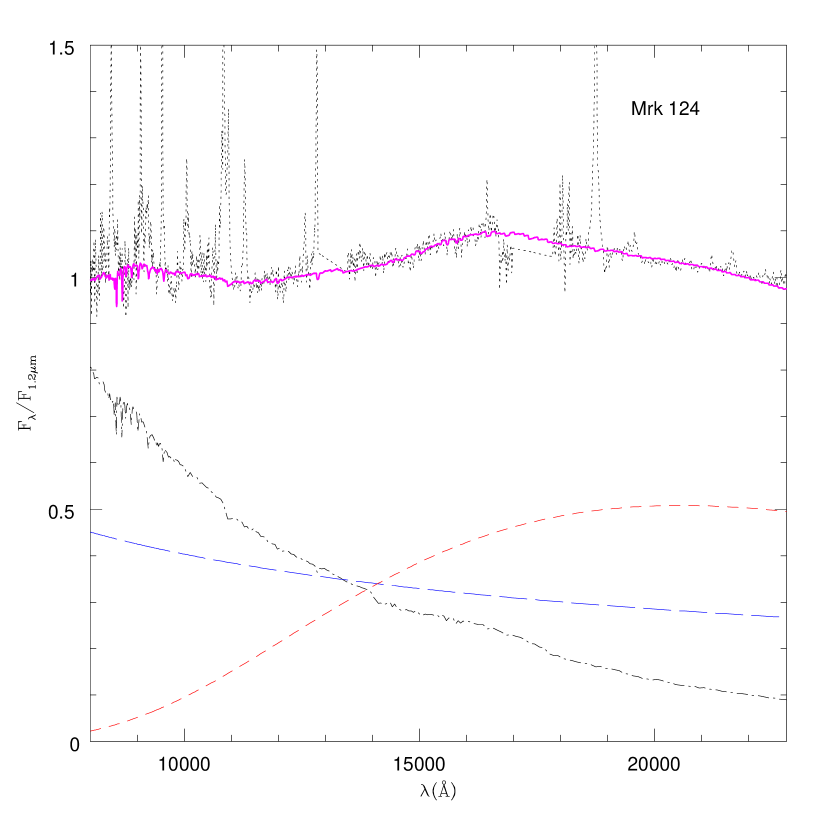
In the spectral region studied here, hot dust plays an important role in the continuum emission of active galaxies. Previous studies (i.e., Riffel et al., 2006, for instance) report a minimum in the continuum emission around 1.2m, probably associated with the red end of the optical continuum related to the central engine and the onset of the emission due to reprocessed nuclear radiation by dust (Barvainis, 1987; Thompson, 1995; Rudy et al., 2000; Rodríguez-Ardila & Viegas, 2003; Rodríguez-Ardila & Mazzalay, 2006; Riffel et al., 2006). In order to properly account for this component, we have included in our spectral base 8 Planck distributions (black-body-), with ranging from 700 to 1400 K, in steps of 100 K. The lower limit in is due to the fact that lower temperatures are hard to detect. Even a small fractional contribution would require a sizeable amount of dust. In order to illustrate this point, we plot in Fig. 3 combinations of different distributions with the synthetic template of the starburst galaxy NGC 7714, derived by Riffel et al. (2008b).The combination was made summing up, in the whole spectral range, increasing fractions of the dust component from 0% to 100%. Thus, we start with the pure NGC 7714 synthetic spectrum and end with a pure BB distribution according to:
| (1) |
where is the percentual flux, which we vary in steps of 1%; is the flux of the synthetic spectrum of NGC 7714 normalized to unity at 1.223m and is the flux also normalized at the same wavelength. As can be observed in Fig. 3, small fractional contributions of cool (700 K) dust can significantly alter the strength of the absorption lines of the band spectrum, and therefore, are very hard to be detected in our spectral range. Hotter distributions are not used because 1400 K is very close to the sublimation temperature of graphite grains (likely the main constituent of the dust, Barvainis, 1987; Rodríguez-Ardila & Mazzalay, 2006).

4.2 The method
The second most important ingredient of a stellar population synthesis is is the code that will suitably combine the individual components of the base elements to construct the final model that will represent the observed continuum. Here, as a synthesis code, we use for the first time – in this spectral range – the starlight software (Cid Fernandes et al., 2004, 2005a; Mateus et al., 2006; Asari et al., 2007; Cid Fernandes et al., 2008). This code is well described in Cid Fernandes et al. (CF04, 2005a, hereafter CF05). In summary, starlight mixes computational techniques originally developed for semi empirical population synthesis with ingredients from evolutionary synthesis models(CF05). Basically, the code fits an observed spectum with a combination, in different proportions, of single stellar populations (SSPs). Due to the fact that the Maraston (2005) models include the effect of the TP-AGB phase, crucial to model NIR SP (see Riffel et al., 2007, 2008b; riffel08c), we used this EPS models as the base set for starlight555As default base set, the code use the SSPs of Bruzual & Charlot (2003).. Extinction is modeled by starlight as due to foreground dust, and parametrised by the V-band extinction . We use the CCM (Cardelli, Clayton & Mathis, 1989) extinction law. Essentially, the code solves the following equation for a model spectrum (CF05):
| (2) |
were is the reddened spectrum of the th SSP normalized at ; is the reddening term; is the synthetic flux at the normalisation wavelength; is the population vector; denotes the convolution operator and is the gaussian distribution used to model the line-of-sight stellar motions, it is centred at velocity with dispersion .
The fit is carried out with a simulated annealing plus Metropolis scheme, which searches for the minimum of the equation (CF05):
| (3) |
where emission lines and spurious features are masked out by fixing =0. For more details on starlight see CF04 and CF05.
5 Synthesis results and discussion
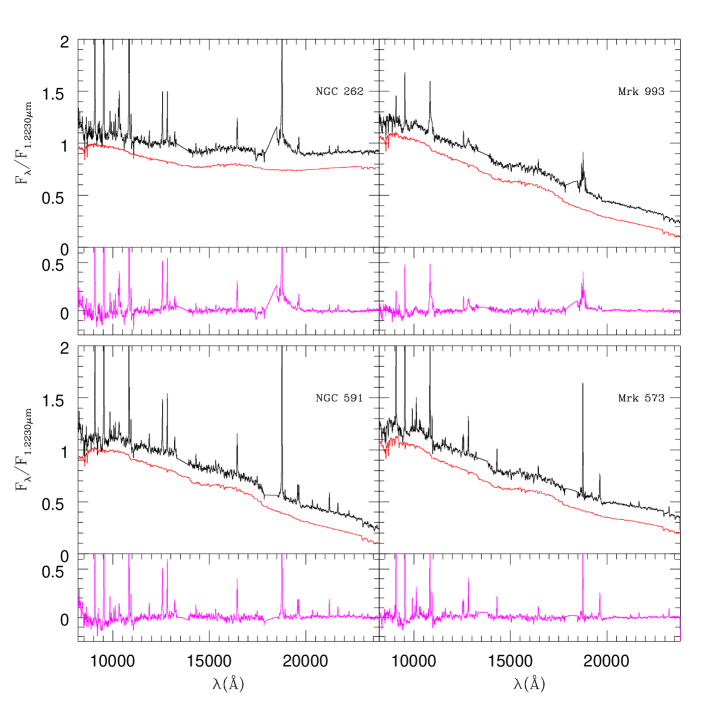
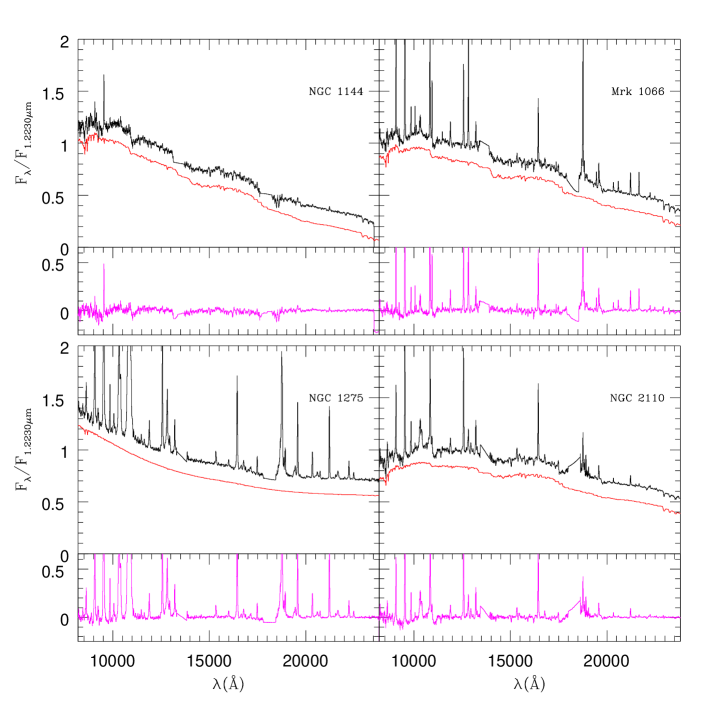
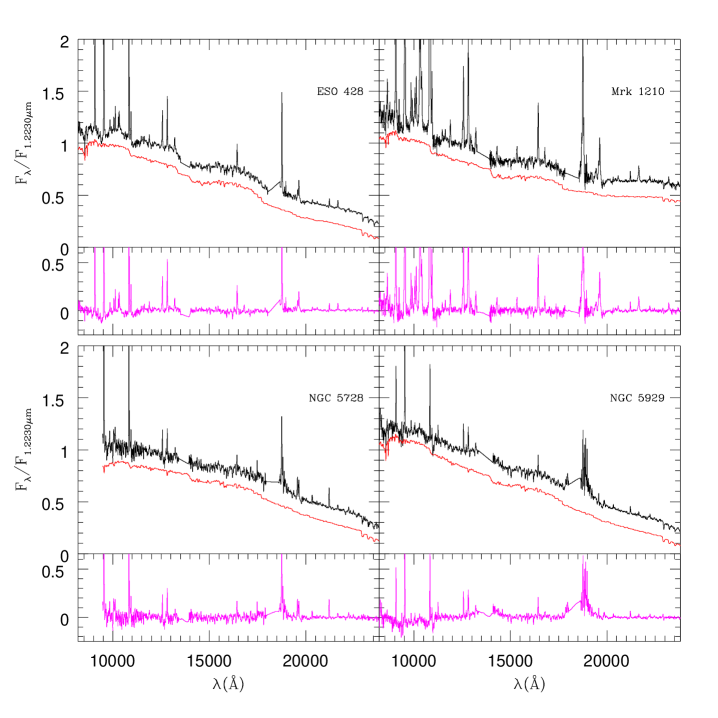
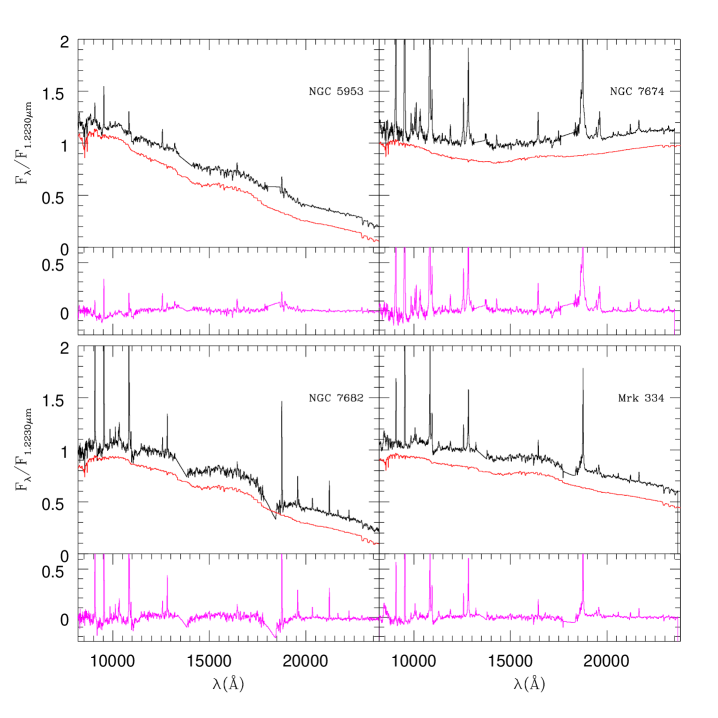
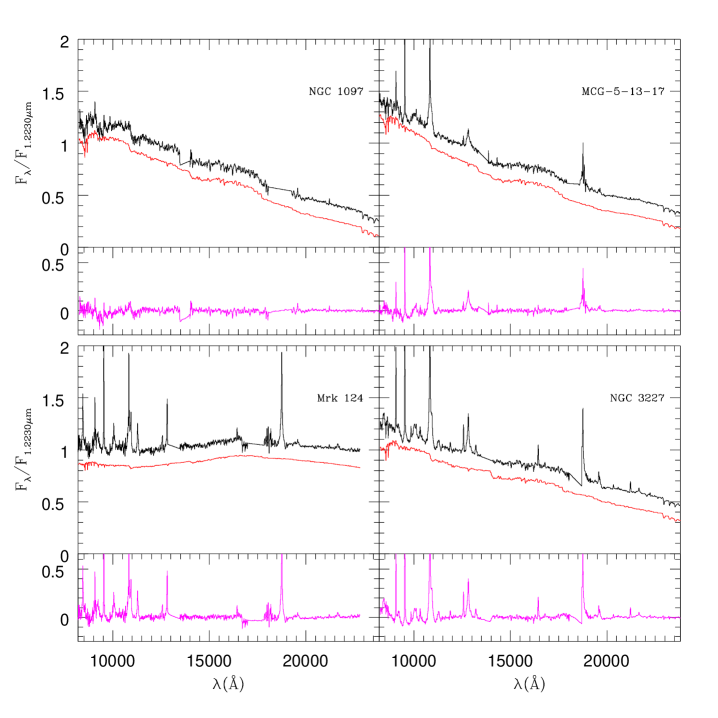
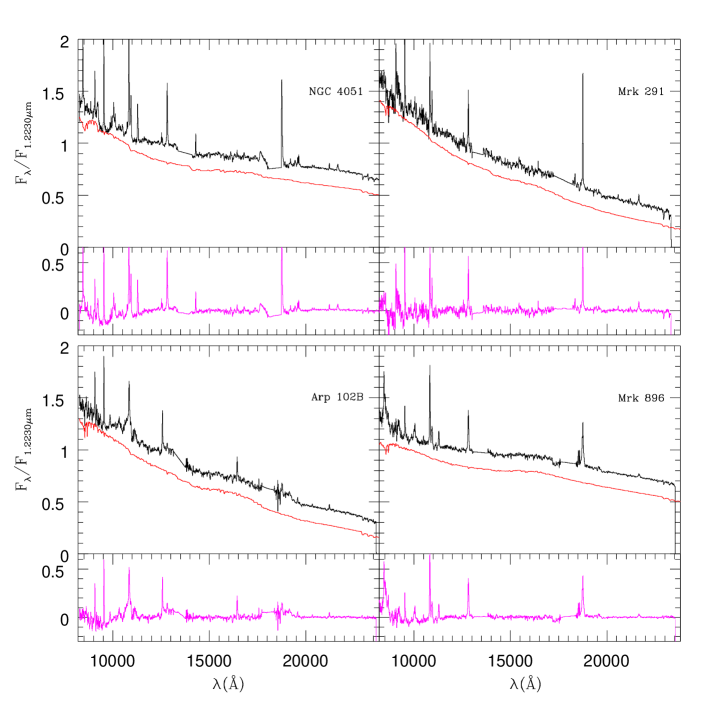
We present in Figs. 4 to 9 the results of the spectral synthesis fitting procedure. For each galaxy the top panel shows the observed and synthetic spectra normalized to unity at 1.223m. Note that in all cases the synthetic spectrum was shifted by a constant for visualisation purposes. The bottom panel shows the residual spectrum . As expected, the residual is dominated by the nebular emission. The analysis of the emission lines free from the SP contamination is beyond the scope of this paper and is left for a forthcoming work (Riffel et al., 2009 in preparation). The results of the synthesis are summarised in Tab. 3. The quality of the fits are measured by the (column 13)666 Which, in fact, is the divided by the number of ’s used in the fit. Reliable fits are obtained when 1 (CF04). for more details see starlight manual available at http://www.starlight.ufsc.br. and the adev (column 14) parameters. The latter gives the percentage mean deviation over all fitted pixels.
| Galaxy | b/a‡ | Morphology† | adev | Av | ||||||||||||||
|---|---|---|---|---|---|---|---|---|---|---|---|---|---|---|---|---|---|---|
| (%) | (%) | (%) | (%) | (%) | (%) | (%) | (%) | (%) | (mag) | (yr) | (yr) | () | () | |||||
| (1) | (2) | (3) | (4) | (5) | (6) | (7) | (8) | (9) | (10) | (11) | (12) | (13) | (14) | (15) | (16) | (17) | (18) | (19) |
| Seyfert 2 | ||||||||||||||||||
| NGC 262 | 1.0 | S0-a | 20.0 | 1.8 | 3.6 | 0.0 | 13.0 | 61.2 | 0.0 | 2.9 | 97.1 | 1.52 | 1.06 | 1.37 | 9.68 | 9.89 | 0.011 | 0.005 |
| Mrk 993 | 0.32 | Sa | 4.7 | 0.0 | 0.0 | 0.0 | 27.8 | 66.8 | 0.0 | 6.4 | 93.6 | 0.01 | 1.90 | 1.32 | 9.54 | 9.83 | 0.013 | 0.005 |
| NGC 591 | 0.77 | S0-a | 0.0 | 0.0 | 0.0 | 14.9 | 27.4 | 57.5 | 1.4 | 7.5 | 91.1 | 0.01 | 2.87 | 1.97 | 9.28 | 9.84 | 0.014 | 0.003 |
| Mrk 573 | 1.0 | S0-a | 22.4 | 0.0 | 0.0 | 11.9 | 52.6 | 11.8 | 3.4 | 45.1 | 51.5 | 2.98 | 1.02 | 0.99 | 8.93 | 9.56 | 0.028 | 0.024 |
| NGC 1144 | 0.64 | E | 0.0 | 0.0 | 0.0 | 0.0 | 71.3 | 26.1 | 0.0 | 44.9 | 55.1 | 0.01 | 2.22 | 1.44 | 8.97 | 9.32 | 0.021 | 0.015 |
| Mrk 1066 | 0.59 | S0-a | 17.9 | 0.0 | 0.0 | 4.6 | 50.7 | 26.8 | 0.8 | 29.8 | 69.5 | 2.36 | 1.11 | 1.54 | 9.19 | 9.67 | 0.025 | 0.015 |
| NGC 1275 | 0.77 | S0 | 65.8 | 0.3 | 0.0 | 2.8 | 0.0 | 32.1 | 0.1 | 0.0 | 99.9 | 1.15 | 0.80 | 0.22 | 9.68 | 9.94 | 0.003 | 0.001 |
| NGC 2110 | 0.76 | E-SO | 33.6 | 0.0 | 0.9 | 9.5 | 36.3 | 18.9 | 1.7 | 26.0 | 72.3 | 1.42 | 0.75 | 1.98 | 8.98 | 9.70 | 0.028 | 0.010 |
| ESO 428-G014 | 0.58 | S0 | 0.0 | 0.0 | 0.0 | 9.2 | 49.1 | 39.6 | 1.1 | 15.9 | 83.0 | 0.03 | 2.05 | 1.52 | 9.13 | 9.76 | 0.021 | 0.005 |
| Mrk 1210 | 1.0 | S? | 12.0 | 0.5 | 0.0 | 9.2 | 48.8 | 29.1 | 0.3 | 30.7 | 69.0 | 2.29 | 1.05 | 1.14 | 9.17 | 9.77 | 0.013 | 0.007 |
| NGC 5728 | 0.58 | Sa | 0.0 | 0.0 | 0.0 | 0.0 | 69.5 | 27.8 | 0.0 | 24.4 | 75.6 | 0.01 | 2.89 | 3.09 | 8.64 | 9.51 | 0.037 | 0.037 |
| NGC 5929 | 0.78 | Sa | 0.0 | 0.0 | 0.0 | 7.3 | 24.5 | 69.7 | 1.4 | 11.0 | 87.7 | 0.01 | 2.38 | 1.48 | 9.37 | 9.61 | 0.020 | 0.022 |
| NGC 5953 | 0.81 | S0-a | 0.0 | 0.0 | 0.0 | 0.0 | 33.5 | 65.2 | 0.0 | 7.0 | 93.0 | 0.01 | 2.00 | 0.81 | 9.46 | 9.80 | 0.031 | 0.023 |
| NGC 7674 | 0.91 | SBbc | 29.2 | 2.2 | 5.7 | 3.4 | 24.6 | 35.6 | 0.7 | 15.8 | 83.4 | 0.03 | 1.37 | 1.03 | 9.28 | 9.69 | 0.018 | 0.010 |
| NGC 7682 | 0.92 | Sab | 0.0 | 0.0 | 0.0 | 0.0 | 34.7 | 62.2 | 0.0 | 6.4 | 93.6 | 0.02 | 3.76 | 1.89 | 9.53 | 9.91 | 0.020 | 0.011 |
| Seyfert 1 | ||||||||||||||||||
| Mrk 334 | 0.70 | Sbc | 23.7 | 0.0 | 8.2 | 12.2 | 24.1 | 31.7 | 2.6 | 9.9 | 87.5 | 0.01 | 1.45 | 1.36 | 9.03 | 9.71 | 0.018 | 0.007 |
| NGC 1097 | 0.67 | SBb | 4.3 | 0.0 | 0.0 | 19.8 | 46.4 | 29.8 | 2.9 | 28.6 | 68.5 | 1.70 | 1.33 | 1.29 | 8.88 | 9.49 | 0.024 | 0.017 |
| MCG-5-13-17 | 0.67 | E-SO | 6.6 | 0.0 | 3.9 | 22.9 | 45.7 | 21.6 | 5.2 | 25.1 | 69.7 | 1.68 | 0.81 | 0.88 | 8.55 | 9.47 | 0.023 | 0.012 |
| Mrk 124 | 0.67 | S? | 36.5 | 0.0 | 22.6 | 3.6 | 18.3 | 19.0 | 1.4 | 14.8 | 83.8 | 0.10 | 1.29 | 0.81 | 9.10 | 9.73 | 0.008 | 0.002 |
| NGC 3227 | 0.66 | SABa | 31.0 | 0.0 | 2.1 | 38.4 | 28.1 | 0.0 | 10.8 | 89.2 | 0.0 | 0.05 | 1.24 | 0.99 | 8.00 | 9.07 | 0.011 | 0.011 |
| NGC 4051 | 0.75 | SABb | 41.0 | 0.0 | 6.8 | 37.6 | 14.4 | 0.0 | 46.7 | 53.1 | 0.2 | 0.03 | 1.28 | 0.57 | 7.53 | 8.02 | 0.020 | 0.010 |
| Mrk 291 | 0.67 | SBa | 6.5 | 0.0 | 4.5 | 0.0 | 6.1 | 85.3 | 0.0 | 1.1 | 98.9 | 1.01 | 2.06 | 0.45 | 9.85 | 9.94 | 0.006 | 0.004 |
| Arp 102 B | 0.78 | ? | 7.9 | 0.0 | 3.0 | 11.7 | 35.2 | 41.5 | 1.0 | 12.7 | 86.3 | 1.61 | 1.14 | 0.68 | 9.08 | 9.80 | 0.015 | 0.005 |
| Mrk 896 | 0.72 | Sab | 27.0 | 0.0 | 13.7 | 4.5 | 2.3 | 53.0 | 0.5 | 0.6 | 98.9 | 0.01 | 0.90 | 0.55 | 9.72 | 9.96 | 0.009 | 0.012 |
-
(‡) From NED. (†) From HyperLeda - Database for physics of galaxies (http://leda.univ-lyon1.fr, Paturel et al., 2003). () Abundance by mass with Z = 0.02.
To take into account noise effects that dump small differences between similar spectral components, we followed CF05 and present our results using a condensed population vector, which is obtained by binning the into young, (yr); intermediate-age, (yr) and old, (yr) components, using the flux contributions. The same bins were used to represent the mass components of the population vector; , and , respectively. The condensed population vectors are presented in columns 7 to 12 of Tab. 3. For more details on vector definition see CF05. We have also binned the black-body contributions into two components. The cool () is obtained by summing up the contributions with T 1000 K, and the hot one () with T 1100 K. These components were defined based on the sublimation temperatures of silicate (1000 K) and graphite ( 1200 K) grains (Barvainis, 1987; Granato & Danese, 1994). The condensed black-body vectors for each source are listed in columns 5 and 6 of Tab. 3.
The spectral synthesis shows that the NIR continuum of active galaxies can be explained in terms of at least three components: a non-thermal continuum, the dust emission and the SP of the circumnuclear region. As can be seen in Table 3 and in Fig. 10, the contribution of the latter to the nuclear continuum is higher than 50% in most objects. Therefore, its study is a critical step in the analysis of the continuum emission of Seyfert galaxies. Moreover, our results are consistent with the predictions of the unified model for AGNs, as the non-thermal continuum and the hot dust emission are present in all Sy 1 sources and only in a small fraction of the Sy 2s (see also Sec. 5.3). In the following sections we provide a detailed description of each of these three components in the light of the results obtained here and compare them with those obtained in other wavelength regions, mostly in the optical.
5.1 The stellar population
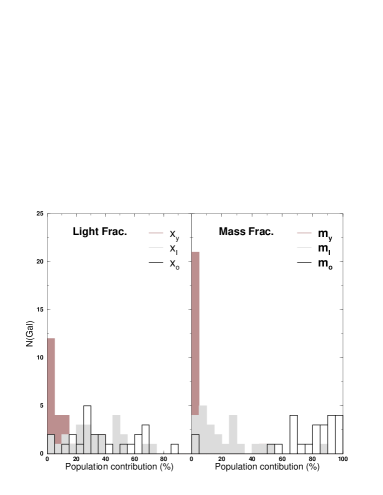
Binning the population vectors into six components777With 3 components representing the star formation episodes. left us with a coarser but more powerful description of the SFH of our galaxy sample. To better quantify the NIR SFH we plot a histogram with the flux-weighted and mass-weighted condensed population vectors in Fig. 12. Overall, the NIR SPs are heterogeneous, as in most sources the three components contribute significantly to the integrated flux. However, the contribution of is very small (10%) for most of our sample. The intermediate-age component is well distributed, with a maximum centred at 40%. The contribution is very similar to that of the intermediate age.
Regarding the mass-weighted components, as expected from the results seen above, the contribution of is very small (near zero) as can be observed in the right side of Fig. 12. The intermediate-age mass contributions are distributed over all fractions (from 0 to 100%) but tend to be biased to values lower than 20%. In contrast, the old component of the mass-weighted vector is biased to values higher than 70%.
According to CF05, if one would characterise the SP mixture of a galaxy by a single parameter, it is the mean stellar age. They defined it in two ways: the first is weighted by light fraction,
| (4) |
and the second, weighted by the stellar mass,
| (5) |
Note that both definitions are limited by the age range used in our elements base (Sect. 4.1) and obviously, the and components were excluded from the sum. The mean stellar ages derived with both definitions are presented in columns 16 and 17 of Tab. 3, respectively.
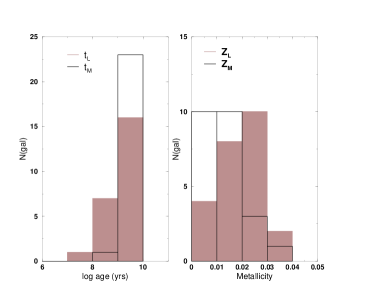
To better quantify the NIR mean ages we show at the left side of Fig. 12 histograms for and . The light-weighted mean age of our galaxy sample is biased to an intermediate/old age SP, while for the mass-weighted mean age we clearly observe that the old population dominates. As stated by CF05 the mass-weighted mean age is a more physical parameter, but it has a much less direct relation with the observables. They associated this discrepancy with the non-constant stellar ratio.
A secondary parameter to describe the mixed SP is the metallicity. CF05 also defined the light-weighted mean metallicity by
| (6) |
as well as the mass-weighted mean metallicity, which is represented by:
| (7) |
Both definitions are bounded by the -2 range. The light- and mass-weighted mean metallicities, estimated for our galaxies, are presented in columns 18 and 19 of Tab. 3, respectively.
We present in the right side of Fig. 12 a histogram for the light- and mass-weighted metallicities of our sample. Our results point to a mean metallicity solar to above solar, if we consider the light-weighted values, while for the mass-weighted mean metallicity our results indicate a sub-solar value. We associate this discrepancy with the well known age-metallicity degeneracy, i.e. for a fixed mass, a high-metallicity SP looks cooler - and older - than a low-metallicity SP, thus resulting in a higher ratio. Moreover, this is consistent with a galaxy chemical enrichment scenario in which the young population is enriched by the evolution of the early massive stars. In this context, the light-weighted metallicity is more sensitive to the young component, while the mass-weighted metallicity to the old stellar population.
5.1.1 Previous studies
A significant fraction (12 out of 24) of our objects have been subject of previous SP studies in the optical and UV regions. In this section we will compare our NIR results with those available in the literature.
-
•
NGC 262: Accordingly to Garcia-Vargas et al. (1989) most of the optical and NIR flux comes from the galaxy bulge SP. The emission at shorter wavelengths can be fitted by a power law. González-Delgado et al. (2001) studied the optical SP of this galaxy and found a dominant old population. By fitting the nuclear continuum with an off-nuclear spectrum of the galaxy bulge as template, they conclude that the contribution of a power law is unnecessary. In the case of an elliptical as a template spectrum, they needed to include a contribution 25% of a power law (). They argue that such small dilution can be related to a change in the SP of NGC 262 with respect to the elliptical galaxy template. Similar results are obtained by Raimann et al. (2003). They found 60%, 20%, 12% and 8% for the old, intermediate, young and components, respectively888 Note that we have used only the nuclear region. We use the 10 Gyr, 1 Gyr, 100+10 Myr and 3 Myr+ as old, intermediate, young and components, respectively.. As can be observed in Tab. 3 our results agree with the optical studies.
-
•
ESO 428-G014: CF04 carried out a study of the SP, in the spectral region between 3500 and 5200 Å of the inner 200 pc of this source. Their study also used starlight. They found =20%, =47% and =33%. As can be observed in Tab 3 our NIR results agree with those obtained by CF04 in the optical.
-
•
Mrk 1066: The light in the optical region of this galaxy is dominated by young to intermediate age SPs, and the nuclear spectrum is strongly diluted by a non-thermal component (González-Delgado et al., 2001). These results agree with those reported by Raimann et al. (2003). Our results show that light at 1.22m is dominated by a intermediate age SP diluted by a component, in agreement with the optical results (see Tab. 3). With respect to the stellar component, our results agree with Ramos Almeida et al. (2009), wich studied the same spectral region by modeling the continuum with combinations of stars and black-body (with T=1000K) dilution, without the component.
-
•
Mrk 1210: The optical SP of this source has been studied by many authors (Schmitt et al., 1999; Storchi-Bergmann et al., 2000, CF04) however, the results are controversial. While Schmitt et al. (1999) argue that the optical light is dominated by a 10 Gyr population (54% at 5870Å), Storchi-Bergmann et al. (2000) suggest that a young SP (or a power law) contributes with 50% of the flux observed in 4020Å. When modelling the spectral interval between 3500-5200 Å, CF04 inferred that 53% of the flux observed in the spectrum Mrk 1210 was due to a young stellar population. They also found a contribution of 39% for the old component and 5% for the intermediate one. Our results disagree with those reported in the optical, as we found a lower fraction for the old component (29%) and 49% for the intermediate one. Moreover, 20% of the flux belongs to young+ components.
-
•
NGC 3227: We found a dominant young component ( 40%) for this galaxy. Our results agrees with those of Davies et al. (2007, 2006) which analyze the star formation in the inner 10 pc of this galaxy using the near infrared adaptive optics integral field spectrograph SINFONI. They found that the light at this region is dominated by a 40 Myr SP.
-
•
Mrk 573: The optical SP of this source was studied by Schmitt et al. (1999). They fit the and continuum ratios, finding that 82% of the flux observed in 5870Å is due to a 10 Gyr stellar population. These results are in good agreement with those obtained by Raimann et al. (2003), Storchi-Bergmann et al. (2000) and González-Delgado et al. (2001) in the optical region999These two latter groups have analysed the absorption lines species present in the observed spectra.. Our NIR spectral synthesis points to a dominant intermediate age population (53%) diluted by a component, which contributes with 22% of the observed continuum flux. As for Mrk 1066, we agree with Ramos Almeida et al. (2009) with respect to the dominant presence of an intermediate age population, but we only found dilution by the component.
-
•
NGC 1097: The SP of this galaxy was studied in the UV by Bonatto et al. (1998). They infer that the light at 2646 Å is due to a fraction of 40% of a young SP101010We call young SP the sum of the contributions with age 0.2Gyr. For more details see Tab 11 of Bonatto et al. (1998)., 16% to intermediate age and 44% to old SP. These results agree with the detection of a young starburst in the inner 9 pc of this galaxy (Storchi-Bergmann et al., 2005, see also Davies et al. (2007, 2009)) and with the optical SP studied by CF04, who found a contribution of 31% for the young component. However, there are some differences between the UV and optical SP for the intermediate age (CF found 37%) and for the old (CF found 12%, they also determine 19% for the ) components. The results for the young SP of both groups of authors are consistent with our NIR synthesis. Regarding the intermediate and old age components, our results are more consistent with those of the optical region. The discrepancies between our results and those obtained in the UV are probably related to the fact that in the NIR we are integrating light through a deeper line of sight and thus, we detect old stars located more internally in the bulge of the galaxy.
-
•
NGC 2110: González-Delgado et al. (2001) argue that the stellar optical absorption lines are similar to those of an old population. By fitting the nuclear continuum with an off-nuclear spectrum of the galaxy bulge as template, they conclude that the contribution of a power law is unnecessary. In the case of an elliptical as a template spectrum, they needed to include a contribution 25% of a power law (). These results are further confirmed by CF04, who found a contribution of 67% for the old component, 7% for the intermediate age and 26% for the young SP, as well as by Raimann et al. (2003) who determine contributions of, 53%, 32% and 10% for the old, intermediate and young age components, respectively. Our results indicate a dominant intermediate age stellar population and a strong component. The detection of the latter component may be related to the fact that the NIR is less affected by dust extinction and is consistent with the detection of broad components in the emission lines. (see Sec. 5.2).
-
•
NGC 5728: CF04 fitted the SP of this object and concluded that its light between 3500 and 5200 Å is dominated by intermediate age stars (51%), with contributions of 20% and 28% of young and old SPs, respectively. These fractions agree with our NIR analysis, where we found a dominant contribution of the intermediate age SP (70%) and 30% for the old component. However, we did not detect the young component in our fitting process. This can be associated to the fact that NIR light is dominated by intermediate age stars (Maraston, 2005) or to our spectral coverage that misses the calcium triplet absorption, lines which are more sensitive to young SPs (see Fig. 4 of Riffel et al., 2008b).
-
•
NGC 5929: According to González-Delgado et al. (2001) the nucleus of this source is dominated by old SP, a conclusion obtained by studying the of optical absorption lines. They also conclude that if the off-nuclear spectrum is used as template to fit the nuclear spectrum of NGC 5929, no signs of dilution are observed. Simmilar results are obtained by Raimann et al. (2003) who found contributions of, 61%, 27%, 8% and 4% for the old, intermediate and young and components, respectively. These results fully match our NIR synthesis (=0%, =7.7%, =24.5% and =69.7%)
-
•
NGC 5953: One of the galaxies studied by CF04. They derived a dominant intermediate age optical SP (=74%) with small fractions of young and old stars (=1% and =7%) and a contribution of 18% of the . The NIR SP of this galaxy is divided into two components, the old, dominant, (65%) and the intermediate age (34%). The FC component does not contribute to the NIR flux.
-
•
NGC 7682: The optical light of this source is dominated by an old SP (86%) with no contribution of intermediate age stars (CF04). A small contribution of young populations (8%) and 6% of a component is reported by CF04. Our NIR results disagree with those of the optical: the SP is shared between old (63%) and intermediate (35%) age populations.
Our NIR synthesis and that in the optical (CF04) have been analysed by the same method (the starlight code), allowing for a proper comparison of the objects in common to both studies. Fig. 13 summarises this comparison. In general, our results do not agree with those in the optical. Part of the differences can be accounted for by the fact that the NIR is more suitable for the identification of old SPs and the detection of the unique absorptions related to 1 Gyr-old SP featured by TP-AGB stars (Riffel et al., 2008b). This hypothesis is appropriate for the case of NGC 5953, where the differences between our results and those of CF04 occur in the and components. In addition, the differences between optical and NIR SPs can be associated to the fact that the NIR probes SPs buried deep in the dust. An example of this situation is NGC 2110, where we have detected the presence of hot dust in its integrated spectrum (Tab. 4). For the case of NGC 1097, Storchi-Bergmann et al. (2005) report an obscuration of a central starburst, which they associate with a dusty absorbing medium.
Our finding that the central regions of the galaxies contain a substantial fraction of intermediate-age SPs (see Figs. 12 and 14), together with the prolonged SFH, is very similar to the picture drawn in the case of central star-forming rings, based on optical data (Allard et al., 2006; Sarzi et al., 2007). This might support the scenario where central star formation often occurs in circumnuclear rings (Sarzi et al., 2005; Shields et al., 2007).

5.1.2 The CN versus intermediate age stellar population
Our NIR approach offers a unique opportunity to investigate in a more consistent way the relation between the CN molecular band and the unambiguous evidence of an intermediate age SP (Maraston, 2005; Riffel et al., 2007; riffel08c). Fig. 14 presents a histogram comparing the intermediate age SP of the galaxies where CN was clearly detected (Riffel et al., 2007) and those with no detections in a visual inspection. The objects with a clear CN detection have contributions of the intermediate age component higher than 20%, with a mean value of 4015%. Regarding the galaxies where CN was not detected, the values are biased to contributions lower than 30%. The mean value derived for the intermediate age for the sources without CN detection is 2720%.
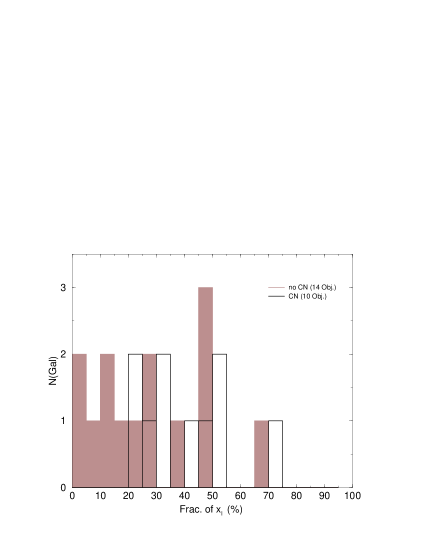
In four galaxies where CN was not detected we obtained fractions of the component higher than 35%. This result may appear contradictory, as the CN band is the stellar feature that most suitably traces the intermediate age component. For NGC 5728, for instance, we associate the 69% of the intermediate age component with our shorter spectral coverage (see Sec. 5.1.1) and the low S/N ratio. For ESO 428-G014, Mrk 1210 and MCG 5-13-17, the CN band is totally filled by the Pa emission line (Fig 2 of Riffel et al., 2006).
We conclude this section arguing that our NIR spectral fitting confirms that the detection of the CN band in the spectrum of a galaxy can be taken as an unambiguous evidence of the presence of an intermediate age SP.
5.2 The featureless component
As discussed in Sec 4.1, it is very difficult to distinguish a reddened young strarburst from a power law. However, this effect is even harder in the optical, where the main difference between a 5 Myr SSP and a seen through an absorption mag by dust is the presence of the Balmer absorption lines and Balmer jump in the blue side in the former (CF04).
Cid Fernandes & Terlevich (1995) predicted that a broad component in H becomes distinguishable whenever the scattered contributes with 20% to the optical continuum light. With our synthesis we can investigate this issue in the NIR. Six out of 15 Sy 2 galaxies of our sample display a contribution higher than 20% (Tab. 3). Interestingly, a broad component in the Hydrogen lines is detected in the spectra of the six sources: Mrk 1066 (e.g. Veilleux et al., 1997), Mrk 573 (Nagao et al., 2004), NGC 1275 (e.g. Ho et al., 1997), NGC 2110 (e.g. Reunanen et al., 2003), NGC 262 (e.g. Miller & Goodrich, 1990) and NGC 7674 (e.g. Miller & Goodrich, 1990).
For two of our galaxies a broad component is reported in the literature, and we do not detect strong contribution of the component. The first one is Mrk 1210, where a broad component of H and H is detected in polarised light (Tran et al., 1992; Tran, 1995) and in the NIR Hi lines (Mazzalay & Rodríguez-Ardila, 2007) for which we find a 12% contribution of the component and 10%. Our NIR synthesis for this galaxy is consistent with that obtained by CF04 in the optical, but we tend to find a lower contribution of the young component. The second object is NGC 5953, where Gonçalves et al. (1999) report the possible detection of a very weak broad H line, but we did not find any contributions of and . CF04 report a contribution of 18% for the non-thermal component. No broad components are detected in our NIR spectrum (see Riffel et al., 2006).
The minimum contribution predicted by Cid Fernandes & Terlevich (1995) seems to be reflected in the NIR, as we clearly detect fractions higher than 20% in the Sy 2 objects with a broad component in the H i lines. Therefore, our results reinforce their predictions. In addition, we detect 20% in almost all Sy 1 sources111111With a mean value of 20% if all Sy 1 sources are considered and 32% if we exclude Mrk 291, Arp102B, MCG-5-13-17 and NGC 1097., which is consistent with the above arguments. However in four of our Sy 1 galaxies (Mrk 291, Arp 102 B, MCG-5-13-17 and NGC 1097) we detect fractions of 20%. For the first three objects we associate this ambiguity to the absence of features suitable to properly fit the absorption spectra and to a poor S/N ratio in the blue side of the spectrum (see below). As discussed by CF04 and CF05, a high S/N ratio is required for an adequate detection of the different contributions to the integrated spectra. Interestingly, the three objects display the presence of hot dust, wich is in full agreement with the nature of the Sy 1 objects predicted by the unified model for AGN (see Sec 5.3). NGC 1097, originally classified as LINER on the basis of its optical spectrum (Keel, 1983) was reclassified by Storchi-Bergmann et al. (1993, 1997, 2003) as a Sy 1 after observing broad Balmer emission lines, a featureless blue continuum and double peak profiles. Our spectral synthesis for NGC 1097 agrees with that obtained by CF04. Moreover, our value of 20% is consistent with the starburst nature of this galaxy (Storchi-Bergmann et al., 2005).
It is worth to mention at this point that the WCaT values, measured for almost all object of our sample (see Sec. 3), even if the dilution is considered, are consitent with values measured in normal spiral galaxies (15Å Bica & Alloin, 1987). However, in two cases, NGC 262 and NGC 2110, if we account for the dilution we reach very high values for WCaT ( 17 Å and 25Å, respectively). One explanation is that the WCaT of these sources is overestimated due to the effects on the continuum and absorption lines by telluric features (see Tab. 1). Other posibility lies in the fact that the component is more sensitive to shorter wavelengths ( 10 000Å see Fig. 10), which is our region with the lower number of constraints121212Due to the large number of emission lines which are masked out. and the lower S/N (the border of the spectrum; 9 000 Å). Therefore, the component can be overestimated in these sources.
5.3 Dust emission
A rapid look at column 5 of Table 3 shows an excess of emission over the stellar population and the featureless continuum for half of the AGN spectra. This excess (see Fig. 10), characterised by a Planck distribution, suggests emission from hot dust grains. Since Barvainis (1987), evidence of the presence of dust near the sublimation temperature has been observed in the central region of AGNs (e.g. Marco & Alloin, 1998, 2000; Rodríguez-Ardila et al., 2005; Rodríguez-Ardila & Mazzalay, 2006; Riffel et al., 2009). In order to quantify the dust contribution, we show in Tab. 4 the individual contribution of each blackbody over the temperature interval 800 1400 K. Note that as the T=700 K and T=1000 K components were not detected, we dropped them from Tab. 4.
Only in five Sy 2 galaxies we have detected hot dust, while a positive detection is reported for all Sy 1s. The obvious reason for this is that we are dealing with hot dust in the -band (1 000 K), and in the case of Sy 2s the dust is cooler (600 K), thus more visible in the or -bands. This hypothesis is supported by the fact that in two Sy 1 galaxies, Mrk 1239 and Mrk 766, we can see directly the presence of hot dust in the -band (Rodríguez-Ardila et al., 2005; Rodríguez-Ardila & Mazzalay, 2006). There are two remarkable cases, Mrk 573 and Mrk 1066, where we have detected a significant fraction of the component and no hot dust. There are some possible explanations for this, the first two are that discussed above. Another possibility is that at least a significant fraction of the detected component is due to a very young starbust (5 Myr). The latter, as discussed above (see Sec. 5.2) lies in the fact that the can be overestimated due the small number of constraints in the shorter wavelengths.
The two main constituents of interstellar dust are graphite (carbon) and silicate grains (e.g. Krüegel, 2003). As discussed in Sect. 5, the evaporation temperatures of graphite and silicate grains are 1500 K and 1000 K, respectively (Barvainis, 1987; Granato & Danese, 1994). The temperature derived for the component of almost all objects is 900 K (see and in Tab. 3), suggesting that hot dust close to the central source is probably composed by graphite grains instead of silicates. The only discrepant objects are Mrk 1210 and NGC 1275 with T=800 K. Considering, however, that the spatial resolution in those objects is 400 pc (Riffel et al., 2006), and that the dust temperature is a function of the distance to the central source (Marco & Alloin, 1998), it is very likely that dust at higher temperatures exists closer to the central source. This would rule out the possibility of silicates as the main component of the nuclear dust grains.
Assuming that the temperature of the different , found for each galaxy represents the distribution of temperatures for graphite grains in the nuclear region, we can estimate the lower limit of the hot dust mass responsible for the observed -band excess (see Fig. 10) following the approach developed by Barvainis (1987).
The infrared spectral luminosity of each dust grain can be obtained from (Barvainis, 1987):
| (8) |
where is the grain radius; is its absorption efficiency and is the Planck function for a grain at temperature . was calculated assuming a typical grain radius (Barvainis, 1987; Kishimoto, 2007) =1.4 and =1.6 (Barvainis, 1987). The values of are shown in Tab. 4.
The hot dust mass, MHD, can be obtained by the equation (Rodríguez-Ardila et al., 2005):
| (9) |
where is the number of hot dust grains and is the density of the grain. is the total NIR luminosity due to hot dust. It can be derived from the integrated the flux of each contribution over the spectral range between 0.01 and 160m found on each galaxy131313 Note that we have weighted the distribution according to its contribution to the total SED. Then, we multiplied the integrated normalized flux by the actual flux at 1.2m (our normalisation point) and convert it to the adequate units (from to ). The final result of this process is the flux of each contribution (). The values derived for our sample are presented in Tab. 4. The was estimated using and c listed in Tab. 4 (we have adopted ).
Finally, we have estimated the lower limit for hot dust mass, for graphite grains with (Granato & Danese, 1994) and using Eq. 9. The hot dust mass of each distribution, as well as the total hot dust mass (MHD), are presented in Tab. 4.
| Seyfert 2 | Seyfert 1 | |||||||||||||||
| (K) | (a) | NGC 262 | NGC 2110 | Mrk 1210 | Mrk 1275 | NGC 7674 | Mrk 334 | MCG 5-13-17 | Mrk 124 | NGC 3227 | NGC 4051 | Mrk 291 | Arp 102 B | Mrk 896 | ||
| Cont.(%) | 0 | 0 | 0.5 | 0.3 | 0 | 0 | 0 | 0 | 0 | 0 | 0 | 0 | 0 | |||
| FBB (b) | 7.53 | 10.79 | ||||||||||||||
| 800 | 15.08 | LBB (c) | 2.62 | 6.36 | ||||||||||||
| Ngr (d) | 173.76 | 421.51 | ||||||||||||||
| MHD (e) | 103.33 | 250.65 | ||||||||||||||
| Cont.(%) | 1.8 | 0 | 0 | 0 | 2.2 | 0 | 0 | 0 | 0 | 0 | 0 | 0 | 0 | |||
| FBB (b) | 10.51 | 12.17 | ||||||||||||||
| 900 | 25.93 | LBB (c) | 4.54 | 19.46 | ||||||||||||
| Ngr (d) | 175.21 | 750.60 | ||||||||||||||
| MHD (e) | 104.19 | 446.34 | ||||||||||||||
| Cont.(%) | 0 | 0 | 0 | 0 | 0 | 0 | 0 | 0 | 0 | 2.3 | 0 | 0 | 0 | |||
| FBB (b) | 7.12 | |||||||||||||||
| 1200 | 97.39 | LBB (c) | 0.07 | |||||||||||||
| Ngr (d) | 0.76 | |||||||||||||||
| MHD (e) | 0.45 | |||||||||||||||
| Cont.(%) | 0 | 0 | 0 | 0 | 5.7 | 0 | 0 | 0 | 0 | 2.0 | 0 | 0 | 0 | |||
| FBB (b) | 2.54 | 4.05 | ||||||||||||||
| 1300 | 140.75 | LBB (c) | 4.07 | 0.04 | ||||||||||||
| Ngr (d) | 28.91 | 0.30 | ||||||||||||||
| MHD (e) | 17.19 | 0.18 | ||||||||||||||
| Cont.(%) | 3.6 | 0.9 | 0 | 0 | 0 | 8.2 | 3.9 | 22.6 | 2.1 | 2.5 | 4.5 | 3.0 | 13.7 | |||
| FBB (b) | 1.21 | 1.07 | 5.17 | 3.70 | 6.54 | 4.35 | 3.61 | 0.56 | 1.13 | 6.29 | ||||||
| 1400 | 197.92 | LBB (c) | 0.52 | 0.12 | 4.76 | 1.10 | 39.64 | 0.12 | 0.04 | 1.32 | 1.26 | 8.39 | ||||
| Ngr (d) | 2.64 | 0.63 | 24.04 | 5.54 | 200.31 | 0.63 | 0.19 | 6.66 | 6.36 | 42.42 | ||||||
| MHD (e) | 1.57 | 0.37 | 14.29 | 3.29 | 119.11 | 0.37 | 0.11 | 3.96 | 3.78 | 25.22 | ||||||
| MHD (e) | 106 | 0.37 | 103 | 251 | 463 | 14 | 3 | 119 | 0.4 | 0.75 | 4 | 4 | 25 | |||
| cz (f) | 4507 | 2335 | 4046 | 4046 | 8671 | 6579 | 3731 | 16878 | 1157 | 700 | 10552 | 700 | 7922 | |||
-
(a) ; (b) ; (c) ; (d) ; (e) ; (f) From NED. Note that as we have not detected contributions for the T=700 K, 2.64 and T=1100 K components we left them out from the table.
To compare the mass values derived for our sample and those reported by other authors, Tab. 5 lists the masses available in literature, determined following (Barvainis, 1987). It is important to note that only three objects, Mrk 1239, Mrk 766 and NGC 7582, of the nine listed in Tab. 5 have the hot dust mass estimated by means of spectroscopy. In the remaining six, the masses were determined using photometry. The spectroscopic approach allows a careful subtraction of the power-law contribution and the stellar population. Moreover, our results have the advantage, over previous determinations, of considering the SP, the and the in the same fitting process. Thus, our study has increased significantly the number of AGNs with the mass of hot dust estimated.
| Galaxy | (M⊙) | Spectra | Reference |
|---|---|---|---|
| NGC 7582 | yes | Riffel et al. (2009) | |
| Mrk 1239 | yes | Rodríguez-Ardila & Mazzalay (2006) | |
| Mrk 766 | yes | Rodríguez-Ardila et al. (2005) | |
| NGC 1068 | no | Marco & Alloin (2000) | |
| NGC 7469 | no | Marco & Alloin (1998) | |
| NGC 4593 | no | Santos-Lléo et al. (1995) | |
| NGC 3783 | no | Glass (1992) | |
| NGC 1566 | no | Baribaud et al. (1992) | |
| Fairall 9 | no | Clavel, Wamsteker & Glass (1989) |
Given that the radius of the integrated region covered by most of our data is less than 500 pc141414Except for Arp 102 B, Mrk 124 and Mrk 291., this value sets an upper limit to the size of the hot dust emission region. We may further constrain this emission region if we consider that in half of our sample the spatial resolution is 400 pc. It means that the bulk of the hot dust is more likely concentrated close to the central source.
The origin of the hot dust can be the putative torus required by the unified model for AGNs (Antonucci & Miller, 1985; Antonucci, 1993), which is a natural dust reservoir. This hypothesis is further supported by the detection of hot dust in the inner 25 pc of NGC 7582 (Riffel et al., 2009) and by Jaffe et al. (2004), who studied the Mid-infrared spectrum of NGC 1068, using interferometry with the Very Large Telescope Interferometer-VLTI. The latter work shows that the 10 m emission is due to hot dust at 800 K concentrated in the central pc of this object, surrounded by cooler dust (T=300 K) in scales of 2-4 pc. However, the detailed discussion of dust distribution around the central region of AGNs is beyond the scope of this paper and is left for a forthcoming work (Riffel et al. 2009, in preparation).
6 Final Remarks
In this work we investigate the NIR spectra of 24 Seyfert galaxies (9 Sy 1 and 15 Sy 2) observed with the IRTF SpeX, obtained in the short cross-dispersed mode. Our main focus was the stellar population, AGN featureless continuum and dust contribution properties, along the full wavelength coverage (0.8m - 2.4m). We have analysed the absorption features located in the NIR. The approach followed here is based on the starlight code, which considers the whole observed spectrum, continuum and absorption features. This is the first instance where starlight is applied to this wavelength range. Besides, in this work we also consider for the first time hot dust as an additional element base.
The main results can be summarised as follows. We found evidence of correlation among the of Si I 1.59m Mg I 1.58m, equally for both kinds of activity. Part of the and strengths and the correlation between and appears to be accounted for by galaxy inclination. For the 7 objects in common with previous optical studies (based on the same method of analyses), the NIR stellar population synthesis does not reproduce well the optical results. Our synthesis shows significant differences between Sy 1 and Sy 2 galaxies. The hot dust component is required to fit the -band spectra of 80% of the Sy 1 galaxies, and only of 40% of the Sy 2. Besides, about 50% of the Sy 2 galaxies require a featureless component contribution in excess of 20%, while this fraction increases to about 60% in the Sy 1. Also, in about 50% of the Sy 2, the combined FC and components contribute with more than 20%, while this occurs in 90% of the Sy 1. This suggests recent star formation (CF05) in the central region of our galaxy sample. We found that the light at 1.223m in central regions of the galaxies studied here contain a substantial fraction of intermediate-age SPs with a mean metallicity near solar. Moreover, our analysis confirms that the 1.1m CN band can be taken as an unambiguous tracer of intermediate-age stellar populations.
One consequence of this work - especially because of the simultaneous fitting of SP, and hot dust components, allowing a proper analysis of each one of them - is a 150% (400% if only spectroscopic studies are considered) increase in the number of AGNs with hot dust detected and the mass estimated.
What emerges from this work is that the NIR may be taken as an excellent window to study the stellar population of Sy 1 galaxies, as opposed to the usually heavily attenuated optical range. Our approach opens a new way to investigate and quantify the contribution of the three most important NIR continuum components observed in AGNs.
Acknowledgements
We thank the anonymous referee for useful comments. R. R. thanks to the Brazilian funding agency CAPES. ARA acknowledges support of the Brazilian Funding Agency CNPq under grant 311476/2006-6. The starlight project is supported by the Brazilian agencies CNPq, CAPES and FAPESP and by the France-Brazil CAPES/Cofecub program.This research has made use of the NASA/IPAC Extragalactic Database (NED) which is operated by the Jet Propulsion Laboratory, California Institute of Technology, under contract with the National Aeronautics and Space Administration. We acknowledge the usage of the HyperLeda database (http://leda.univ-lyon1.fr).
References
- Allard et al. (2006) Allard, E. L., Knapen, J. H., Peletier, R. F. & Sarzi, M., 2006, MNRAS, 371, 1087.
- Antonucci (1993) Antonucci, R. 1993, ARA&A, 31, 473.
- Antonucci & Miller (1985) Antonucci, R. R. J. & Miller, J. S. 1985, ApJ, 297, 621.
- Asari et al. (2007) Asari, N. V., Cid Fernandes, R., Stasińska, G., Torres-Papaqui, J. P., Mateus, A., Sodré, L., Schoenell, W., Gomes, J. M., 2007, MNRAS, 381, 263
- Barvainis (1987) Barvainis, R. 1987, ApJ, 320, 537
- Baribaud et al. (1992) Baribaud, T., Alloin, D., Glass, I., & Pelat, D., 1992, A&A, 256, 375.
- Bica & Alloin (1987) Bica, E. & Alloin, D., 1987, A&A, 186, 49.
- Bica (1988) Bica, E. 1988, A & A, 195, 9.
- Bica et al. (1991) Bica, E., Pastoriza, M. G., da Silva, L. A. L., Dottori, H., Maia, M., 1991, AJ, 102, 1702
- Bonatto et al. (2000) Bonatto, C., Bica, E., Pastoriza, M. G. & Alloin, D., 2000, A&A, 355, 99
- Bonatto et al. (1998) Bonatto, C., Pastoriza, M. G., Alloin, D., Bica, E., 1998, A&A, 334, 439
- Bruzual & Charlot (2003) Bruzual, G. & Charlot, S., 2003, MNRAS, 344, 1000
- Cardelli, Clayton & Mathis (1989) Cardelli, J. A., Clayton, G. C., Mathis, J. S., 1989, ApJ, 345, 245
- Cid Fernandes & Terlevich (1995) Cid Fernandes, R., J.. & Terlevich, R., 1995, MNRAS, 272, 423.
- Cid Fernandes (1997) Cid Fernandes, R., 1997, RMxAC, 6, 201C.
- Cid Fernandes et al. (1998) Cid Fernandes, R., J.., Storchi-Bergmann, T., Schmitt, H. R., 1998, MNRAS, 297, 579
- Cid Fernandes et al. (2004) Cid Fernandes, R., Gu, Q., Melnick, J., Terlevich, E., Terlevich, R., Kunth, D., Rodrigues Lacerda, R., Joguet, B., 2004, MNRAS, 355, 273
- Cid Fernandes et al. (2005a) Cid Fernandes, R., Mateus, A., Sodré, Laerte, Stasińska, G., Gomes, J. M., 2005a, MNRAS, 358, 363 (CF05)
- Cid Fernandes et al. (2005b) Cid Fernandes, R., González Delgado, R. M., Storchi-Bergmann, T., Martins, L. Pires & Schmitt, H., 2005b, MNRAS, 356,270.
- Cid Fernandes et al. (2008) Cid Fernandes, R., Schoenell, W., Gomes, J. M., Asari, N V., Schlickmann, M., Mateus, A., Stasinska, G., Sodre, L., Torres-Papaqui, J. P., for the SEAGal collaboration, 2008, arXiv:0802.0849
- Cenarro et al. (2001) Cenarro, A. J.; Cardiel, N.; Gorgas, J.; Peletier, R. F.; Vazdekis, A.; Prada, F., 2001, MNRAS, 326, 959.
- Clavel, Wamsteker & Glass (1989) Clavel, J., Wamsteker, W., Glass, I. S., 1989, ApJ, 337, 236.
- Dors et al. (2008) Dors, O. L., Jr., Storchi-Bergmann, T., Riffel, R. A., Schimdt, Alex. A., 2008, A&A, 482, 59
- Davies et al. (2006) Davies, R. I.; Thomas, J.; Genzel, R.; S nchez, F. Mueller; Tacconi, L. J.; Sternberg, A.; Eisenhauer, F.; Abuter, R.; Saglia, R.; Bender, R., 2006, ApJ, 646, 754.
- Davies et al. (2007) Davies, R. I.; Sánchez, F. Mueller; Genzel, R.; Tacconi, L. J.; Hicks, E. K. S.; Friedrich, S.; Sternberg, A., 2007, ApJ, 671, 1388.
- Davies et al. (2009) R. Davies, W. Maciejewski, E. Hicks, L. Tacconi, R. Genzel, H. Engel, 2009, arXiv:0903.0313
- Engelbracht et al. (1998) Engelbracht, C. W., Rieke, M. J., Rieke, G. H., Kelly, D. M. & Achtermann, J. M., 1998, ApJ, 505, 639.
- Fathi et al. (2006) Fathi, K., Storchi-Bergmann, T., Riffel, R. A., Winge, C., Axon, D. J., Robinson, A., Capetti, A., Marconi, A., 2006, ApJ, 641, 25.
- Ferrarese & Merritt (2000) Ferrarese, L., & Merritt, D., 2000, ApJ, 539, L9
- Filippenko et al. (1993) Filippenko, A. V., Ho, L. C., Sargent, W. L. W., 1993, ApJ, 410, 75.
- Glass (1992) Glass, I., 1992, MNRAS, 256, 23P.
- Garcia-Rissmann et al. (2005) Garcia-Rissmann, A., Vega, L. R., Asari, N. V., Cid Fernandes, R., Schmitt, H., González Delgado, R. M., Storchi-Bergmann, T., 2005, MNRAS, 359, 765.
- Garcia-Vargas et al. (1989) Garcia-Vargas, M. L.; Diaz, A. I.; Terlevich, R.; Terlevich, E., 1989, Ap&SS, 157, 125.
- Gonçalves et al. (1999) Gonçalves, A. C., Véron-Cetty, M.-P., Véron, P., 1999, A&AS, 135, 437
- González-Delgado et al. (1998) Gonzalez Delgado R.M., Heckman T., Leitherer C., Meurer G., Krolik J., Wilson A.S., Kinney A., Koratkar A., 1998, ApJ, 505, 174.
- González-Delgado et al. (1998) González Delgado, R. M., Leitherer, C., Heckman, T., Lowenthal, J. D., Ferguson, H. C. & Robert, C., 1998, ApJ, 495, 698
- González-Delgado et al. (2001) González Delgado, R. M., Heckman, T. & Leitherer, C., 2001, ApJ, 546, 845
- González-Delgado et al. (2004) González Delgado, R. M., Cid Fernandes, R., Pèrez, E., Martins, L. P., Storchi-Bergmann, T., Schmitt, H., Heckman, T., Leitherer, C.,2004, ApJ, 605, 127.
- Granato & Danese (1994) Granato, G. L. & Danese, L., 1994, MNRAS, 268, 235.
- Heckman et al. (1997) Heckman T.M., Gonzalez-Delgado R.M., Leitherer C., Meurer G.R., Krolik J., Wilson A.S., Koratkar A., Kinney A., 1997, ApJ, 482, 114.
- Heckman (2004) Heckman, T. M., 2004, Coevolution of Black Holes and Galaxies, from the Carnegie Observatories Centennial Symposia. Published by Cambridge University Press, as part of the Carnegie Observatories Astrophysics Series. Edited by L. C. Ho, 2004, p. 358.
- Ho et al. (1997) Ho, L. C., Filippenko, A. V., Sargent, W. L. W., & Peng, C. Y. 1997, ApJS, 112, 391
- Hunt et al. (2003) Hunt, L. K., Thuan, T. X., Izotov, Y. I., 2003, ApJ, 588, 281.
- Iben & Renzini (1983) Iben, I. & Renzini, A. 1983, ARA&A, 21, 271.
- Imanishi (2002) Imanishi, M., 2002, ApJ, 569, 44.
- Imanishi & Dudley (2000) Imanishi, M., Dudley, C. C., 2000, ApJ, 545, 701.
- Joguet (2001) Joguet, B., Kunth, D., Melnick, J., Terlevich, R., Terlevich, E., 2001, A&A, 380, 19
- Jaffe et al. (2004) Jaffe, W. et al. 2004, Nature, 429, 47J.
- Keel (1983) Keel, W. C., 1983, ApJ, 269, 466.
- Knapen, Shlosman & Peletier (2000) Knapen, J. H., Shlosman, I. & Peletier, R. F., 2000, ApJ, 529, 93.
- Koski (1978) Koski, A.T., 1978, ApJ, 223, 56.
- Kishimoto (2007) Kishimoto, M., Hönig, S. F., Beckert, T. & Weigelt, G., 2007, A&A, 476, 713.
- Krüegel (2003) Krüegel, E., 2003, The Physics of Interstellar Dust(Bristol: IoP)
- Lançon & Wood (2000) Lançon, A. & Wood, P. R. 2000, A&AS, 146, 217.
- Lançon et al. (2001) Lançon, A., Goldader, J. D., Leitherer, C., & González Delgado, R. M., 2001, ApJ, 552, 150
- Marco & Alloin (1998) Marco, O.& Alloin, D., 1998, A&A, 336, 823.
- Marco & Alloin (2000) Marco, O.& Alloin, D., 2000, A&A, 353, 465
- Maiolino et al. (1997) Maiolino, R., Ruiz, M., Rieke, G. H., Papadopoulos, P., 1997, ApJ, 485, 552.
- Maraston (1998) Maraston, C., 1998, MNRAS, 300, 872.
- Maraston (2005) Maraston, C., 2005, MNRAS, 362, 799 (M05).
- Mariano et al. (2008) Marino, A. F., Villanova, S., Piotto, G., Milone, A. P., Momany, Y., Bedin, L. R., Medling, A. M., 2008, A&A, 490, 625.
- Mateus et al. (2006) Mateus, A., Sodré, L., Cid Fernandes, R., Stasińska, G., Schoenell, W., Gomes, J. M., 2006, MNRAS, 370, 721
- Mazzalay & Rodríguez-Ardila (2007) Mazzalay, X. & Rodríguez-Ardila, A., 2007, A&A, 463, 445
- Mizutani, Suto & Maihara (1994) Mizutani, K., Suto, H., Maihara, T., 1994, ApJ, 421, 475
- Miller & Goodrich (1990) Miller, J. S., & Goodrich, R. W. 1990, ApJ, 355, 456
- Moorwood & Glass (1982) Moorwood, A. F. M., Glass, I. S., 1982, A&A, 115, 84
- Nagao et al. (2004) Nagao, T., Kawabata, K. S., Murayama, T., Ohyama, Y., Taniguchi, Y., et al., 2004, AJ, 128, 2066
- Norman & Scoville (1988) Norman C., Scoville N., 1988, ApJ, 332, 124.
- Origlia, Moorwood & Oliva (1993) Origlia, L., Moorwood, A. F. M., Oliva, E., 1993,A&A, 280, 536.
- Oliva et al. (1995) Oliva, E., Origlia, L., Kotilainen, J. K., Moorwood, A. F. M., 1995, A&A, 301, 55.
- Origlia & Oliva (2000) Origlia, L. & Oliva, E., 2000, NewAR, 44, 257
- Paturel et al. (2003) Paturel, G., Petit, C., Prugniel, Ph., Theureau, G., Rousseau, J., Brouty, M., Dubois, P., Cambrésy, L., 2003, A&A, 412, 45
- Pogge (1989) Pogge, R. W., 1989, ApJS, 71, 433.
- Raimann et al. (2003) Raimann, D., Storchi-Bergmann, T., González Delgado, R. M., Cid Fernandes, R., Heckman, T., Leitherer, C., Schmitt, H., 2003, MNRAS, 339, 772.
- Ramos Almeida et al. (2009) Ramos Almeida, C.; Pérez García, A. M.; Acosta-Pulido, J. A., 2009, ApJ, 694, 1379.
- Rayner et al. (2003) Rayner, J. T., Toomey, D. W., Onaka, P. M., Denault, A. J., Stahlberger, W. E., Vacca, W. D., Cushing, M. C., & Wang, S. 2003, PASP, 155, 362
- Reunanen et al. (2003) Reunanen, J., Kotilainen, J. K. & Prieto, M. A., 2003, MNRAS, 343, 192.
- Rieke et al. (1980) Rieke, G. H., Lebofsky, M. J., Thompson, R. I., Low, F. J., Tokunaga, A. T., 1980, ApJ, 238, 24
- Riffel et al. (2006) Riffel, R., Rodríguez-Ardila, A., Pastoriza, M. G., 2006, A&A 457, 61.
- Riffel et al. (2007) Riffel, R., Pastoriza, M. G., Rodríguez-Ardila, A. & C. Maraston, 2007, ApJ, 659L, 103
- Riffel et al. (2008a) Riffel, Rogemar A., Storchi-Bergmann, T., Winge, C., McGregor, P. J., Beck, T., Schmitt, H., 2008a, MNRAS, 385, 1129.
- Riffel et al. (2008b) Riffel, R., Pastoriza, M. G., Rodríguez-Ardila, A. & C. Maraston, 2008b, MNRAS, 388, 803.
- Riffel et al. (2009) Riffel, Rogemar A., Storchi-Bergmann, T., Dors, O. L., Jr & Winge, C., 2009, MNRAS, 393, 783.
- Rodríguez-Ardila & Viegas (2003) Rodríguez-Ardila, A., Viegas, S. M., 2003, MNRAS, 340, 33
- Rodríguez-Ardila et al. (2005) Rodríguez-Ardila, A., Contini, M., Viegas, S. M., 2005, MNRAS, 357, 220.
- Rodríguez-Ardila & Mazzalay (2006) Rodríguez-Ardila, A., Mazzaly, Z., 2006, MNRAS, 367, L57.
- Rudy et al. (2000) Rudy, R. J., Mazuk, S., Puetter, R. C., Hamann, F. 2000, ApJ, 539, 166
- Santos-Lléo et al. (1995) Santos-Lléo, M., Clavel, J., Barr, P., Glass, I. S., Pelat, D., Peterson, B. M., & Reichert, G., 1995, MNRAS, 274, 1.
- Sarzi et al. (2007) Sarzi, M., Allard, E. L., Knapen, J. H.& Mazzuca, L. M., 2007, MNRAS, 380, 949.
- Sarzi et al. (2005) Sarzi, M., Rix, H. W., Shields, J. C., Ho, L. C., Barth, A. J., Rudnick, G., Filippenko, A. V., Sargent, W. L. W., 2005, ApJ, 628, 169.
- Shields et al. (2007) Shields, Joseph C., Rix, Hans-Walter, Sarzi, Marc, Barth, Aaron J., Filippenko, Alexei V., Ho, Luis C., McIntosh, Daniel H., Rudnick, Gregory, Sargent, Wallace L. W., 2007, ApJ,654, 125.
- Schmidt et al. (1991) Schmidt, A. A., Copetti, M. V. F., Alloin, D. & Jablonka, P., 1991, MNRAS, 249, 766.
- Schmitt et al. (1996) Schmitt, H. R., Bica, E., & Pastoriza, M. G. 1996, MNRAS, 278, 965
- Schmitt et al. (1999) Schmitt, H. R., Storchi-Bergmann, T. & Cid Fernandes, R., 1999, MNRAS, 303, 173.
- Shlosman, Frank & Begelman (1989) Shlosman, I., Frank, J. & Begelman, M. C., 1989, Natur, 338, 45.
- Shlosman, Begelman & Frank (1990) Shlosman, I., Begelman, M. C. & Frank, J., 1990, Natur, 345, 679.
- Storchi-Bergmann et al. (1993) Storchi-Bergmann, T., Baldwin, J. A., Wilson, A. S., 1993, ApJ, 410L, 11
- Storchi-Bergmann et al. (1997) Storchi-Bergmann, T., Eracleous, M., Ruiz, M. T., Livio, M., Wilson, A. S., et al., 1997, ApJ, 489, 87
- Storchi-Bergmann et al. (2000) Storchi-Bergmann, T., Raimann, D., Bica, E. L. D., Fraquelli, H. A., 2000, ApJ, 544, 747.
- Storchi-Bergmann et al. (2003) Storchi-Bergmann, T., Nemmen da Silva, R., Eracleous, M., Halpern, J. P., Wilson, A. S., Filippenko, A. V., Ruiz, M. T., Smith, R. C., Nagar, N. M., 2003, ApJ, 598, 956
- Storchi-Bergmann et al. (2005) Storchi-Bergmann, T., Nemmen, R. S., Spinelli, P. F., Eracleous, M., Wilson, A. S., Filippenko, A. V., Livio, M., 2005, ApJ, 624L, 13
- Thompson (1995) Thompson, R. I. 1995, ApJ, 445, 700
- Tokunaga et al. (1991) Tokunaga, A. T., Sellgren, K., Smith, R. G., Nagata, T., Sakata, A., Nakada, Y., 1991, ApJ, 380, 452.
- Tran (1995) Tran, H. D. 1995, ApJ, 440, 578
- Tran et al. (1992) Tran, H. D., Miller, J. S. & Kay, L. E. 1992, ApJ, 397, 452
- Terlevich et al. (1990) Terlevich E., Diaz A.I., Terlevich R., 1990, MNRAS, 242, 271.
- Vega et al. (2008) Vega, L. R., Asari, N. V., Cid Fernandes, R., Garcia-Rissmann, A., Storchi-Bergmann, T., González Delgado, R. M., Schmitt, H., 2008, arXiv:0809.3178
- Veilleux (2000) Veilleux S. 2001, in ”Starburst Galaxies: Near and Far”, Proceedings of a Workshop held at Ringberg Castle, Germany, 10-15 September, 2000. Edited by L. Tacconi and D. Lutz. Heidelberg: Springer-Verlag, 2001, p.88
- Veilleux et al. (1997) Veilleux, S., Goodrich, R. W. & Hill, G. J., 1997, ApJ, 477, 631.