Episodic accretion at early stages of evolution of low mass stars and brown dwarfs: a solution for the observed luminosity spread in HR diagrams?
Abstract
We present evolutionary models for young low mass stars and brown dwarfs taking into account episodic phases of accretion at early stages of the evolution, a scenario supported by recent large surveys of embedded protostars. An evolution including short episodes of vigorous accretion () followed by longer quiescent phases () can explain the observed luminosity spread in HR diagrams of star forming regions at ages of a few Myr, for objects ranging from a few Jupiter masses to a few tenths of a solar mass. The gravitational contraction of these accreting objects strongly departs from the standard Hayashi track at constant . The best agreement with the observed luminosity scatter is obtained if most of the accretion shock energy is radiated away. The obtained luminosity spread at 1 Myr in the HR diagram is equivalent to what can be misinterpreted as a 10 Myr age spread for non-accreting objects. We also predict a significant spread in radius at a given , as suggested by recent observations. These calculations bear important consequences on our understanding of star formation and early stages of evolution and on the determination of the IMF for young ( a few Myr) clusters. Our results also show that the concept of a stellar birthline for low-mass objects has no valid support.
1 Introduction
The significant luminosity spread observed in Hertzsprung-Russell (HR) diagrams of star forming regions (SFRs) and young clusters is a well known feature, which has been confirmed with the improvement of observational techniques (see Hillenbrand 2008 and references therein). Whether this luminosity spread arises from a physical process, observational uncertainties or reveals a significant age spread is a crucial question, with important consequences on our understanding of star formation (Hartmann 2001). This hypothetical age spread is used as an argument in favour of a slow star formation process, in conflict with other observational constraints and our current understanding of star formation (Hartman 2001; Ballesteros-Paredes & Hartmann 2007). Motivated by this controversy, we have conducted a systematic analysis of how accretion affects the evolution of young low mass stars (LMS) and brown dwarfs (BDs) in order to explore the sensitivity of evolutionary tracks to the early accretion history. In this Letter, we present the first consistent evolutionary models for young LMS and BDs taking into account non-steady accretion phases at very early stages of the evolution. We show that this scenario can explain at least partly the observed luminosity spread in HR diagrams, without invoking an age spread.
Current observational analysis of embedded protostars strongly suggest that accretion onto forming stars must be transient, with very large fluctuations (Dunham et al. 2008; Enoch et al. 2009; Evans et al. 2009). Enoch et al. (2009) find in three clouds a large population of low luminosity class I sources that aggravate the well known ”luminosity problem” (Kenyon et al. 1990). Long quiescent phases of accretion () interrupted by short episodes of high accretion () provide a consistent picture explaining both the large population of low luminosity class I sources and the small fraction of very luminous sources. Enoch et al (2009) also rule out drastic changes in the accretion rates from class 0 to class I, and in particular the standard picture of short ( yr) class 0 duration111 Standard estimates for ages and rates are yr and for class 0 and yr and for class I sources.. Evans et al. (2009) suggest that a star could assemble half its mass during a few episodes of high accretion, occurring throughout about 7% of the class I lifetime. The idea of non steady, time varying accretion rates is not new, since for decades FU Ori objects have been providing evidence for short episodes of rapid accretion at early stages of evolution, with rates much larger than the aforementioned typical class-0 infall rates for low mass objects (Kenyon & Hartmann 1995).
The calculations presented in this Letter are a theoretical formulation of such an evolution including phases of episodic accretion for proto- or young LMS and BDs. In §2, we briefly summarize the evolutionary models and the treatment of accretion; details will be presented in a forthcoming paper (Gallardo et al. 2009). Results and comparison with observations are presented in §3, followed by discussion and conclusion in §4.
| case | |||||||||
|---|---|---|---|---|---|---|---|---|---|
| A | 1 | 0.05 | 2860 | -2.15 | 2844 | -1.73 | 10-5 | 5 103 | 0 |
| B | 1 | 0.1 | 3157 | -1.63 | 3001 | -1.16 | 10-5 | 104 | 0 |
| C | 1 | 0.2 | 3320 | -1.27 | 3193 | -0.69 | 10-5 | 2 104 | 0 |
| D | 1 | 0.5 | 3756 | -0.75 | 3426 | -0.28 | 5 10-5 | 104 | 0 |
| E | 1 | 0.1 | 3000 | -1.16 | 3001 | -1.16 | 10-5 | 104 | 0.2 |
| F | 1 | 0.1 | 2998 | -1.16 | 3001 | -1.16 | 10-5 | 104 | 1 |
| G | 5 | 0.1 | 3051 | -1.53 | 3001 | -1.16 | 10-5 | 104 | 0 |
| H | 10 | 0.21 | 3221 | -1.20 | 3201 | -0.67 | 10-5 | 2 104 | 0 |
| I | 50 | 0.55 | 3571 | -0.59 | 3468 | -0.22 | 10-5 | 5 104 | 0 |
| J | 50 | 1.05 | 4102 | -0.32 | 3840 | 0.17 | 5 10-5 | 2 104 | 0 |
| K | 100 | 1.1 | 3961 | -0.03 | 3870 | 0.20 | 5 10-5 | 2 104 | 0 |
| L | 100 | 1.85 | 4677 | 0.31 | 4377 | 0.60 | 5 10-5 | 3.5 104 | 0 |
2 Evolutionary models and treatment of accretion
The evolutionary calculations for LMS and BDs are based on the Lyon stellar evolution code with input physics described in Chabrier & Baraffe (1997) and Baraffe et al. (1998). The treatment of accretion is based on a simplified 1D approach, adopting similar assumptions and simplifications as Hartmann et al. (1997) and Siess et al. (1997). We assume that accretion onto the central object rapidly proceeds non-spherically, affecting only a small fraction of the contracting object’s surface. The object can thus freely radiate its energy over most of its photosphere (see Hartmann et al. 1997 and references therein). The accreting material brings, per unit mass, a gravitational energy and an internal energy , i.e. an energy rate:
| (1) |
The value of depends on the details of the accretion process, with for gravitationally bound material and if gas accretes from a thin disk at the object’s equator (Hartmann et al. 1997). We denote () the fraction of accreting internal energy absorbed by the proto-star/brown dwarf, which thus contributes to its heat content. The total additional energy rate gained by the accreting object and the accreting luminosity radiated away thus read, respectively, for (see e.g. Hartmann et al. 1997):
| (2) |
The case corresponds to accreted matter arriving on the object’s surface with a lower specific entropy than the object’s one.
3 Results
3.1 Exploring accretion rates
We have conducted evolutionary calculations taking into account the effect of accretion on proto low mass objects for a wide range of initial proto-star/BD masses from ( 1 ) to 0.1 , with arbitrary large initial radii between and . The results are compared to recent surveys of LMS and BDs between 0.01 and 1 in various SFRs, with characteristic ages of a few Myr, namely Taurus and Chamaeleon I (Muzerolle et al. 2005), Ophiucus (Gatti et al. 2006), Orion molecular cloud (Peterson et al. 2008), -Orionis (Gatti et al. 2008). Given the loose constraints on accretion rates at early times, during the class 0 and class I embedded phases, we have explored a wide range of mass accretion rates and time dependences, and considered different values of . We have considered (1) constant rates, (2) exponentially time-decreasing rates and (3) rates obeying the empirical mass dependence observed in young clusters (Mohanty et al. 2005, Herczeg & Hillenbrand 2008). The strong constraint of our calculations is to be consistent with the observed rate determinations at an age of a few Myr.
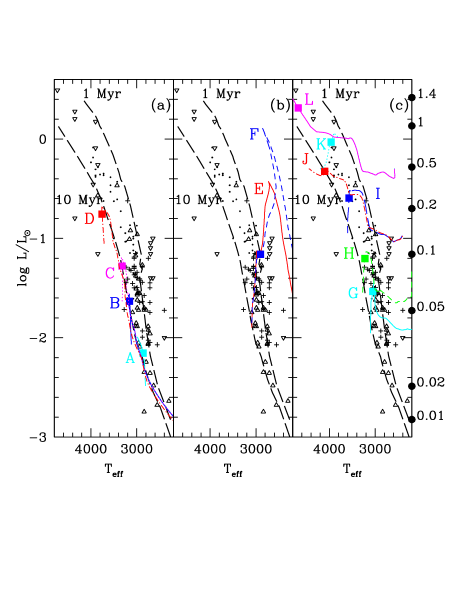
We find that assuming initial accretion rates , as traditionally used in protostellar evolutionary models (Myers et al. 1998; Young & Evans 2005), produces too small a luminosity scatter in HR diagrams after a few Myr to explain the observed spread. More severe effects are obtained when adopting higher accretion rates, , during the first few to years of evolution, depending on the mass. Fig. 1 shows the effect of such high early accretion rates on the evolution of low-mass objects for different initial masses . Evolution proceeds as time increases from the right to the left part of the HR diagram for a given track. The tracks of the accreting objects are displayed up to an age of 10 Myr with the locations at 1 Myr indicated by the solid squares. The evolutionary sequences start from large initial radii and thus with short thermal timescales, yr, of the order of or less than the accretion timescale . Consequently, variations of the initial radius by a factor 2-3 have no significant effect on the overall evolution, barely changing the final location at 1 Myr. The parameters of the various sequences are given in Table 1.
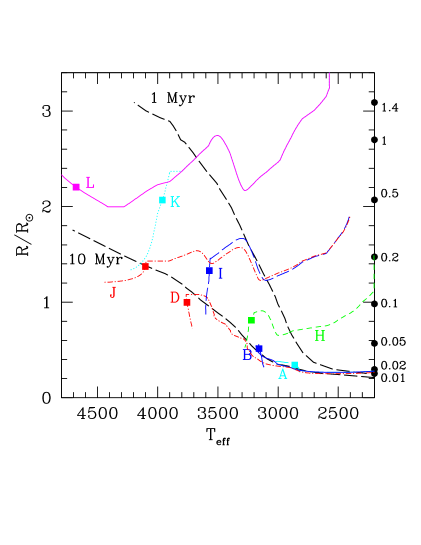
For =0, i.e. if all the accreting energy is radiated away, the aforementioned high accretion rates yield significantly smaller radii than the ones of non accreting objects of same mass and age. This stems from the fact that, as mass builds up, the object’s thermal timescale rapidly increases, and becomes much longer than the accreting timescale , so that rapid increase of gravitational energy is the only possibility to adjust to the accreting energy flow. For example, the case B sequence (solid blue line in Figs. 1a and 2) starts its evolution with and yr. At 104 yr, when accretion is arbitrarily stopped, the object has a mass 0.1 , a radius , a luminosity and a thermal timescale yr. Similar results are obtained for all the other sequences starting from larger initial masses. The radius of these accreting objects is thus already smaller after a few yr than the one of the non-accreting counterparts of same mass at an age of 1 Myr (see Fig. 2). The objects will eventually slowly contract toward their location on the HR diagram at 1 Myr after the high accretion phase has been stopped, looking much fainter than the non-accreting 1 Myr old objects (see Fig. 1). The spread in luminosity obtained in Fig. 1 thus essentially reflects a spread in radius, as illustrated in Fig. 2. Note that we find similar results if we apply smaller, non-zero accretion rates, , after the strong accretion phase, while fulfilling the condition to recover typical observed rates at 1 Myr.
For the case , i.e if some fraction of the accretion energy contributes to the proto-star/BD thermal content, the spread at 1 Myr is smaller than for the =0 case. Assuming =1/2 in Eq. (2), characteristic of accretion from a thin disk (see §2), we find that for , the contraction of the structure due to mass accretion is partly compensated by this energy input, yielding a less drastic contraction. The objects are still slightly fainter at 1 Myr than their non-accreting counterparts, but the effect is not as significant as in the =0 case. For , the effect of the extra accreting energy contribution to the protostar heat content becomes dominant and the evolution now mostly proceeds at higher luminosity (see Fig. 1b) and larger radius than for non-accreting objects. This in turn implies shorter thermal timescales, so that once high accretion rates are stopped or significantly decreased to recover the observed values at 1 Myr, the object quickly contracts and reaches a position at 1 Myr in the HR diagram very close to the non accreting location. In order to maintain a high luminosity and radius after 1 Myr, i.e a location in the HR diagram above the 1 Myr non accreting isochrone, too large accretion rates (and large values of ) have to be maintained, inconsistent with observations of class II objects at this age.
3.2 Episodic accretion
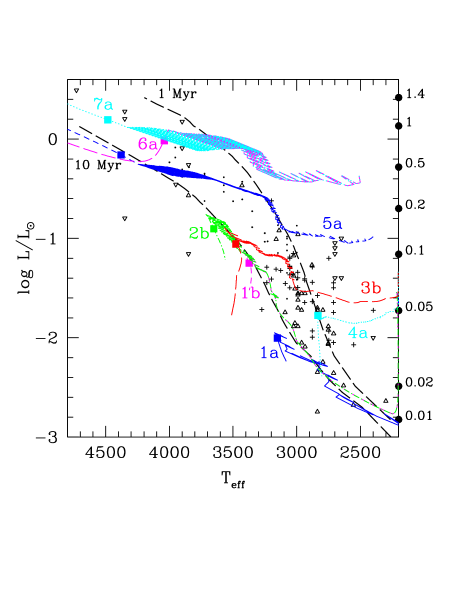
The exploratory analysis presented in the previous section demonstrates that the early accretion history still significantly affects the evolution of contracting objects after a few Myr. In this section, we show that the effects of accretion are similar, whether the object accretes continuously an amount of mass at a constant rate during yr, as examined in §3.1, or whether it accretes the same amount of mass during a succession of short episodes of high accretion rates, , interrupted by longer quiescent phases. As mentioned in §1, episodic accretion seems to provide the most consistent explanation for current observations of protostars, while a short ( yr) accretion phase based on previous estimates of class 0 lifetimes, with accretion rates significantly decreasing during the subsequent class I phase, seems to be ruled out (Enoch et al. 2009; Evans et al. 2009). Several theoretical scenarios have been suggested to explain phases of non-steady accretion (Kenyon & Hartmann 1995; Vorobyov & Basu 2005; Zhu et al. 2008; Tassis & Muschovias 2005). We adopt here a burst mode as suggested by Vorobyov & Basu (2005) to explore the effect of episodic accretion on the structure of proto-stars/BDs. We assume an arbitrary number of bursts, , with typical accretion rate and duration yr, interrupted by quiescent phases of duration = 1000-5000 yr (see Vorobyov & Basu 2005). During the quiescent phases, we adopt =0 as a simplification222Adopting rates provides the same qualitative results and does not affect our conclusions.. We have explored two possibilities for the beginning of the burst phase (cases a and b described in Table 2). The results are displayed in Fig. 3. The burst phases are characterised by evolutionary tracks which follow an erratic behavior with abrupt variations of and . Our calculations show that, depending on , and , it is possible to populate the region in the HR diagram after 1 Myr or less between the (non-accreting) 1 Myr and 10 Myr isochrones, producing a natural spread in luminosity. For values of , the evolution is severely affected while for smaller rates, the structure is only moderately affected and the object has time to relax once episodic accretion stops, having properties at 1 Myr similar to the non accreting counterpart of same mass and age. This is illustrated by case 4a (see Table 2) in Fig. 3 (cyan dotted curve), with . Similar evolutionary properties are obtained adopting case or for the beginning of the burst phase. The duration of the quiescent phase is found to be inconsequential and can be increased from 103 yr to 104 yr without significant effects. This reflects the fact that the thermal timescale of the accreting object rapidly exceeds values yr. The contracting object has thus no time to relax to a larger radius state for its new mass if quiescent phases last less than 104 yr. For typically 10 to 100 burst episodes, this means that episodic accretion can last a few 105 yr, in agreement with recent revised estimates of class 0 and class I lifetimes (Enoch et al. 2009; Evans et al. 2009).
| case | |||||||||
|---|---|---|---|---|---|---|---|---|---|
| 1a | 1 | 0.1 | 3151 | -2.00 | 3001 | -1.16 | 10-4 | 1 | 10 |
| 1b | 1 | 0.2 | 3373 | -1.25 | 3193 | -0.69 | 10-4 | 1 | 10 |
| 2b | 1 | 0.41 | 3650 | -0.90 | 3384 | -0.46 | 10-4 | 1 | 30 |
| 3b | 10 | 0.38 | 3466 | -1.05 | 3335 | -0.43 | 10-4 | 1 | 30 |
| 4a | 10 | 0.05 | 2833 | -1.77 | 2844 | -1.73 | 10-5 | 5 | 50 |
| 5a | 50 | 1.35 | 4379 | -0.16 | 4152 | 0.37 | 10-4 | 1 | 150 |
| 6a | 100 | 1.16 | 4039 | 0.00 | 3924 | 0.23 | 3 10-4 | 1 | 40 |
| 7a | 100 | 1.67 | 4482 | 0.19 | 4317 | 0.53 | 3 10-4 | 1 | 60 |
4 Discussion and conclusion
The main results presented in §3 can be summarized as follows: (i) for , an accreting object has a more compact structure at a few Myr, i.e a smaller radius and thus a smaller luminosity - looking older -, than the non-accreting counterpart of same mass and age; (ii) if a fraction of the accretion energy is absorbed by the protostar interior (), this extra energy source partly compensates or, for (assuming =1/2), even dominates the contraction due to mass accretion, leading in the latter case to a larger radius than the non-accreting object of same mass and age. Our results show that a scenario based on early stages of non-steady accretion, characterized by short duration (a few 100 yr) episodes of vigorous accretion (), followed by longer quiescent () phases, naturally produces a spread in the HR diagram at ages of a few Myr, providing non spherical accretion (through disk or funnels) occurs on a variety of proto-star/BD initial masses, from a few to a few tenths of . This scenario can easily produce a luminosity spread equivalent to an age spread of 10 Myr (for non-accreting objects), even though the objects are just 1 or so Myr old. We find that such a spread can be obtained if only a negligible amount of the accretion energy contributes to the contracting object’s internal energy (), i.e if most of the accreting kinetic energy is radiated away.
Our scenario, however, cannot explain the observed population of very luminous low mass objects, which lie largely above the 1 Myr non-accreting isochrone, as displayed in Figs. 1 and 3. As discussed in §3.1, calculations with cannot maintain luminous objects at ages of Myr, with accretion rates consistent with the observed ones at this age, because of the too short thermal timescale. It thus seems difficult to explain the luminosity of these objects with accretion. A possible explanation is that they are significantly younger ( 1 Myr) than the mean cluster age and experienced their episodic accretion phase quite recently. Another explanation, as discussed in Chabrier et al. (2007), is that fast rotation and/or the presence of a magnetic field yields a smaller heat flux output, thus (i) a larger radius and (ii) a cooler , while barely affecting the luminosity, for a given mass. The net effect would be to shift the location of 1 Myr old objects of a given mass at cooler for a given , and thus on the right side of the 1 Myr non-accreting isochrone. Note that this may apply as well to the other (hotter) objects, even though there is no need to invoke such a process to reproduce their luminosity. This suggestion should motivate observational determinations of the rotation velocity and the level of magnetic activity of these over-luminous objects. The present analysis supports the conclusion of Mohanty et al. (2009) on the origin of the reversal in the young eclipsing binary brown dwarf 2M0535-05, which excludes an explanation based on prior accretion. At last, another explanation for the location of these objects in the HR diagram is a less reliable photometry. All the over-luminous objects in the Peterson et al. (2008) sample, for instance, are located in a region of the Orion Molecular Cloud with very high nebulosity (D. Peterson, priv. comm.).
The suggestion, as explored in this Letter, that episodic accretion provides a plausible explanation for the observed spread in HR diagrams at ages of a few Myr (see §1), is supported by recent observations of protostars (Enoch et al. 2009; Evans et al. 2009). Furthermore, our predicted significant spread in radius at ages of Myr (see Fig. 2) is consistent with the recently suggested existence of such a spread in the ONC, based on the rotation periods and projected radial velocities of low mass objects (Jeffries 2007). Episodic accretion thus seems to provide several matching pieces to the puzzle describing the early evolution of LMS and BDs. If our suggestion is correct, it has several drastic consequences: (1) what was interpreted as a significant age spread in SFRs or young clusters is essentially a spread in radius, thus in luminosity, for objects of comparable ages, (2) if young low-mass objects have experienced strong episodes of accretion during their embedded (class 0 to I) phase, their contraction proceeds very differently from a standard, constant , Hayashi track and still keep memories of these early episodes after about a few Myr, even if present accretion rates are negligible, (3) trying to infer the mass, thus an IMF, for young ( old) clusters from mass-luminosity or mass--Sp type relationships based on non-accreting objects/models very likely leads to results of low significance, and inferring the IMF for such young associations seems to be elusive. At this stage, determination of the proto-star/BD core mass function (CMF) with submillimeter surveys will bring more robust information about the star formation process and the stellar mass spectrum (see e.g. Hennebelle & Chabrier 2008, 2009). Finally, the present calculations show that the concept of a stellar birthline has no real significance, at least for low-mass objects, as the first appearance of these objects in a HR diagram is very random, due to the variety of prior accretion histories.
References
- (1) Ballestero-Paredes, J., Hartmann, L. 2007, RMxAA, 43, 123
- (2) Baraffe, I., Chabrier G., Allard F.,
- (3) Chabrier, G., & Baraffe, I. 1997, A&A, 327, 1039
- (4) Chabrier, G., Gallardo, J., Baraffe, I. 2007, A&A, 472, L17
- (5) Dunham, M.M., Crapsi, A., Evans, N.J. et al. 2008, ApJS, 179, 249
- (6) Enoch, M.L., Evans, N.J., Sargent, A.I., Glenn, J. 2009, ApJ, 692, 973
- (7) Evans, N.J., Dunham, M.M., Jorgensen, J.K. et al. 2009, ApJS, in press, arXiv:0811.1059
- (8) Gallardo, J., Baraffe, I., Chabrier, G. 2009, A&A, submitted
- (9) Gatti, T., Testi, L., Natta, A., Randich, S., Muzerolle, J. 2006, A&A, 460, 547
- (10) Gatti, T., Natta, A., Randich, S., Testi, L., Sacco, G. 2008, A&A, 423, 432
- (11) Hartmann, L. 2001, AJ, 121, 1030
- (12) Hartmann, L., Cassen, P., Kenyon, S.J. 1997, ApJ, 475, 770
- (13) Herczeg, G.J., Hillenbrand L. 2008, ApJ, 681, 594
- (14) Hennebelle, P. & Chabrier, G. 2008 ApJ, 684, 395
- (15) Hennebelle, P. & Chabrier, G. 2009, ApJ, in press
- (16) Hillenbrand, L. 2008, IAU Symp. 258, eds. E Mamajek, D. Soderblom, R. Wyse ed. G. van Belle, p. 200
- (17) Jeffries, R. D. 2007, MNRAS, 381, 1169
- (18) Kenyon, S.J., Hartmann, L., Strom, K.M., Strom, S.E. 1990, AJ, 99, 869
- (19) Kenyon, S. J., Hartmann, L. 1995 ApJ, 101, 117
- (20) Mohanty, S., Jayawardhana, R., Basri, G. 2005, ApJ, 626, 498
- (21) Mohanty, S., Stassun, K.G., Mathieu, R. 2009, ApJ, in press
- (22) Muzerolle, J. et al. 2005, ApJ, 625, 906
- (23) Myers, P. C. et al. 1998, ApJ, 492, 703
- (24) Peterson, D. et al. 2008, ApJ, 685
- (25) Siess, L. et al. 1997, A&A, 326, 1001
- (26) Tassis, K., Mouschovias, T.C. 2005, ApJ, 618, 769
- (27) Vorobyov, E.I., Basu, S. 2005, ApJ, 633, L137
- (28) Young, C. H., Evans, J.E. 2005, ApJ, 627, 293
- (29) Zhu, Z., Hartmann, L., Gammie, C. 2008, ApJ, in press, arXiv:0811.1762