Primordial Core-Collapse Supernovae and the Chemical Abundances of Metal-Poor Stars
Abstract
The inclusion of rotationally-induced mixing in stellar evolution can alter the structure and composition of presupernova stars. We survey the effects of progenitor rotation on nucleosynthetic yields in Population III and II supernovae using the new adaptive mesh refinement (AMR) code CASTRO. We examine piston-driven spherical explosions in 15, 25 and 40 stars at and with three explosion energies and two rotation rates. Rotation in the models resulted in primary nitrogen production and a stronger hydrogen burning shell which led all models to die as red supergiants (in contrast to the blue supergiant progenitors made without rotation). On the other hand, the models that included rotation ended their lives as compact blue stars. Because of their extended structure, the hydrodynamics favors more mixing and less fallback in the metal free stars than the models. As expected, higher energy explosions produce more enrichment and less fallback than do lower energy explosions, and at constant explosion energy, less massive stars produce more enrichment and leave behind smaller remnants than do more massive stars. We compare our nucleosynthetic yields to the chemical abundances in the three most iron-poor stars yet found and reproduce the abundance pattern of one, HE 0557-4840, with a zero metallicity 15 , erg supernova. A Salpeter IMF averaged integration of our yields for models with explosion energies of ergs or less is in good agreement with the abundances observed in larger samples of extremely metal-poor stars, provided 15 stars are included. Since the abundance patterns of extremely metal-poor stars likely arise from a representative sample of progenitors, our yields suggest that 15-40 core-collapse supernovae with moderate explosion energies contributed the bulk of the metals to the early universe.
Subject headings:
Supernovae, nucleosynthesis, first stars1. Introduction
Early chemical enrichment of the universe began with the deaths of the first stars at 20 - 30 (Mackey et al., 2003; Kitayama & Yoshida, 2005; Greif et al., 2007; Karlsson et al., 2008; Whalen et al., 2008). The nature of the first stars, and hence the primordial initial mass function (IMF), is yet to be observationally constrained, but numerical models that proceed from well-posed cosmological initial conditions suggest that they are very massive, from 25 - 500 (Bromm et al., 1999, 2002; Nakamura & Umemura, 2001; Abel et al., 2000, 2002; O’Shea & Norman, 2007; Wise & Abel, 2007). The non-rotating stellar evolution models of Heger & Woosley (2002) predict that 15 - 40 Population III (Pop III) stars die in conventional core-collapse supernovae, while 140 - 260 stars explode as much more energetic pair-instability supernovae. For this reason, 15 - 40 Pop III stars are considered to be ”low-mass” primordial stars and 140 - 260 stars are termed ”very massive” stars. Although direct observation of the first stars is not yet possible, clues to their nature may be extracted from their nucleosynthetic imprint on second-generation stars. The gas enriched by Population III stars is thought to be able to form low-mass stars that may still exist, retaining the chemical imprint of their progenitors. Fossils of this second generation of stars are now being sought in surveys of extremely metal-poor (EMP) and hyper metal-poor (HMP) stars in the Galactic halo (Beers & Christlieb, 2005; Frebel et al., 2005). HMP stars, with [Fe/H] , are thought to be enriched by only one or a few SNe. EMP stars, with [Fe/H], are more plentiful and show a smaller scatter in their abundance ratios, implying that they formed from gas that had been enriched by a representative sample of SNe.
Many attempts have been made to reproduce the abundance patterns in EMP and HMP stars by modeling the evolution and explosion of massive stars, and comparing the yields to observations (Nomoto et al., 2006; Umeda & Nomoto, 2002, 2003, 2005; Joggerst et al., 2009), and in doing so, gain a better understanding of the nature of the first stars. Some studies have focused on the potential role of very massive stars that die as pair-instability supernovae; others suggest that very energetic hypernova explosions may be responsible for these abundance patterns. Although constraints have been placed on the energy and origin of the explosion within the star and theoretical progress has been made (Burrows et al., 2006; Murphy & Burrows, 2008; Marek & Janka, 2009), the explosion mechanism that operates in this first generation of stars is not well understood. Furthermore, core-collapse SNe leave compact remnants onto which the outer layers of the star may fall, preventing their escape and enrichment of the next generation of stars. The degree to which the layers of the star are mixed by the Rayleigh-Taylor (RT) instability prior to shock breakout from the surface of the star, together with the amount of material that falls onto the central remnant, governs the final yield of the SN.
The large one-dimensional explosion surveys performed to date (Iwamoto et al., 2005; Tominaga et al., 2007; Heger & Woosley, 2008) are forced to approximate these inherently multidimensional processes by artificially mixing the layers of the star and selecting a “mass cut” that denotes the line between the inner material that falls back onto the central compact object and the outer material that escapes. Two-dimensional models have been constructed to obtain more accurate chemical yields for core-collapse SNe and to constrain one dimensional parameterizations of these explosions. Tominaga (2009) investigated one explosion mechanism, jet-induced explosions, with two-dimensional simulations of a 40 primordial star and found good agreement using angle-delimited yields to the abundance pattern in one HMP star, but was not as sucessful in reproducing the abunace patterns in EMP stars.
Previous studies of mixing in core-collapse supernovae were largely focused on replicating observations of SN1987A. The most sucessful of these were the studies of Kifonidis et al. (2003) and Kifonidis et al. (2006), which modeled the explosion in more detail and from earlier times than previous studies.
The first paper in this series (Joggerst et al., 2009) modeled spherical explosions of non-rotating 15 and 25 Population III stars with the FLASH code. These stars ended their lives as compact blue supergiants, and experienced far less mixing and more fallback than the larger-radius solar metallicity red supergiants also modeled in Joggerst et al. (2009). The non-rotating Population III model yields achieved only partial agreement with the abundances in the most metal-poor stars ever detected. In particular, they did not reproduce the amount of nitrogen observed in HMP stars because it was not present in the initial pre-supernova progenitor models in sufficient quantities. The zero-metallicity explosions in this suite also manifested a high degree of fallback and a low degree of mixing, less than what had previously been assumed in the one-dimensional models. These two factors resulted in even greater [C+O/Fe] ratios than those in the HMP stars, and failed to match the abundance patterns observed in the larger sample of EMP stars.
Replicating abundances, particularly of N, in EMP and HMP stars may require rotationally-induced mixing prior to the destruction of the star. Recent simulations of Population III stellar evolution up to the point of explosion by Ekström et al. (2008) have demonstrated that rotationally-induced mixing boosts burning in the H-shell after the star has left the main sequence, increasing production by as much as a factor of and expanding the outer envelope of the star. The larger outer envelope in rotating models will impact post-explosion dynamics in the star, allowing mixing to occur on longer timescales and perhaps producing more enrichment than in non-rotating models.
In this, the second of a series of papers on elemental yields and mixing in Population III supernovae, we examine rotating models in two-dimensional simulations to determine if they are responsible for the elemental patterns discovered in the EMP/HMP star surveys. These studies may also be used to constrain estimations of mixing and fallback for large ensembles of one dimensional supernova models like those of Heger & Woosley (2008). While these rotating progenitor models do not take rotationally-induced mass loss into account, and our explosions are spherical and not asymmetric (as may well be the case) these effects may have less impact on the stellar yield than the radius of the star at the time of its death. Our rotating models die as significantly larger, redder stars than the non-rotating models of Joggerst et al. (2009), and we anticipate that this will lead to significantly enhanced mixing and reduced fallback, and thus higher yields, as compared to non-rotating models.
This survey is more complete in other respects. Our models capture mixing and fallback for a wider variety of progenitor masses, explosion energies, rotation rates, and metallicities than the previous survey. We include odd-numbered elements that were not included in our first survey, allowing for more detailed comparisons with EMP and HMP abundances. The greater number of elements also lays the groundwork for future light curve and spectroscopic studies of these supernovae. Our current study employs a new code, CASTRO, which can better handle the larger number of elements and will be more easily adapted to future studies than FLASH.
In § 2 we describe the new multi-dimensional Eulerian hydrodynamics code CASTRO used to model the explosions. We describe the one-dimensional KEPLER models on which our simulations are based and outline our parameter survey in § 3 and analyze the chemical yields of our simulation campaign in § 4. These yields are discussed and compared with chemical abundance measurements in HMP and EMP stars in § 5. In § 6 we conclude.
2. Numerical Algorithms
The explosion models in this study were implemented in two stages. First, one-dimensional supernova profiles for the progenitors were computed in the KEPLER code to capture all explosive nucleosynthetic burning. These profiles were then mapped onto a two-dimensional R-Z (axisymmetric) grid in the new CASTRO hydrodynamics code and evolved out to radii where Rayleigh-Taylor (RT) mixing ceased and the star was expanding essentially homologously. We computed thirty-six such models, covering 3 masses, 3 explosion energies, 2 metallicities, and 2 rotation rates.
2.1. CASTRO
CASTRO (Almgren et al., 2010) is a multi-dimensional Eulerian AMR hydrodynamics code. Time integration of the hydrodynamics equations is based on a higher-order, unsplit Godunov scheme. CASTRO can perform calculations in one dimensional radial, two dimensional cylindrical, or three dimensional Cartesian coordinates; all simulations in this paper were performed in two dimensions with cylindrical coordinates.
2.1.1 Equation of State
CASTRO can follow an arbitrary number of isotopes or elements. The atomic weights and amounts of these elements are used to calculate the mean molecular weight of the gas required by the equation of state. We followed the elements from hydrogen through zinc, so that our elemental yields could be compared with observations of abundances in metal-poor stars. was followed separately in order to calculate the energy deposited by radioactive decay of and .
The equation of state in our simulations assumed complete ionization and included contributions from both radiation and ideal gas pressure:
| (1) |
| (2) |
where is the pressure, is the radiation constant, is Boltzmann’s constant, is the temperature, is the density, is the proton mass, is the mean molecular weight, and is the energy. The function is a measure of the contribution of radiation pressure to the equation of state. It is 1 in regions where radiation pressure is important, i. e. where gas is optically thick, and 0 in regions where radiation pressure is unimportant, i. e. where gas is optically thin, with a smooth transition in between. The function takes the form
where is the temperature at which contributions to the pressure from radiation are negligable at 100 times less than that contributed by ideal gas pressure:
| (3) |
Above this temperature, contributions to the pressure from radiation will begin to dominate the equation of state, even though radiation pressure is unimportant in optically thin regions. Damping the radiation component of the EOS in optically thin regions prevented it from dominating in regions where it is not important.
2.1.2 Radioactive Decay of
Energy from the radioactive decay of 56Ni to 56Fe was deposited locally at each mesh point. The energy deposition rate from the decay of to was:
| (4) |
The decay rate of , , is s-1, and the amount of energy released per gram of decaying is , which we set to erg g-1 (Woosley, 1988). is the mass fraction of in the cell. The mass fraction of at a given time can be expressed in terms of the mass fraction of initial by
| (5) |
so that the energy deposition rate from is
| (6) |
We used a decay rate s-1 and an energy per gram of decaying , , equal to erg g-1 (Woosley, 1988).
2.1.3 Gravity
CASTRO supports several different approaches to solving for self-gravity. In the calculations presented here, we applied the monopole approximation for gravity. A radial average of the density was taken from the two-dimensional grid to create a one-dimensional density profile. This profile was then used to compute a one-dimensional gravitational potential which was then mapped back onto the two-dimensional grid. Since perturbations from spherical symmetry in the densities are very small, this approximation has a negligible effect on the final state of the calculation. A comparison between the monopole gravity solver and the full multigrid solver can be found in Almgren et al. (2010). The radial approximation to the gravitational potential has the advantage of being nearly as accurate as a multigrid solution for these explosions, but is much faster.
Gravity from a point mass located at the origin was also included in the gravitational potential. The point mass represents the compact remnant left behind by the SN explosion. As infalling matter crosses the zero-gradient inner boundary near the origin, it is added to this point mass.
2.1.4 CASTRO AMR
The adaptive mesh refinement algorithm in CASTRO uses a nested hierarchy of logically-rectangular grids with simultaneous refinement of the grids in both space and time. The integration algorithm on the grid hierarchy is a recursive procedure in which coarse grids are advanced in time, fine grids are advanced multiple steps to reach the same time as the coarse grids, and the data at different levels are then synchronized.
There is a regridding step in which increasingly finer grids are recursively embedded in coarse grids until the solution is sufficiently resolved. CASTRO uses as its default refinement criteria the “error estimator” of Löhner (1987), which is essentially the ratio of the second derivative to the first derivative at the point at which the error is evaluated. Details of the implementation in various geometries are discussed more fully in Almgren et al. (2010). The result is a dimensionless, bounded estimator, which allows arbitrary variables to be used with preset error indicators.
We used density, pressure, velocity, and the abundances of , He, and O as our refinement variables. We slightly modified the refinement criteria for elemental abundance so that they were applied only in regions where the abundance was greater than . Regions with abundances of an element lower than were not marked for refinement on the basis of elemental abundance alone.
We also modified the refinement criterion for density. In order to control extraneous refinement as the star expanded on the grid, regions below a certain density were not marked for refinement below a certain refinement level. We chose a minimum “mass” at which refinement could occur, which was the same for all the simulations. The minimum density as a function of refinement level at which a cell can be tagged for refinement is given by
| (7) |
where is the minimum density at which refinement can occur at a given refinement level and is the area of the cell at the refinement level. The factor of was chosen because it kept refinement at the outer edge of the star to a reasonable level, where it was resolved with approximately the same number of cells as the outer edge of the helium shell, without losing important detail in the RT instabilities.
2.1.5 Initialization of Multidimensional Data
In mapping the radial data from KEPLER onto the two-dimensional axisymmetric grid in CASTRO, special care was taken to properly resolve the key elements of the simulations: the shock, the elemental shells, and the Fe core. In particular, both the Fe core and the O shell were resolved with a minimum of 16 cells. Doubling the resolution produced no essential change to the solution. Mixing ceased at same time, and the final distribution of elements as a function of mass was the same for simulations in which the Fe core was resolved with 16 cell and 32 cells. The one-dimensional mapping results in explosions that are spherically symmetric in CASTRO: low-order departures from spherical symmetry are not included in the initial conditions, and do not develop in the course of the simulation.. Our models therefore only capture asymmetries of mode greater than or 2 in the explosions.
3. Progenitor Models
| model | (gm cm2s-1) 111Total angular momentum with which model was intialized | % vθ,crit |
|---|---|---|
| z15-5 | 6.1407E+51 | 15.5 |
| z25-5 | 6.1407E+51 | 6.2 |
| z40-5 | 6.1407E+51 | 2.8 |
| u15-5 | 6.1407E+51 | 11.3 |
| u25-5 | 6.1407E+51 | 4.6 |
| u40-5 | 6.1407E+51 | 2.1 |
| z15-10 | 1.2281E+52 | 31.5 |
| z25-10 | 1.2281E+52 | 12.4 |
| z40-10 | 1.2281E+52 | 5.5 |
| u15-10 | 1.2281E+52 | 23.3 |
| u25-10 | 1.2281E+52 | 9.2 |
| u40-10 | 1.2281E+52 | 4.1 |
To create the explosion profiles that were mapped into CASTRO, the one-dimensional Lagrangian stellar evolution code KEPLER (Weaver et al., 1978; Woosley et al., 2002) was first used to evolve the progenitors through all stable stages of nuclear burning, up until their iron cores became unstable to collapse. At this point SN explosions were artificially initiated by means of a piston at constant Lagrangian mass coordinate that moved though the star with a specified radial history. The models presented in this paper used a piston located at the radius where the entropy was equal to baryon, which corresponded roughly to the base of the oxygen shell. The models were then evolved until all nuclear burning was completed ( 100 s after the start of the explosion) but prior to the exit of the forward shock from the helium shell (and hence before the formation of the reverse shock). Energy generation was followed with a 19-isotope network up to the point of oxygen depletion in the core of the star and with a 128 isotope quasi-equilibrium network thereafter. Rotation was included in the models, which had the effect of increasing mixing in semiconvective regions of the star, i.e. regions that are stable by the Schwarzchild but unstable by the Ledoux criteria.
Our supernova models were taken from the survey of Heger (in prep). We adopted progenitor masses of 15, 25, and 40 , which are thought to be on the lower end of the mass scale for Population III stars (e. g. O’Shea & Norman, 2007; Yoshida et al., 2007). These masses were chosen in part because they were considered in previous studies of zero-metallicity stars (Joggerst et al., 2009; Tominaga, 2009; Tominaga et al., 2007; Heger & Woosley, 2008). We examined both zero-metallicity and SN progenitors. These two metallicities correspond to Population III stars and to stars on the cusp of the transition to Population II, where the gas has enough metals to cool efficiently and form low mass stars that can survive to the current epoch (e. g. Mackey et al., 2003; Frebel et al., 2007). Important differences in stellar evolution arise in these two metallicities; in particular, the stars are less affected by rotation and are actually bluer than their rotating counterparts.
We chose models with explosion energies of 0.6, 1.2, and 2.4 Bethe, where 1 Bethe ergs (1.2 Bethe is near the observed median explosion energy for core-collapse SNe Hamuy, 2003). The stars were assumed to have no mass loss. Nomoto et al. (2006) and Umeda & Nomoto (2005) proposed that the first generation of SNe may have been “hypernovae” on the basis of observed abundances in the most metal-poor stars. We instead decided to study models closer to the more commonly observed explosion energies in the nearby (admittedly solar-metallicity) universe.
Two fiducial rotation rates “R” were also considered: 5 and 10% of the critical angular velocity of a 20 solar-metallicity star, or total angular momentum of 6.1407 1051 or 1.2281 1052 gm cm2 s-1, respectively. Models were initialized with the same amount of angular momentum at a given fiducial rotation rate. These rates were 2 - 30% of the critical velocity for the stars in our survey, depending on their individual mass and metallicity. This percentage is listed for each progenitor in Table 1. Although the percentage of the critical velocity at a given “R” decreases with mass, this amount of angular momentum is sufficient to drastically change the presupernova structure of the model from a non-rotating counterpart. The initial angular momenta of our stars ensure that if they were of solar metallicity, they would fall at typical to sub-typical rotation rates. Solar metallicity massive stars typically rotate at about of critical angular velocity. Rotation speeds for Population III and II stars are not currently known, so in the absence of more compelling data it is reasonable to adopt values typical of the local universe. Rapidly rotating stars would be more likely to explode with a high degree of asymmetry, perhaps in the form of a jet, than more slowly rotating stars. The spherically symmetric explosions we have constructed for this study are more consistent with the slowly rotating progenitors we chose for our sample, though even slowly rotating progenitors may explode asymmetrically (see Murphy et al. (2009); Marek & Janka (2009); Scheck et al. (2006) and references therein).
Rotation can dramatically change the structures of the progenitors, especially the zero-metallicity ones (Ekström et al., 2008; Hirschi, 2007). Rotationally induced mixing between the helium core and the base of the hydrogen shell introduces C, N, and O, which leads to CNO burning at the base of the hydrogen shell. This dramatically increases the rate of energy production, puffing up the outer layer of the star. It also changes the interior structure, resulting in a uniformly mixed helium-hydrogen layer outside the CO core for the zero-metallicity models. Including even a small amount of angular momentum in the models effectively turns compact blue zero-metallicity stars into red giants. This has a profound effect on their post-explosion hydrodynamics. Rotation produces less of an effect in stars with low metallicity
The nomenclature for our models is as follows. Metallicity is denoted by either a “u” or a “z” at the beginning of the model name: “u” signifies while “z” means zero metallicity. Next is the mass of the star: 15, 25, or 40 . The explosion energy is denoted by either an “B”, “D”, or “G”, corresponding to 0.6, 1.2, and 2.4 Bethe, respectively. The rotation rate R is designated after the explosion energy by either a 5 or 10, the two fiducial rates defined above. For example, Z25D-5 is the 25 , zero-metallicity model, exploded with 1.2 Bethe of energy and rotating at R.
4. RESULTS
The final composition of the ejecta of a core-collapse SN is determined by the degree to which the layers surrounding the compact remnant are mixed by the RT instability and by the amount and composition of material that accretes onto the remnant. Mixing and fallback are determined by the presupernova structure of the star and by the details of its explosion.
4.1. Initial Stellar Structure and the Onset of Rayleigh-Taylor Mixing
At the end of its life, a massive star is composed of shells whose isotopic weight increases toward the Fe core in the center of the star. These layers become unstable to RT mixing during the explosion. Heavier material from deeper layers is mixed outward and lighter material from shallower layers is mixed inward. A reverse shock forms when the outgoing shock encounters a region of increasing (Herant & Woosley, 1994; Woosley & Weaver, 1995). When the shock encounters densities that fall less steeply than , i.e. a region of increasing , it decelerates. The deceleration of the forward shock reverses the direction of the pressure gradient, which slows down the layers interior to the shock as well. Shocked material piles up into a high density shell. The reverse shock forms at the inner boundary of the high-density shell of decelerated matter and propagates down into the star toward its center, slowing down the deeper, inner layers of the star (Kifonidis et al., 2003). The deceleration of the shock creates a steep pressure gradient in the opposite direction to the gravitational and density gradients. The pressure gradient may overwhelm the gravitational gradient, and in doing so trigger the formation of RT instabilities in the material. The RT instability grows until the reverse shock has passed by, at which point the material becomes stable again and the instabilities cease to grow exponentially.
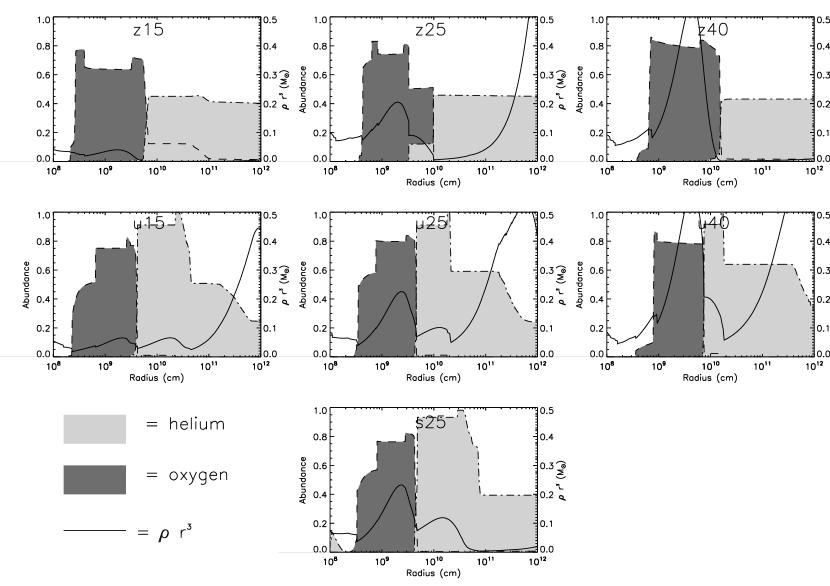
The presupernova structure of the star gives some indication of where the reverse shock, and hence the RT instability, is likely to form. Figure 1 shows for the R=10 progenitors in this study, scaled to show the location and shape of the helium and oxygen shells as well. We will show the final mixed structures of these stars in section § 4.3. The structure of the progenitor for R=5 is qualitatively similar. Shown for comparison is a 25 star from Herant & Woosley (1994). The and = models are similar in that does not increase dramatically until the hydrogen-helium shell boundary. The reverse shock that drives RT mixing will form at this boundary. The = 0 models are different. In these models, the shell boost at the base of the hydrogen layer has led to so much convection that a distinct helium shell no longer exists, so although the models are as large in radial extent as the models, the former lacks the helium shell present in the latter. Instead, helium and hydrogen are nearly uniformly mixed beyond the oxygen shell. The quantity increases sharply at the boundary between the oxygen shell and the helium-hydrogen shell, indicating that the reverse shock will form, and RT mixing will commence, at this boundary deeper within the star.
4.2. Effects of Rotation on Mixing
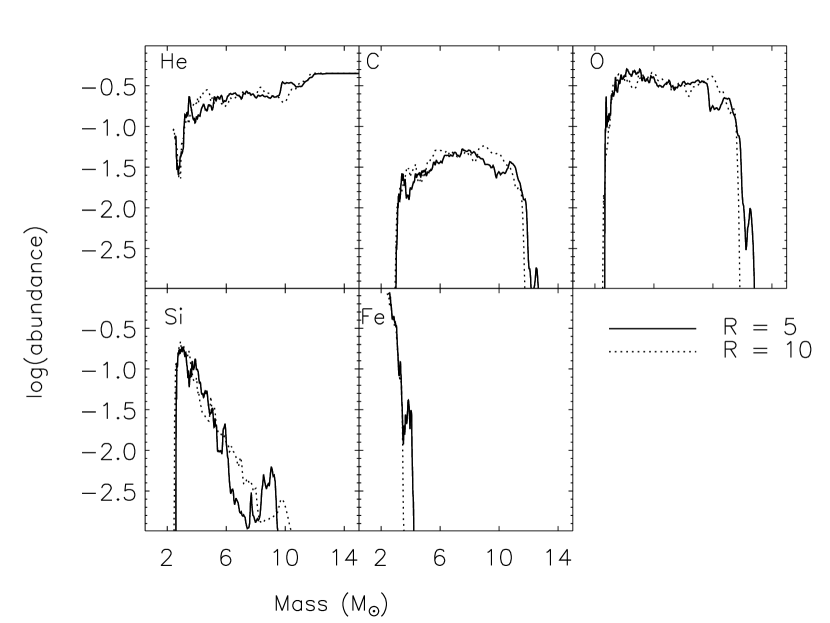
Figure 2 shows the abundance distribution of individual elements as a function of mass for models z15G-5 and z15G-10. Although they are not identical, the distributions are quite similar for the two models. The other R=10 SN models in our sample displayed a similar if not higher degree of congruence with their R=5 counterparts. If the star rotates, the degree of rotation has little effect on the final distribution of elements in the explosions, at least for the rotation rates explored in our survey. The reason for this is that once a star acquires even a small amount of rotation and becomes a red giant rather than a compact blue star (Joggerst et al., 2009), the structure of the red giant is relatively insensitive to the degree of rotation. Rotating stars are about an order of magnitude larger in radial extent than non-rotating stars, though our 25 rotating models are closer in size to their non-rotating counterparts than 15 and 40 models. Consequently, as the ejecta propagates through the star it encounters nearly the same gas profile whether it is an R=5 or an R=10 star and becomes similarly mixed. Mixing within the R series in stars is similar because the introduction of a modest amount of rotation has little effect on the structure of progenitor in these low metallicity models. Because models of either metallicity were so similar for R=5 and R=10, we will focus on the R=10 models for the remainder of this paper. However, because the structures of red giants are so distinct from compact blue stars, mixing and fallback vary dramatically with metallicity, as we discuss next.
4.3. RT Mixing in Models by Mass, Metallicity and Energy
The radius of the outer envelope of stars of a given mass is quite different for the two metallicities. The models are much redder than the models because their outer envelopes are larger. This is due to the hydrogen shell boost that dramatically increased the rate of hydrogen burning at the base of the hydrogen shell, making the outer envelope of the star entirely convective as it left the main sequence. The outer radii of the stars ranged from to cm for the 15 to 40 stars, respectively. The outer radii of the stars were about an order of magnitude smaller, ranging from cm for the 25 star to for the 40 star. Since the time it takes the reverse shock to propagate through the layers of the star sets the timescale on which RT mixing can occur, we expect that RT instabilities will have more time to develop, and greater mixing will occur, in the more “puffed up” stars. Stronger explosions will induce more mixing than weaker ones. The strength of the reverse shock, the degree to which the pressure gradient is reversed, and therefore the violence of the RT instabilities depends on the strength of the initial shock and hence on the energy of the initial explosion.
We evolved the initial KEPLER supernova models in CASTRO past the formation of the reverse shock and RT instabilities, until RT mixing ceased and the SN remnant was expanding nearly homologously. We found that the time at which RT mixing halted, and the degree to which it mixed together the isotopic shells of the model, indeed varies with mass, metallicity, and explosion energy. Results for the 18 R=10 models are presented by mass in Figures 3, 4, and 5.
4.3.1 15 Models
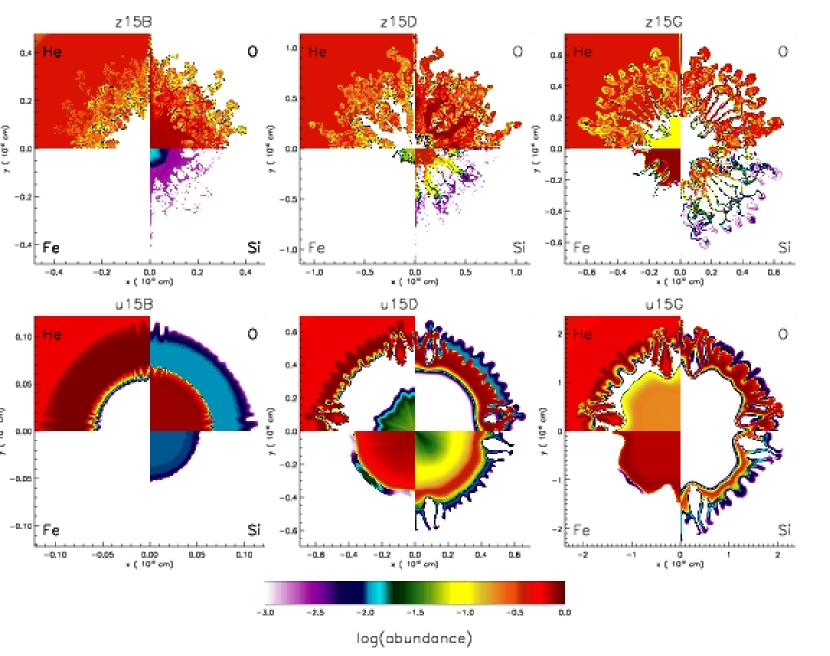
In Figure 3 we show the mass abundance of helium, oxygen, silicon, and iron in 15 stars of 0.6 (B, at left) 1.2 (D, center) and 2.4 (G, at right) Bethe explosions after the end of RT mixing. The snapshots are of the simulation at s, s, and s for z15B, z15D, and z15G, respectively, and similarly, at s, s, and s for u15B, u15D, and u15G. Beyond these times, the distribution of elements as a function of mass does not change. The zero-metallicity models (top panels) show a higher degree of mixing than their counterparts, as expected. As explosion energy increases (from left to right in Figure 3) the degree to which the inner layers of the star are mixed also increases. This is most apparent in the u-series models. In model u15B-10, the RT instability does not fully develop, leaving only a hint of “fingers” at the H-He and He-O shell boundaries. In model u15D-10, where the explosion energy has doubled, RT mixing has penetrated as far as the silicon shell, and silicon fingers extend well into the oxygen shell. Iron, however, remains unmixed, even in model u15G-10. The models show nearly complete mixing, however. Fe from the inner core is mixed out to at least as far as the oxygen shell, and the RT instability has become fully non-linear. The original fingerlike morphology has been significantly blurred over the many mixing timescales over which the instability has had time to develop.
4.3.2 25 Models
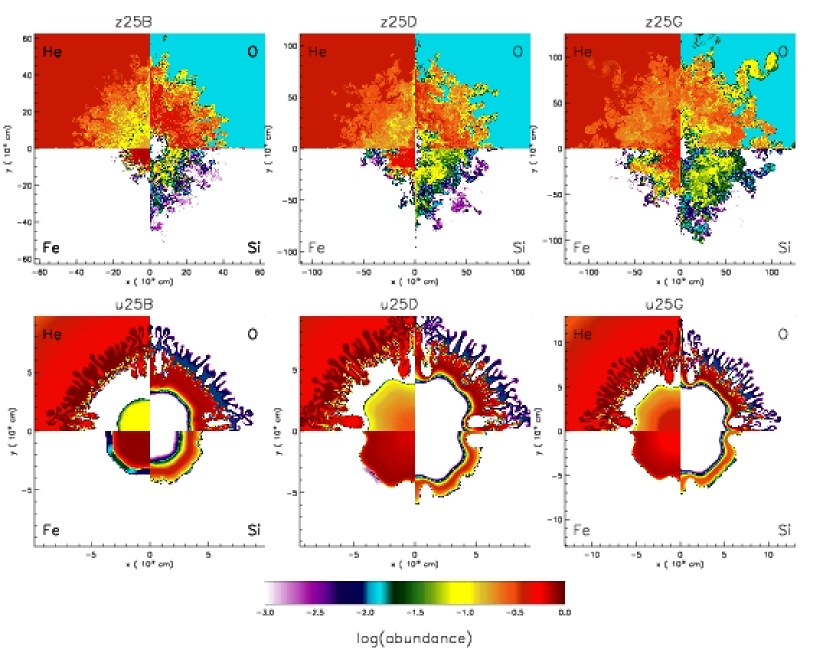
We show mixing in the 25 models in Figure 4. Here, as at 15 , RT mixing has had a longer time to develop in the z-series than in the u-series models. The instabilities have evolved to the point that the initial fingers have been nearly erased in the Z series. The snapshots show the distribution of elements at s, s, and s for z25B, z25D, and z25G, and s, s, and s for models u25B, u25D, and u25G, respectively. The center of the star has become mixed, and iron has reached the outer layers of the star. The initial radii of the 25 Population III and Population II models differ only by a factor of 3 or so, less than the difference in initial radii between 15 or 40 stars of different metallicity. This is why the amount of mixing seen in the 25 models is more similar than it is for stars at 15 and 40 .
While the figures do not show it clearly because they have been cropped to show just the mixing in the star, “jetting”, or excessive flow along an axis, is present along the y-axis for the z-series models and is more pronounced in the higher explosion energy models (D and G) than in B. These jets extend as far as cm, or twice the radius of the mixed region, for the z-series models. The u-series models again exhibit more mixing at the higher explosion energies, although the effect is not as pronounced as in the 15 models. The deviation from spherical symmetry in the inner, unmixed shells of silicon and oxygen is a numerical artifact of the axisymmetric geometry, which is discussed in greater detail below in § 4.3.6. The artifact becomes more prominent with explosion energy.
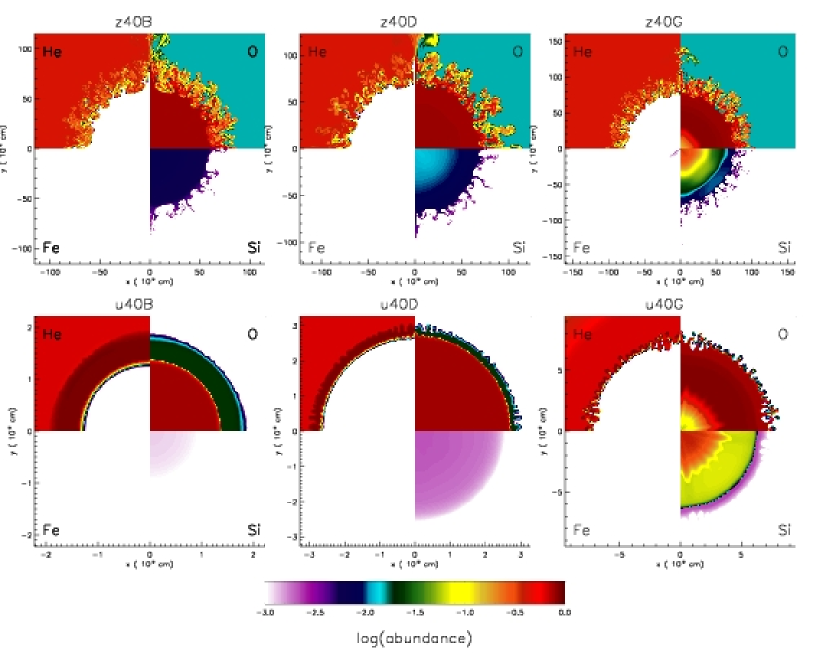
4.3.3 40 Models
The 40 mass models are shown in Figure 5 at s, s, and s for models z40B, z40D, and z40G, and s, s, and s for models u40B, 740D, and u40G, respectively. These explosions experience more fallback than the lower mass models, especially at explosion energies of 0.6 Bethe, where they leave behind remnants of 8.1 and 9.1 for z40B and u40B, respectively. Mixing also occurs in less time. Even in the red giant models, the Fe core has completely fallen back onto the remnant at the center of the simulation by the time RT mixing begins in all but the most energetic explosions, so these models produce virtually no iron. The variation in mixing with explosion energy is also more apparent in the 40 u-series models than in the 15 and 25 u-series runs.
4.3.4 Variation of Mixing with
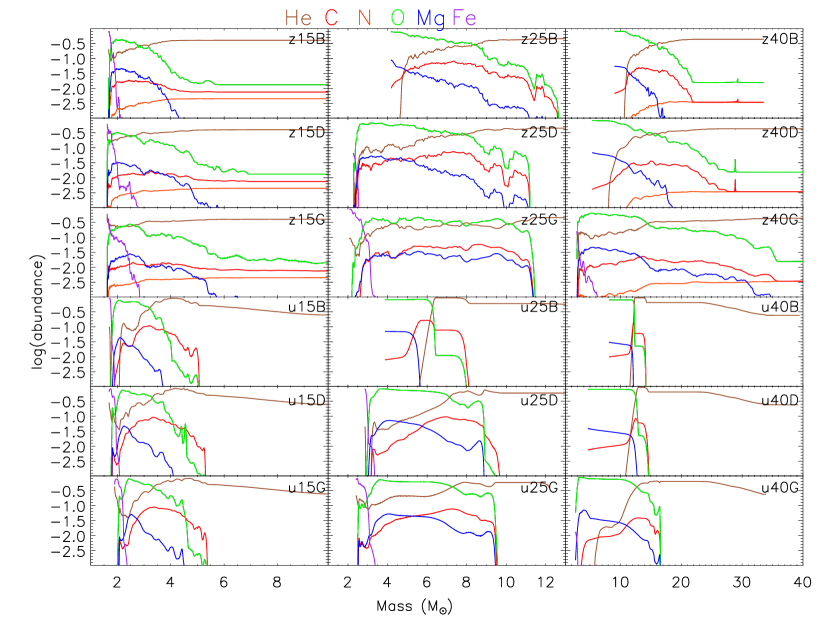
The final appearance of the SN ejecta at a given mass does not vary qualitatively with rotation rate, but mass, metallicity, and explosion energy do govern the final composition of the ejecta and the mass of the remnant. Figures 3, 4, and 5 give a good qualitative picture of the morphology of mixing in the explosion models; in Figure 6 we quantify the propagation of He, C, N, O, Mg, and Fe in the ejecta as a function of mass coordinate for the 18 R=10 models after RT mixing has ceased. Several trends are apparent. Lower-mass models show less fallback and more mixing in the internal layers than higher-mass models. The z-series SNe have far more mixing than u-series SNe. SNe with higher explosion energies exhibit more mixing and less fallback than SNe with lower explosion energies. In particular, the B series SNe with sub-normal explosion energies, 0.6 Bethe instead of the canonical 1.2 Bethe, eject almost no iron with the exception of model z15B.
The z-series models all show more mixing than their u-series counterparts. The 25 models show the most mixing of the models in the u-series, while the 40 u-series runs show the smallest degree of mixing. All the 40 models experience a great deal of fallback, but the u-series models show the most because they are more compact. The higher explosion energy models exhibit less fallback.
4.3.5 Comparison with Kepler Estimations of Mixing
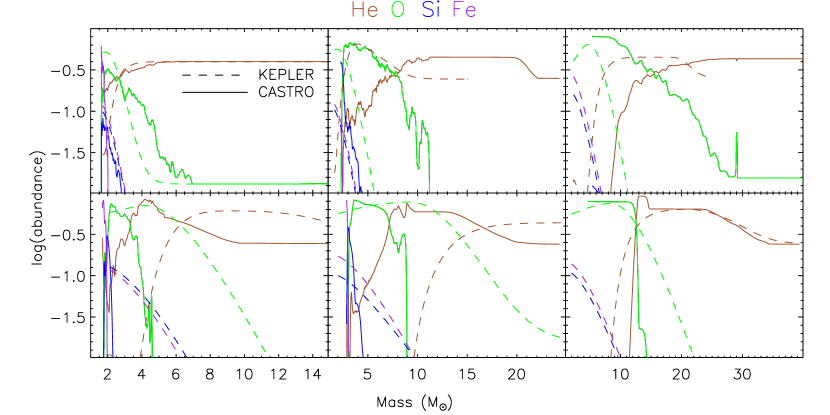
The large one dimensional surveys of SNe derive final estimates of elemental yields by artificially mixing the layers of the SN after explosive nucleosynthesis is complete. Surveys employing the Kepler code estimate mixing by passing a running boxcar average of width (in mass coordinate) through the star, where is the mass of the helium core. That is, the abundances at points that fell within a bin of width were averaged together and set to this average, the bin was moved forward by one point, and the process repeated, moving outward through the star. This is done 4 times, artificially mixing the mass shells. In Fig 7 we compare KEPLER estimations of mixing with our two dimensioanl CASTRO results. In our two-dimensional CASTRO simulations, we find that some elemental shells are more mixed than others. The RT instability typically forms at the He-H or O-He boundary and advances inward. This results in the helium and oxygen layers being more mixed than in KEPLER and the iron, and sometimes silicon, layers being less mixed than the KEPLER estimations for the Z-series models. Our compact U-series models show less mixing in all elements than in KEPLER.
4.3.6 Numerical Artifacts & Model Limitations
Numerical artifacts arising from the mesh geometry are most prominent in the higher explosion energy, u-series models, but they are present in all the runs. Jetting is visible along both axes in the z-series models in Figures 3, 4, and 5, but is more pronounced along the y-axis. This is a well-known artifact that appears on axisymmetric coordinate grids: PROMETHEUS and FLASH (Fryxell et al., 1991; Calder et al., 2002) also manifest it. The deviation from spherical symmetry (most clearly visible in models u15D-10 and u15G-10) is also a result of the tendency of the shock to be most exaggerated in the direction in which it is moving, this time with respect to the reverse shock. Ripples in the shells appear along both the x- and y-axes.
These anomalies do not change the essential results of our simulations. The z-series models would show a greater degree of mixing even without the presence of a jet directed either outward or inward. In addition, because of the axisymmetric geometry, the mass lying along the y-axis is only (where is the distance along the x-axis) times the mass at a similar radius from the origin, so the jet contains little mass. Additional mixing in the form of material pushed out farther than it should be along this axis was removed from the averages simply by excluding a cone of material around the axis. Fallback is not affected by jetting in our simulations.
In addition to these minor numerical effects, there are some inherent limitations to our models. As discussed in § 4.3.6, these explosions are spherical, and capture initial perturbations of only much higher order than or 2. Jet-driven explosions, as well as those with asymmetries of order or 2, may be common in the early universe, especially in rapidly rotating stars. Such explosions may have very different nucleosynthetic patterns (Tominaga, 2009). By examining only more slowly rotating stars, it is likely that the mapping of one-dimensional profiles onto two-dimensional grids in CASTRO is not excluding serious low-order perturbations, but not enough is known about the explosion mechanisms of core-collapse SNe, let alone Population III and II SNe, to be certain.
Simulations of spherical explosions in core collapse SNe, especially those of blue progenitors like the u-series SNe presented here, have historically underestimated mixing and final elemental velocities (Herant & Woosley, 1994; Fryxell et al., 1991; Kifonidis et al., 2003, 2006). Previous studies that attempted to match observations of SN 1987A (which died as a compact blue giant) with techniques similar to those in our study were largely unsucessful, finding less mixing and lower velocities for the heavier elements than were observed. Kifonidis et al. (2006) came closest to reproduxing observations of SN1987A by adding additional energy to the base of the explosion in two dimensions in the first few seconds after the explosion. We do not employ this technique in this paper. Solar metallicity models of red supergiants, like our models, come closer to matching observations of similar red SNe (Herant & Woosley, 1994). It is possible that more mixing would occur if the details of the first few seconds of the SN explosion were known with greater accuracy. Our mixing estimates should therefore be taken as lower bounds, though our mixing estimates for the red models in this paper are likely more accurate than for their blue counterparts.
5. Discussion
5.1. Comparison with Metal-Poor Stars
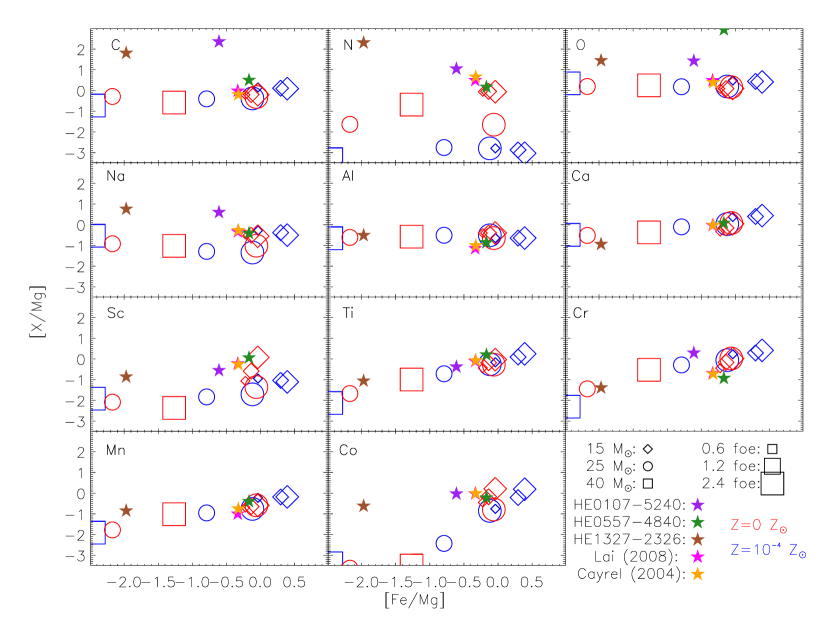
Comparison of our theoretical yields to direct observations of and SNe is not currently possible, as these objects do not exist in the nearby universe. However, the fossilized yields of such explosions may be detectable in the abundance patterns of extremely metal deficient halo stars. The three most iron-poor stars, HE0557-4840 (Norris et al., 2007), HE0107-5240 (Christlieb et al., 2004), and HE1327-2326 (Aoki et al., 2006), are thought to have been enriched by at most one or a few SNe, while EMP halo stars with [Fe/H] are believed to be imprinted by elements from a wider sample of early SNe. In Figure 8 we show our SN yields together with observed abundances in the three HMP stars and the average of the abundances of the larger sample of EMP stars in the Lai et al. (2008) and Cayrel et al. (2004) surveys, which contain 15 and 22 stars, respectively.
We calculate our theoretical yields by assuming the ejected material is completely mixed, as is usual for this kind of calculation. All short-lived isotopes ( for example) are reported as their eventual decay products.
Figure 8 shows that our SN models do not reproduce the high CNO abundances present in HE 01327-2326 and HE 0107-5240 when the ratio of Mg to Fe is held fixed. With its lower ratios of C and N to Fe, HE 0557-4840 is a better match to some of our chemical yields, and is also closer to the abundances in the Lai et al. (2008) and Cayrel et al. (2004) data. It is also clear from the diagram that some models cannot produce the [Fe/Mg] values of any of the observations. All but the most energetic of the 40 SNe yield an [Fe/Mg] ratio too small to appear in Figure 8. The 25 explosion with energies less than 2.4 Bethe show little overlap with either the HMP or EMP data, either. The u-series 15 models produce a [Mg/Fe] ratio that is too high.
5.1.1 HMP Stars

While HE 0107-5240 and HE 1327-2326 show higher ratios of C,N, O and Na to Fe than our models, the yield from one model, z15G, does fit the abundance pattern of halo star HE 0557-4840 with the exception of carbon. Oxygen is an upper limit, and [C+O/Fe] in this star is far lower than in the other two HMP stars. The other two HMP stars, HE 0107-5240 and HE 1327-2326 show much higher [C+0/Fe] and [C+0/Mg] ratios that our model yields do not replicate. We compare yields from the explosions in our survey that most closely reproduce [Mg/Fe] for these two HMP stars with their observed abundance ratios in Figure 9. Model z15G provides a very close fit to the abundance patterns in HE0557-4840. The only elements not in agreement are carbon, where our model underpredicts [C/Mg] by about 0.5 dex, and chromium, where our model underpredicts [Cr/Mg] by a little more than 1 dex. Norris et al. (2007) compare their observed abundances for this star to theoretical yields from the “mixing and fallback” models of Umeda & Nomoto (2003) and Iwamoto et al. (2005), which overpredict [Cr/Fe]. The hypernova models of Umeda & Nomoto (2005) and Nomoto et al. (2006) yield a [Co/Fe] ratio of 0.5, which is considerably higher than the observed value -0.3 for this star, or the value of -0.2 predicted by model z15G.
We also note that the non-rotating spherical explosion models in Joggerst et al. (2009) also fail to reproduce the abundance patterns found in metal-poor stars. In particular, far less nitrogen is formed in their models than observed or produced in the rotating models. This, not surprisingly, suggests that Population III stars were indeed rotating, but at the fairly low speeds modeled here the exact rate seems to be unimportant.
Reconciling our models to the abundance patterns in HE0107-5240 and HE1327-2326 is more problematic. Enrichment by a companion AGB star has not been ruled out for either star, and would result in abundances of C, N, O, and Na well above that with which the stars were initially born. This has been proposed as an explanation for the abundances in HE0107-5240 (Christlieb et al., 2004) and HE1327-2326 (Aoki et al., 2006), although Frebel et al. (2008) presents evidence that HE1327-2326 is not a member of a binary system and thus could not have been enriched by an AGB companion. While the mixing and fallback models of Iwamoto et al. (2005) account for the abundance patterns in these stars, they are still heavily tuned one-dimensional parameterizations, not multidimensional calculations with realistic physics. The jet-driven explosions of a 40 Population III star by Tominaga (2009) do reproduce the features of the earlier mixing and fallback models, providing a mechanism for the mixing-fallback parameterization. Their angle averaged yields match the abundances observed in HE1327-2326 and HE0107-5240–in particular, they produce the high [CNO/Fe] ratios that our models do not.
Our models never show [C/Mg] and [O/Mg] ratios greater than 0.25 and 0.5, respectively. HE0107-5240 has [C/Mg] and [O/Mg] ratios of 2.4 and 1.4, respectively; the values of [C/Mg] and [O/Mg] for HE1327-2326 are 1.1 and 1.5. That our models underreproduce the combined [CO/Mg] values for these stars by at least 2 dex does not imply that they are not representative of Population III SNe. Since only [C/H] and [O/H] ratios greater than -3.5 produce enough fine structure cooling to trigger the rollover from Population III to II star formation (e. g. Mackey et al., 2003), Frebel et al. (2007) have argued that any star surviving until today with [Fe/H] must have enhanced abundances of C and/or O. Consequently, although perhaps much more plentiful, Population III SNe that did not produce high [C/Fe] and [O/Fe] ratios would not have imprinted their chemical signatures upon a subsequent generation of stars that was long lived. More exotic explosion mechanisms may not have been predominant at high redshift, and may not even be necessary for reproducing the abundance patterns in the more iron-poor stars yet found. Fig 6 shows that for some stars, C, N, and O are mixed out to higher mass coordinate than Mg and heavier elements. It is possible that HE0107-5240 and HE1327-2326 could both have formed from gas that was preferentially enriched by these further-flung lighter elements.
5.1.2 EMP Stars
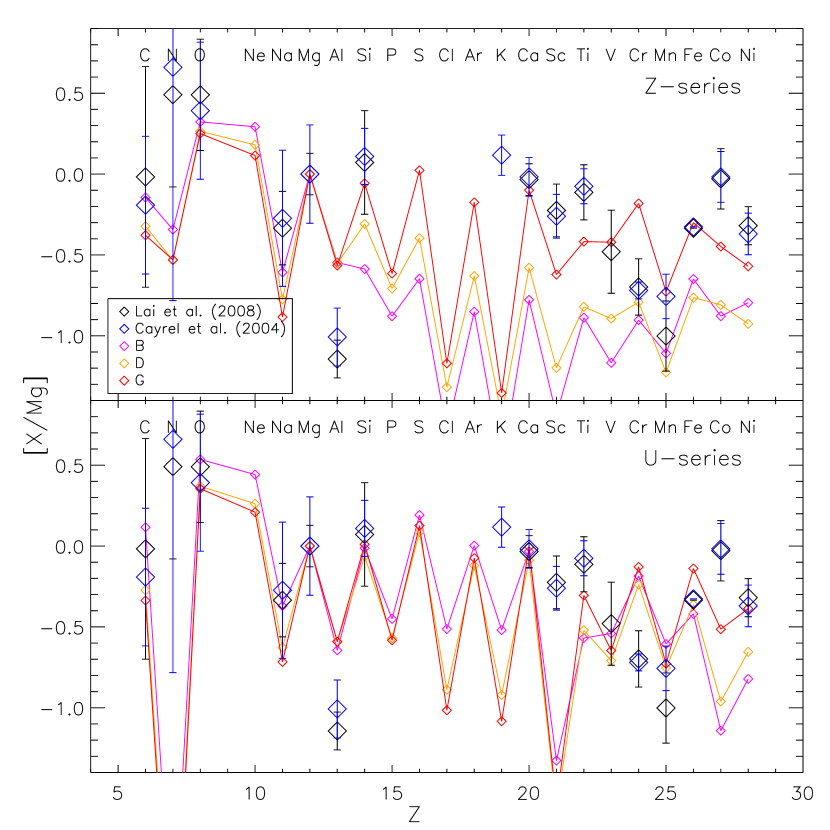
Many more stars have been found with [Fe/H] values between -4 and -3 than below -4.5. The abundances in these stars show less scatter than in the small sample of three below -4.5. Figure 8 shows the average ratios of various abundances to Mg as a function of [X/Mg] from the surveys of Lai et al. (2008) and Cayrel et al. (2004). Figure 10 shows IMF averaged yields for 0.6, 1.2, and 2.4 Bethe explosions and and . We used a Salpeter IMF,
| (8) |
and the cannonical value for of 2.35.
The fact that the u-series models don’t produce enough nitrogen should perhaps be ignored, since these models were constructed with yields from non-rotating stars, which did not produce nearly the nitrogen that was formed in the rotating models. Explosions of 1.2 and 2.4 Bethe (i.e. “D” and “G” models) for come closest to matching the abundances of the EMP stars.
An IMF-average over yields from the models provides a good fit to the Cayrel and Lai data. Aluminum is over produced by about 0.5 dex, and potassium is under produced by about 2 dex. Scandium and titanium are under produced by about 0.3 dex. Cobalt is under produced by less than 0.5 dex. But for all other elements our synthetic yields fall within the error bars, or our yields from explosions of 1.2 or 2.4 Bethe bracket the data, demonstrating that SNe with energies between 1.2 and 2.4 Bethe can account for the observed abundances. However, 15 stars are needed in our IMF average to match the abundance patterns in both the Lai and Cayrel data. Spherical explosions with energies above 2.4 Bethe are not required to match abundance patterns in the EMP data sets. While this does not rule out the existence of hypernovae, it does suggest that they are not required to explain the abundances in EMP stars. Also, as we noted earlier, our estimates of mixing are a lower bound. With more detailed simulation physics like that in Kifonidis et al. (2006), it is likely that more heavy elements would be produced at a given explosion energy and that lower energy explosions alone would be sufficient to match the EMP data.
Our IMF-averaged yields for rotating, zero-metallicity stars come closer to the observed abundances in EMP stars than do the one-dimensional parametrizations of Heger & Woosley (2008) or Iwamoto et al. (2005), the two-dimensional non-rotating spherical explosions of Joggerst et al. (2009) or the jet models of Tominaga (2009). The angle-averaged yields of Tominaga (2009) also underestimate potassium by nearly 2 dex. Nitrogen, aluminum, scandium, and cobalt are also under produced, to a far greater degree than in our models. Although the jet-induced explosion may better account for the abundances in HE0107-5240 and HE1327-2326, an IMF average of spherical explosion yields of rotating zero-metallicity stars is a better fit to the Lai et al. (2008) and Cayrel et al. (2004) surveys. These two HMP stars may well be singular, rare objects. The more comprehensive surveys of EMP stars likely reflect more typical conditions and hence typical early supernovae. The good match of IMF-weighted averages of supernovae yields to these EMP star data suggests that supernovae of 15 with moderate explosion energies of less than 2.4 Bethe were responsible for the bulk of early enrichment. Hypernovae may not be necessary to explain these abundance patterns. Our results imply that moderately sized, moderately energetic explosions produced most of the metals that went on to form these EMP stars.
5.2. Incorporation of SNe Ejecta into Metal-Poor Stars
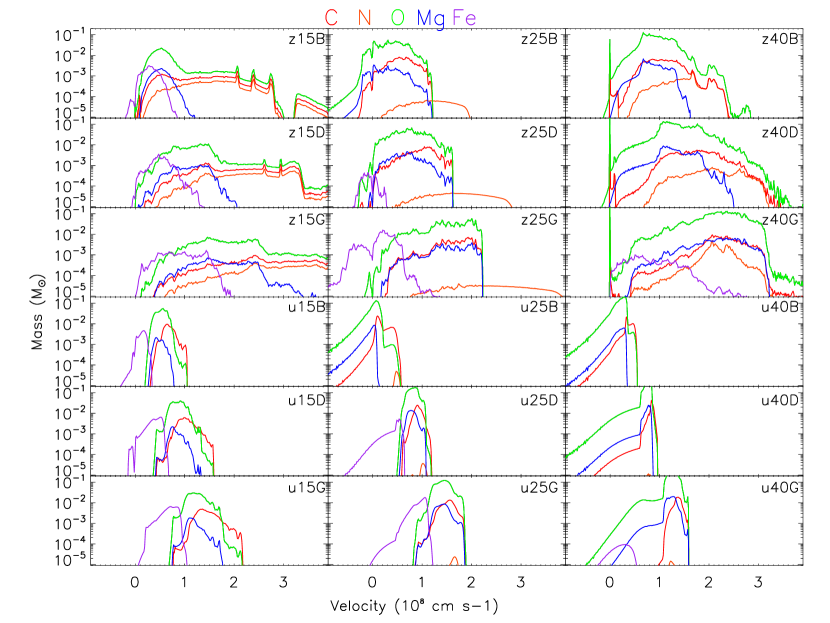
Matching primordial nucleosynthetic yields directly to HMP and EMP abundances is problematic because not all of the elements may have been incorporated into subsequent metal-poor stars. Intervening hydrodynamical processes complicate the uptake of heavy elements into second-generation stars on several disparate spatial scales. First, as seen in our models, fallback onto the central remnant deep within the initial explosion can deprive later generations of certain elements, particularly Fe. On intermediate scales, HMP or EMP stars may have formed promptly from gas clumps created in hydrodynamical instabilities in primordial SN remnants (SNR) on 100 pc scales (Whalen et al., 2008). If so, only the heavy elements that reach these instabilities by the time of their formation are those that become imprinted on the second stars. Their presence throughout the SNR can be traced back to their distribution in the early free expansion on scales of 10-3 - 10-2 pc, which is well beyond those of our models. The velocity profile of the free expansion is nearly linear with radius (e.g. Truelove & McKee, 1999), so gas near the center of the explosion has much lower velocities than at greater radii. If this free expansion is not well mixed, heavier elements at small radii may never reach the formation sites of dense clumps at later times and appear in the resultant stars. Such differential mixing in the SNR can skew the abundance patterns of the second generation and is yet to be properly modeled.
However, a rough idea of how these elements will be disseminated at later times can be obtained from their distribution with respect to velocity in our models, which we show in Figure 11. The velocities in this figure are those after all mixing has ceased, which occurs at a different time for each star. Again, it is apparent that lower explosion energy SNe have greater fallback than do higher explosion energy SNe; their iron cores are especially likely to fall back. For some stars, such as models u25B and z25B, u40B, u40D, z40B, and z40D, iron does not appear on the plot because it has all accreted onto the remnant. In general, because they exhibit more mixing, the z-series models show heavier elements mixed out to a higher percentage of the velocity of the lighter elements than the u-series models. Nitrogen, because it is distributed throughout the helium envelope of the models, is mixed out to a higher velocity than the other metals.
Perhaps the most striking feature of these plots is that C, N, and O all consistently reach similar velocities that are noticeably greater than those of Fe. The separation between these elements and Fe will increase as the remnant expands homologously. This trend suggests that at later times regions of the ejecta at greater radii, which may be the sites of prompt second star formation, will be preferentially enriched with carbon, nitrogen, and oxygen. Models z15B, z15D, and z15G especially show C, N, and O separated in velocity from Mg and Fe. C, N, and O are also separated from Mg and Fe in mass coordinate, as can be seen in 6. This distribution may increase [CNO/Mg] while leaving [Fe/Mg] (as well as the ratios of element heavier than Mg to Mg) relatively unchanged, bringing our yields more into line with the abundances of HMP stars HE0107-5240 and HE1327-2326. Future simulations of the explosion over larger spatial scales and longer timescales are now being planned to evaluate these processes.
6. Conclusions
We have constructed two-dimensional simulations of the post-explosion hydrodynamics of rotating Population III and II core-collapse SNe. We find that the main effect of rotation on the explosions is to alter the structure of the stellar envelope through which they propagate. Even a small amount of rotation was enough to expand the compact stationary stars like those of Joggerst et al. (2009) from blue to red. On the other hand, rotation had less effect on the presupernova structures of stars, which remained blue and displayed a degree of mixing comparable to the non-rotating z-series models of Joggerst et al. (2009). Once rotation was introduced in the progenitors, its actual magnitude had little bearing on the final structure of the star, or hence on the ejecta and yield of the SNe. There were no significant differences between R=5 and R=10 models of equal mass and explosion energy.
The Z-series red supergiant models experience more mixing than the blue U-series models, and the redness or blueness of a supernova progenitor, not explosion energy, rotation rate, or mass, has the largest effect on stellar yields. We find that RT instabilities mix a greater percentage of the star in the Z-series Population III models because the reverse shock takes longer to travel through the larger star, thus the prssure gradient is reversed for a longer period of time and the RT instability has more time to develop. The shorter travel time for the reverse shock through the more compact u-series models truncates the development of the RT instability in these stars after a shorter time than their z-series counterparts, resulting in less mixing. Likewise, there is less fallback onto the central remnant in the z-series explosions than in the blue u-series Population II models, whose envelopes are more tightly bound. At a given mass and metallicity, higher explosion energies lead to more mixing than lower energies, a trend that was most noticeable in the 40 runs. More massive stars exhibited less mixing than lower-mass stars. This was most apparent in the blue u-series stars, which experienced less mixing overall than their red z-series counterparts. Fallback increased with the mass of the progenitor and fell with increasing explosion energy. The 40 models with explosion energies of 1.2 Bethe or less did not eject any iron, nor did 25 models with 0.6 Bethe.
Our rotating progenitor explosion models can account for the abundance patterns of the EMP stars and of one HMP star. The abundances in HE0557-4840, the least metal-poor of the HMP stars, with [Fe/H]=-4.75, are modeled well by the yields of a 15 SN with 2.4 Bethe. We are not able to replicate the high CNO to Fe ratios in the more metal-poor HMP stars HE0107-5240 and HE1327-2326, although we do reproduce their elements above Na with SNe models between 15 and 25 . Enrichment by an AGB companion may explain the extra C, N, O, and Na in HE 0107-5240 and HE1327-2326. Although they explain the abundance patterns in the two most iron-poor stars yet found, jet-driven explosions may not have been the most prevalent type of Population III supernova, just the one whose nucleosynthetic imprint survives in HMP stars in the Galactic halo today. The only stars with [Fe/H] that could have formed with masses low enough to be observable today were those with high [C/Fe] and [O/Fe] (Frebel et al., 2007, 2009). Another explanation for the high [CNO/Mg] ratios observed in these stars may lie in the final distribution of elements in our simulations. Models z15D and z25D, provide the closest fits to elements heavier than Mg for HE0107-5240 and HE1327-2326, respectively. These stars show C, N, and O separated from Mg and heavier elements in both mass and velocity coordinates. Preferential enrichment in these further-flung light elements may also reproduce the chemical abundance patterns in these stars without the need for a companion, which has not been observed despite continued observations (Frebel et al., 2008). Low-mass stars with [Fe/H] might only have been able to form in a CNO-rich environment.
The assertion that stars like the ones in this paper represent the dominant form of supernovae in the early Universe is bolstered by the fact that our yields are a better match to the EMP stars than HMP stars, which were likely enriched by a few generations of SNe whose cumulative C, N, and O imprint was sufficient to trigger a rollover from high-mass Population III stars to low-mass metal-poor Population II stars. Indeed, because the chemical makeup of EMP stars is the product of a few generations (and therefore a better cross section) of zero or very low metallicity explosions, the chemical abundances found in EMP stars may be a better metric of those of and 10-4 SNe in general. An IMF average over spherical-explosion SN yields from zero-metallicity rotating 15, 25, and 40 progenitors with energies between 1.2 and 2.4 Bethe reproduces the abundance patterns found by the Lai et al. (2008) and Cayrel et al. (2004) survey of EMP stars with [Fe/H], with the exception of potassium, which is too low by 2 dex in our models, and Al, which is too high by 0.5 dex. The fact that 15 progenitors must be included in the IMF average suggests that the metal-free stars that contributed the bulk of the metals to the early universe were of fairly low mass, extending down to the lower limit predicted for Population III stars. The abundance patterns of both HMP and EMP stars will soon come more fully into focus as the Sloan Extension for Galactic Understanding and Exploration-II (SEGUE-II) component of the Sloan Digital Sky Survey-III (SDSS-III) uncovers hundreds of thousands of low-mass metal-poor stars in the Galactic halo.
While the uncertainty about the explosion mechanism and geometry of core-collapse SNe means that these mixing estimates are likely lower bounds, our essential conclusions are unchanged. Higher-mass stars may experience more mixing, and less energetic blasts may eject amounts of heavy metals similar to those in our models with more realistic conditions for the first few seconds of the explosion. Hypernovae, or explosions with 10 times the energy observed in the nearby Universe, are not necessary to account for the abundances of the EMP stars: moderately enhanced explosion energies of less than 2.4 Bethe suffice. Our models are consistent with observations of abundances in EMP stars, suggesting that jet-driven mechanisms may not be necessary to explain these patterns.
Our conclusions assume that SN ejecta that escapes fallback onto the remnant is uniformly mixed with the IGM and other SNR prior to incorporation into EMP stars, which may not be the case. Furthermore, even though the velocity distributions of elements in our zero-metallicity models are otherwise fairly uniform, Fe typically lags C, N, and O. Metals in our u-series models exhibit more stratification in velocity space, suggesting that they will be differentially imprinted onto subsequent generations of stars. Simulations that follow the remnant out to greater spatial scales are necessary to test this hypothesis and are now under development. Mixing in three dimensions may also be different than in two, and will also be investigated in future simulations.
References
- Abel et al. (2000) Abel, T., Bryan, G. L., & Norman, M. L. 2000, ApJ, 540, 39
- Abel et al. (2002) —. 2002, Science, 295, 93
- Almgren et al. (2010) Almgren, A. S., Beckner, V., Bell, J., Day, M., Howell, L., Joggerst, C., Lijewski, M., Nonaka, A., Singer, M., & Zingale, M. 2010, ApJ
- Aoki et al. (2006) Aoki, W., Frebel, A., Christlieb, N., Norris, J. E., Beers, T. C., Minezaki, T., Barklem, P. S., Honda, S., Takada-Hidai, M., Asplund, M., Ryan, S. G., Tsangarides, S., Eriksson, K., Steinhauer, A., Deliyannis, C. P., Nomoto, K., Fujimoto, M. Y., Ando, H., Yoshii, Y., & Kajino, T. 2006, ApJ, 639, 897
- Beers & Christlieb (2005) Beers, T. C. & Christlieb, N. 2005, ARA&A, 43, 531
- Bromm et al. (1999) Bromm, V., Coppi, P. S., & Larson, R. B. 1999, ApJ, 527, L5
- Bromm et al. (2002) —. 2002, ApJ, 564, 23
- Burrows et al. (2006) Burrows, A., Livne, E., Dessart, L., Ott, C. D., & Murphy, J. 2006, ApJ, 640, 878
- Calder et al. (2002) Calder, A. C., Fryxell, B., Plewa, T., Rosner, R., Dursi, L. J., Weirs, V. G., Dupont, T., Robey, H. F., Kane, J. O., Remington, B. A., Drake, R. P., Dimonte, G., Zingale, M., Timmes, F. X., Olson, K., Ricker, P., MacNeice, P., & Tufo, H. M. 2002, ApJS, 143, 201
- Cayrel et al. (2004) Cayrel, R., Depagne, E., Spite, M., Hill, V., Spite, F., François, P., Plez, B., Beers, T., Primas, F., Andersen, J., Barbuy, B., Bonifacio, P., Molaro, P., & Nordström, B. 2004, A&A, 416, 1117
- Christlieb et al. (2004) Christlieb, N., Gustafsson, B., Korn, A. J., Barklem, P. S., Beers, T. C., Bessell, M. S., Karlsson, T., & Mizuno-Wiedner, M. 2004, ApJ, 603, 708
- Ekström et al. (2008) Ekström, S., Meynet, G., Chiappini, C., Hirschi, R., & Maeder, A. 2008, A&A, 489, 685
- Frebel et al. (2005) Frebel, A., Aoki, W., Christlieb, N., Ando, H., Asplund, M., Barklem, P. S., Beers, T. C., Eriksson, K., Fechner, C., Fujimoto, M. Y., Honda, S., Kajino, T., Minezaki, T., Nomoto, K., Norris, J. E., Ryan, S. G., Takada-Hidai, M., Tsangarides, S., & Yoshii, Y. 2005, Nature, 434, 871
- Frebel et al. (2008) Frebel, A., Collet, R., Eriksson, K., Christlieb, N., & Aoki, W. 2008, ApJ, 684, 588
- Frebel et al. (2007) Frebel, A., Johnson, J. L., & Bromm, V. 2007, MNRAS, 380, L40
- Frebel et al. (2009) —. 2009, MNRAS, 392, L50
- Fryxell et al. (1991) Fryxell, B., Arnett, D., & Mueller, E. 1991, ApJ, 367, 619
- Greif et al. (2007) Greif, T. H., Johnson, J. L., Bromm, V., & Klessen, R. S. 2007, ApJ, 670, 1
- Hamuy (2003) Hamuy, M. 2003, ApJ, 582, 905
- Heger & Woosley (2002) Heger, A. & Woosley, S. E. 2002, ApJ, 567, 532
- Heger & Woosley (2008) —. 2008, ArXiv e-prints
- Herant & Woosley (1994) Herant, M. & Woosley, S. E. 1994, ApJ, 425, 814
- Hirschi (2007) Hirschi, R. 2007, A&A, 461, 571
- Iwamoto et al. (2005) Iwamoto, N., Umeda, H., Tominaga, N., Nomoto, K., & Maeda, K. 2005, Science, 309, 451
- Joggerst et al. (2009) Joggerst, C. C., Woosley, S. E., & Heger, A. 2009, ApJ, 693, 1780
- Karlsson et al. (2008) Karlsson, T., Johnson, J. L., & Bromm, V. 2008, ApJ, 679, 6
- Kifonidis et al. (2003) Kifonidis, K., Plewa, T., Janka, H.-T., & Müller, E. 2003, A&A, 408, 621
- Kifonidis et al. (2006) Kifonidis, K., Plewa, T., Scheck, L., Janka, H.-T., & Müller, E. 2006, A&A, 453, 661
- Kitayama & Yoshida (2005) Kitayama, T. & Yoshida, N. 2005, ApJ, 630, 675
- Lai et al. (2008) Lai, D. K., Bolte, M., Johnson, J. A., Lucatello, S., Heger, A., & Woosley, S. E. 2008, ApJ, 681, 1524
- Löhner (1987) Löhner, R. 1987, Comput. Methods Appl. Mech. Eng., 61, 323
- Mackey et al. (2003) Mackey, J., Bromm, V., & Hernquist, L. 2003, ApJ, 586, 1
- Marek & Janka (2009) Marek, A. & Janka, H.-T. 2009, ApJ, 694, 664
- Murphy & Burrows (2008) Murphy, J. W. & Burrows, A. 2008, ApJ, 688, 1159
- Murphy et al. (2009) Murphy, J. W., Ott, C. D., & Burrows, A. 2009, ArXiv e-prints
- Nakamura & Umemura (2001) Nakamura, F. & Umemura, M. 2001, ApJ, 548, 19
- Nomoto et al. (2006) Nomoto, K., Tominaga, N., Umeda, H., Kobayashi, C., & Maeda, K. 2006, Nuclear Physics A, 777, 424
- Norris et al. (2007) Norris, J. E., Christlieb, N., Korn, A. J., Eriksson, K., Bessell, M. S., Beers, T. C., Wisotzki, L., & Reimers, D. 2007, ApJ, 670, 774
- O’Shea & Norman (2007) O’Shea, B. W. & Norman, M. L. 2007, ApJ, 654, 66
- Scheck et al. (2006) Scheck, L., Kifonidis, K., Janka, H.-T., & Müller, E. 2006, A&A, 457, 963
- Tominaga (2009) Tominaga, N. 2009, ApJ, 690, 526
- Tominaga et al. (2007) Tominaga, N., Umeda, H., & Nomoto, K. 2007, ApJ, 660, 516
- Truelove & McKee (1999) Truelove, J. K. & McKee, C. F. 1999, ApJS, 120, 299
- Umeda & Nomoto (2002) Umeda, H. & Nomoto, K. 2002, ApJ, 565, 385
- Umeda & Nomoto (2003) —. 2003, Nature, 422, 871
- Umeda & Nomoto (2005) —. 2005, ApJ, 619, 427
- Weaver et al. (1978) Weaver, T. A., Zimmerman, G. B., & Woosley, S. E. 1978, ApJ, 225, 1021
- Whalen et al. (2008) Whalen, D., van Veelen, B., O’Shea, B. W., & Norman, M. L. 2008, ApJ, 682, 49
- Wise & Abel (2007) Wise, J. H. & Abel, T. 2007, ApJ, 671, 1559
- Woosley (1988) Woosley, S. E. 1988, ApJ, 330, 218
- Woosley et al. (2002) Woosley, S. E., Heger, A., & Weaver, T. A. 2002, Reviews of Modern Physics, 74, 1015
- Woosley & Weaver (1995) Woosley, S. E. & Weaver, T. A. 1995, ApJS, 101, 181
- Yoshida et al. (2007) Yoshida, N., Oh, S. P., Kitayama, T., & Hernquist, L. 2007, ApJ, 663, 687