Hot Horizontal Branch stars in Centauri: clues about their origin from the cluster Color Magnitude Diagram
Abstract
We investigate a peculiar feature at the hottest, blue end of the horizontal branch of Galactic globular cluster Centauri, using the high-precision and nearly complete catalog that has been constructed from a survey taken with the Advanced Camera for Survey on board the Hubble Space Telescope, that covers the inner arcminutes. It is a densely populated clump of stars with an almost vertical structure in the F435W-(F435WF625W) plane, that we termed ‘blue clump’. A comparison with theoretical models leads to the conclusion that this feature must necessarily harbor either hot flasher stars, or canonical He-rich stars –progeny of the blue Main Sequence sub-population observed in this cluster– or a mixture of both types, plus possibly a component from the normal-He population hosted by the cluster. A strong constraint coming from theory is that the mass of the objects in the ‘blue clump’ has to be very finely tuned, with a spread of at most only 0.03 . By comparing observed and theoretical star counts along both the H- and He-burning stages we then find that at least 15% of the expected He-rich Horizontal Branch stars are missing from the color-magnitude diagram. This missing population could be the progeny of red giants that failed to ignite central He-burning and have produced He-core White Dwarfs. Our conclusion supports the scenario recently suggested by Calamida et al. (2008) for explaining the observed ratio of White Dwarfs to Main Sequence stars in Centauri.
1 Introduction
The origin and evolution of the Galactic Globular Cluster (GGC) Centauri (NGC 5139) is one of the most exciting open problems of modern astrophysics. Centauri belongs to the Galactic GC system but, due to its complex stellar population and unusual large mass () it has been often considered the relic of a larger stellar system, such as a dwarf galaxy (see Lee et al. 1999, Villanova et al. 2007 and references therein). In these last few years, the availability of high- accuracy photometry and multi-object spectroscopy prompted the discovery of additional unusual features like the discrete structure of its red giant branch (RGB – Lee et al. 1999, Pancino et al. 2000, Rey et al. 2004, Sollima et al. 2005), the peculiar – and still not poorly understood – age distribution (Sollima et al. 2007, Villanova et al. 2007 and references therein), the distinct kinematical properties of the various stellar components (Sollima et al. 2005). An additional level of complexity has been added by the discovery by Anderson (1997) and Bedin et al. (2004) that, over a range of at least 2 mag, the cluster main sequence (MS) splits into two separate sequences, the bluer MS being more metal-rich than the red one (Piotto et al. 2005). Apparently, the only way to account for both the spectroscopic and photometric observations is to assume that the blue MS is populated by stars with an extremely large initial helium content ( –Piotto et al. 2005, Lee et al. 2005).
Cen also displays an ‘intriguing’ horizontal branch (HB), characterized by a very extended blue tail, with gaps (see Whitney et al. 1994 and references therein). In addition, Cen, together with NGC 2808 (Brown et al. 2001), NGC 6715 (Rosenberg, Recio-Blanco & García-Marín 2004), NGC 6388 and possibly NGC 6441 (Busso et al. 2007), shows ‘blue hook’ stars at the very hot end of its HB (Whitney et al. 1998, D’Cruz et al. 2000). This feature consists of a significant number of objects located at hotter effective temperatures than the hot end of the HB observed in other GCs with blue tails, such as NGC 6752 (Momany et al. 2002, 2004) and fainter than the bluest end of the canonical zero age HB (ZAHB), by up to about 0.7 mag in the UV photometric filters. The presence of these peculiar stellar objects cannot be explained by canonical stellar evolution (Salaris & Cassisi 2005).
A few years after their discovery, Brown et al. (2001) proposed to explain the origin of ‘blue hook’ stars via the ’He-flash induced mixing’ scenario. This scenario was first envisaged by Castellani & Castellani (1993), who proposed that stars that lose an unusually large amount of mass along the RGB will leave the branch before the occurrence of the He flash, and will move quickly to the (helium-core) white dwarf cooling curve before eventually initiating helium burning. The evolution of these so-called ‘late hot helium flashers’ differs significantly from that of stars which undergo the helium flash at the tip of the RGB. In fact, in this case the large entropy barrier of the efficient H-burning shell prevents the products of helium fusion from being mixed within the surface convective region. These stars will thus evolve to the ZAHB without any change in their envelope composition. By contrast, stars that ignite helium on the white dwarf (WD) cooling curve have a much less efficient H-burning shell, and will undergo extensive mixing between the He-core and the H-rich envelope, as predicted by Sweigart (1997) and Brown et al. (2001). The exact development of the He-flash induced mixing has been investigated on the basis of fully evolutionary models firstly by Cassisi et al. (2003) and more recently by Miller Bertolami et al. (2008). The exact chemical composition of the envelope at the end of this process depends on the strength of the He-flash, i.e. on when – along the WD cooling sequence –the He ignition occurs. Irrespective of the computational details, all investigations predict a large increase of the surface abundance of He and a significant enhancement of the carbon abundance in the envelope.
An alternative scenario for explaining the presence of ‘blue hook’ stars is related to the observed split of the MS. Lee et al. (2005) were the first to suggest that ‘blue hook’ stars are the progeny of the He-rich MS. At odds with the He-flash induced mixing scenario, if ‘blue hook’ stars were to be explained by the helium-enrichment scenario, their surface He abundance should not exceed the value estimated for the blue MS (0.38) and C should not be enriched at all. Interestingly enough, we now know that NGC 2808, the other GC hosting ‘blue hook’ stars, shows also the splitting of its MS in three distinct sequences (D’Antona et al. 2005, Piotto et al. 2007).
Early spectroscopic measurements for 12 ‘blue hook’ candidates performed by Moehler et al. (2002) confirmed that these stars are indeed both hotter and on average more He-rich than the canonical extreme HB stars. A more recent analysis (Moehler et al. 2007) has shown that at least 15% of the hottest HB stars in Cen have a surface He abundance larger than predicted by the He enrichment scenario. In addition, the most He-rich stars also have enhanced surface carbon abundance, in good agreement with the He-flash induced mixing scenario. From these spectroscopic observations, it appears that the He enrichment scenario cannot account for all ‘blue hook’ stars.
Quite recently, an additional puzzling result has been obtained by Calamida et al. (2008). They measured the ratio of White Dwarfs (WDs) to MS star counts to be is at least a factor of two larger than the theoretical value predicted from the ratio of Carbon-Oxygen (CO) core WD cooling times to MS lifetimes. This discrepancy can be solved only by assuming the presence of a significant fraction –ranging from 10% to 80%, depending on their masses– of He-core WDs.
To gain additional information about the evolutionary properties of the various subpopulations harbored by this cluster, we take advantage of a rich and nearly complete ACS on board HST photometric optical data-set for the HB of Cen. The color-magnitude-diagram (CMD) shows a prominent and well populated feature at the faint end of the HB. The density of stars in this feature is definitely higher than immediately beyond its brighter, cooler end. Our aim is to investigate how this feature relates to the ‘blue hook’ discovered in UV filters and, more generally, what are the constraints imposed by the observed HB population on the progeny of the blue MS subpopulation. Section 2 describes the data and an analysis of the ‘blue hook’ population based on the comparison with suitable evolutionary models. In Section 3, we compare observed star counts along the HB with theoretical expectations for the ratio between the progeny of the blue and red main sequences; a summary follows in Section 4.
2 The photometric data and comparison with stellar models
The data set used in this work consists of a mosaic of fields obtained with the ACS/WFC (GO-9442, PI A. Cool) through the F435W and F625W filters. Each of these fields has one short (about 10 s) and three long exposures (about 340 s) in both F435W and F625W. The ACS/WFC mosaic covers the inner centered on the cluster. The images were reduced and presented in Anderson & van der Marel (2009) using the software described in great detail in Anderson et al. (2008). Briefly, the program finds and measures each star in all exposures simultaneusly by fitting a spatially-variable effective point-spread function. Instrumental magnitudes were transformed into the ACS Vega-mag flight system following the procedure given in Bedin et al. (2005), using the zero points of Sirianni et al. (2005).
The PSFs used here were constructed from the bright, isolated stars in the many exposures, using the approach discusses in Anderson & King (2006), wherein we model PSF as the sum of a spatially variable but temporally constant part and a spatially constant but temporally variable perturbation, to account for breathing-related focus changes. Even this sophisticated model cannot account for all the subtle variations of the HST PSF, so to deal with the residual PSF errors and to account for possible reddening variations across the field, we used a method similar to that adopted in Milone et al. (2008) and Sarajedini et al (2007). This method involves fitting the average cluster sequence with a MSRL (main-sequence ridgeline), examining how the stars within a local region may lie systematically to the blue or red of this sequence, and constructing a spatial correction to remove this systematic trend. The maximum correction made here was 0.034 mag in color, but is typically less than 0.01 mag. Artificial-star tests indicate that the completeness is greater than 95% for all stars along the HB.
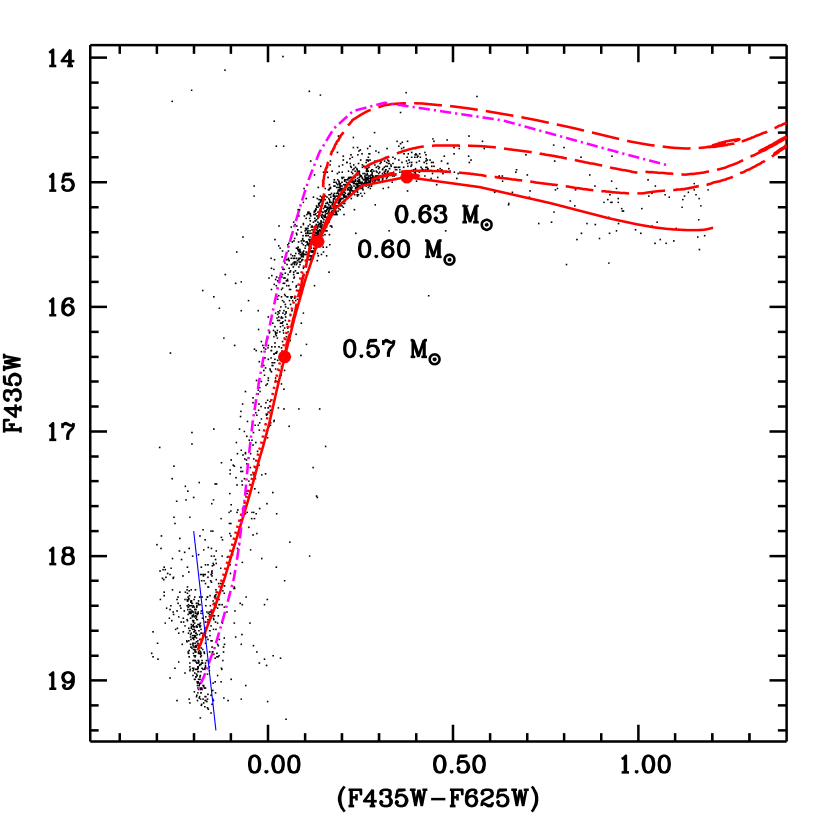
The CMD is displayed in Fig. 1 and shows the well known, complex stellar population harbored by the cluster (see, e.g. Villanova et al. 2007 for a brief summary). Here we focus our attention on the HB, populated by about 2200 objects in our CMD. To start our analysis, we derive a distance modulus and reddening by fitting ZAHB models from the BaSTI database by Pietrinferni et al. (2006) for [Fe/H]=1.62 ([/Fe]=0.4) and initial He mass fraction =0.246 (hereinafter they will be denoted as ’reference’ models) to the observed HB. This chemical composition is consistent with the metal content of the main stellar component of Centauri ([Fe/H]1.7, e.g. Villanova et al. 2007, Sollima et al. 2008). We derive =14.32 and E(F435WF625W)=0.22. Following the results by Bedin et al. (2005), this reddening corresponds to E(B-V)=0.15 and =0.63 using the Cardelli, Clayton & Mathis (1989) extinction law with =3.1. The estimated true distance modulus is therefore =13.69. This quick estimate of distance and reddening is sufficient for the purposes of this investigation, and compares very well with obtained from the work by Thompson et al. (2001) on the cluster eclipsing binary OGLEGC17, using surface brightness vs. infrared color relationships, and their assumed reddening E(B-V)=0.130.02. It is also consistent with the estimate (random and systematic error) obtained by Del Principe et al. (2006) employing a near-infrared Period-Luminosity relation of RR Lyrae stars.
We wish to notice here that the models employed in this distance/reddening estimate and in the rest of this paper do not take into account the effect of radiative levitation of metals in the atmospheres of HB stars, that appears to be efficient in objects with hotter than 11 000 K (see, e.g. Gründahl et al. 1999, Behr 2003 and references therein). To have a first order estimate of the magnitude of this effect, we have transformed the theoretical ZAHB models with larger than 11 000 K (corresponding approximately to the ZAHB location of the 0.6 model) to the photometric bands of our CMD, using bolometric corrections computed for [Fe/H]=0.0, i.e. an iron abundance consistent with the spectroscopic measurements by Behr (2003) in globular cluster HB stars hotter than 11 000 K. This fictitious ZAHB with enhanced metals in the atmosphere overlaps almost perfectly with the canonical one in the relevant range, differences in the F435W magnitudes [at fixed (F435WF625W) color] being of the order of 0.05 mag (enhanced metal models being brighter) decreasing when moving to the blue end of the HB.
Figure 2 displays the fit of our reference ZAHB (solid line) to the photometry of the HB stars. The constraint on comes essentially from the overdensity of stars at and around the ’knee’ of the observed HB distribution [i.e., around (F435WF625W)], whereas the reddening is constrained by the fit to the bright vertical part of the blue HB. The stars at the red end of the ’knee’ [F435WF625W) between 0.3 and 0.5 mag] appear to be largely evolved off the ZAHB, and the red part of the HB is only very sparsely populated. Beyond the blue edge of the ’knee’ the number of HB stars also decreases sharply. Three selected HB evolutionary tracks for 0.57, 0.60 and 0.63 are also plotted, to show the approximate mass range corresponding to the ’knee’ of the HB distribution. At the blue end of the observed HB we have marked (thin solid line) the boundary of a well populated (about 400 objects) almost vertical, clump-like feature, that extends also well below the theoretical ZAHB, by 0.5 mag in F435W. The density of stars in the feature is definitely larger than on the cooler side of the indicated redder limit. The of the objects populating this feature is larger than 30 000 K, using the colour- relation from the reference ZAHB. No reasonable variations of distance modulus/reddening/metallicity can change the fact that this feature extends to magnitudes fainter than ZAHB models. This occurrence mirrors the discovery of ‘blue hook’ stars in far-UV observations of this cluster (Whitney et al. 1998; D’Cruz et al. 2000) i.e. a population of hot HB stars, lying beyond canonical ZAHB models.
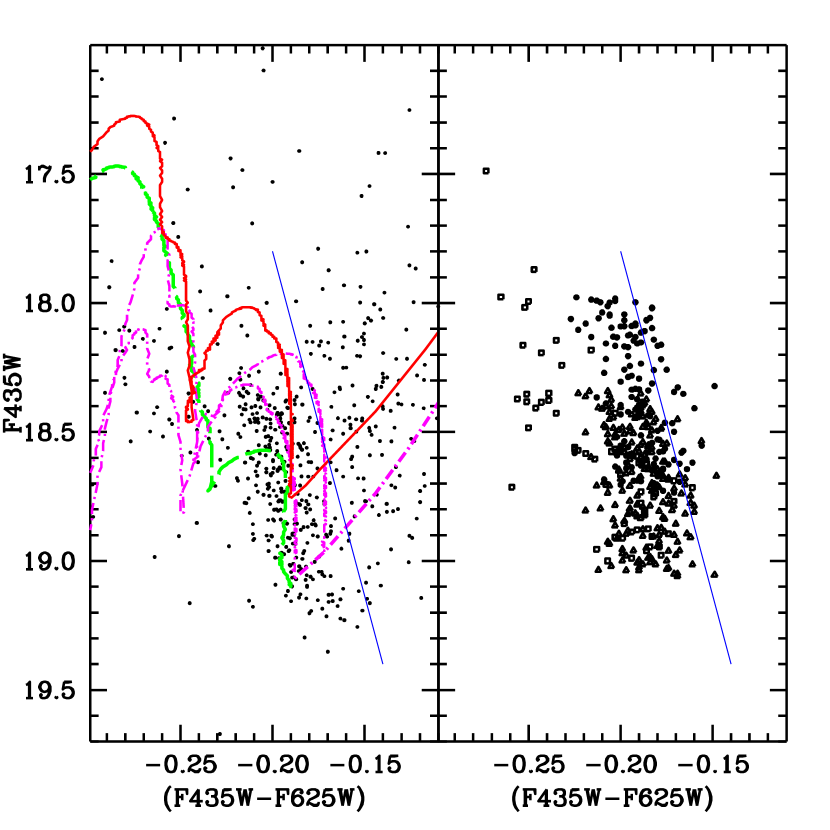
The large population of HB stars in our CMD allow us to investigate the origin of the objects populating this feature. From now on we will denote them as ‘blue clump’ stars. The left panel of Fig. 3 displays an enlargement of the ‘blue clump’ region, with overimposed the ZAHB and evolutionary track of the least massive () canonical HB model (solid line) for the reference composition [Fe/H]=1.62 ([/Fe]=0.4, Y=0.246). The plot also shows a hot flasher model (dotted line) from Cassisi et al. (2003) for a mass typical () of the hot flasher progeny of the canonical, reference ([Fe/H]1.7) population. Two -enhanced HB models (dashed lines) plus the ZAHB locus representative of the He-rich subpopulation with =0.0016 and =0.4 (corresponding to [Fe/H]). These He-enhanced HB models would correspond to the progeny of the blue MS stars identified by Bedin et al. (2004) therefore their iron content has been chosen consistent with the [Fe/H] estimate obtained for the blue MS stars by Piotto et al. (2005).
Employing only reference HB models does not allow to reproduce this feature. Photometric errors at these magnitudes are equal to only mag in both filters, therefore the existence of largely underluminous stars ( mag) below the canonical reference ZAHB cannot be explained in terms of a photometric spread. The hot-flasher model, with , can reach fainter F435W magnitudes, and is therefore a better candidate to explain the presence of these stars. We also wish to notice that the use of models with different total mass for the hot flashers would not modify the outlined scenario since, as has been shown by Brown et al. (2001, but see also Miller Bertolami et al. 2008) all hot flasher models tend to cluster in a very narrow region of the CMD, regardless of their total mass.
Canonical HB models originated from a He-rich population can also reproduce the bulk of the ‘blue clump’ stars (although, as for the case of hot flashers, a few objects remain underluminous compared to theoretical models). The two models displayed in Fig. 3 have masses equal to 0.460 and 0.461 , respectively.
As a note of caution we recall here that all the evolutionary sequences have been translated from the theoretical H-R diagram to the observational CMD by using the color- relation and bolometric corrections provided by Bedin et al. (2005), based on synthetic spectra computed by assuming scaled solar abundances. As shown by Brown et al. (2001), these spectra do not represent accurately the peculiar atmospheres of hot flashers, because these stars are expected to have strongly enhanced He and C abundances at the surface. More in detail, for the atmospheres of hot flashers, Brown et al. (2001 – see their Fig. 11) have shown that an atmospheric composition of 96% He and 4% C (or N) produces lower fluxes in the F435W filter, compared to a standard metal mixture. Therefore, for the hot flasher model one should use more appropriate –but not yet available– bolometric corrections, that however we do not expect to alter the basic conclusions of this analysis. As for the He-rich stellar population, Girardi et al. (2007) have shown that the effect of an enhanced He content –of the order of 0.2– on bolometric corrections and colors is negligible at the values corresponding to hot HB stars.
To summarize the result of the previous comparisons, the ‘blue clump’ feature in our optical CMD appear to be reproduced by either hot flashers or canonical He-rich HB stars or a mixture of both types, plus possibly also a contribution, at least for the brighter part, from the reference HB population. The striking result is that such a sharp feature can be produced only by stars in an extremely narrow range of masses, up to at most only 0.03, according to the models discussed above.
To corroborate these conclusions, based only on the comparison of individual HB tracks and ZAHB models, we have computed some synthetic HB models taking into account the ‘spectroscopical classification’ of the hottest stars along the HB of Cen obtained by Moehler et al. (2007). They found that out of 40 objects hotter than 30 000 K, at least 15% show extreme enhancements of He and should be the observational counterpart of hot flashers, 35% are He-poor stars that we associate to the reference HB models, and 50% have enhanced He but below the value for the hot flashers, and we identify them as canonical HB stars produced by the He-rich population. Some of the objects in this last group could also be hot flashers, since they show He-abundances above =0.40.
The observations by Moehler et al. (2007) refer to a different cluster field and may be affected by completeness effect, but we use them here just to show how a mixture of these three types of objects can qualitatively reproduce this CMD ‘blue clump’ . We calculated a synthetic CMD using the same methods described in Salaris, Cassisi & Pietrinferni (2008), and employing the population ratios among the various components as given above. For the He-rich population we have considered the 0.460 model, and for the reference HB population the 0.491 model. We have included photometric errors coming from the data reduction, that are of the order of 0.01 mag. The right panel of Fig. 3 displays the synthetic CMD, with the same number of stars as observed, that shows clearly a CMD feature very similar to the observed ‘blue clump’ .
3 Star counts along the HB
As mentioned in the previous section, the range of masses involved populating the ‘blue clump’ in our optical CMD must be extremely narrow, 0.03 at most. Star counts along the observed HB displayed in Fig. 2 provide a fraction of ‘blue clump’ stars to redder HB objects equal to 222 %. The error estimate includes in quadrature the Poissonian error on the star counts and the error deriving from an uncertainty of 0.1 mag (in F435W) on the placement of the boundary of this feature.
As discussed before, the ‘blue clump’ in our CMD may be partly made of the progeny of the cluster He-rich population. It is therefore necessary to investigate whether the fraction of HB stars in the ‘blue clump’ is compatible with the fraction of He-rich stars seen along the MS phase. To answer this question we have estimated theoretically the fraction of HB stars expected to be generated by the He-rich subpopulation. We have first calculated the differential luminosity function (i.e. number of stars per magnitude interval) for both an isochrone with the reference composition and a He-rich one (same compositin of the He-rich HB models) from the MS to the tip of the RGB. We have used a Salpeter mass function and assumed that the two populations are coeval, with an age of 13.5 Gyr. The relative number of MS stars in the two populations has been normalized by requiring that the number ratio of the He-rich to the reference MS population is equal to 0.92, consistent with the value observed in this field by Bellini et al. (2009) for the stars in the magnitude interval between F435W=20.9 and 22.1. With the normalization in place, the theoretical luminosity functions provide the ratio of objects at the tip of the RGB belonging to the two populations. This value corresponds, in turn, to the ratio of the rates with which RGB stars of both populations are fed onto the HB.
It turns out that the rate for the He-rich component is about 30% of the value for the reference population. This result is practically unaffected when we decrease the age by 1 Gyr for the He-enhanced population. An age decrease of this order of magnitude is expected in case the latter population is produced from the ejecta of stars belonging to the reference population. The result is also only marginally affected by the choice of an initial mass function different than the Salpeter’s one, because the mass range spanned in the MS normalization is not large. We have recomputed this ratio using a flat mass function and one with a power-law exponent 3. The resulting ratio changes by only 0.5%.
To estimate the relative number of He-rich to reference composition progeny along the HB, is necessary to multiply the 30% value obtained before by the ratio between their HB evolutionary times. From Fig. 2 one can notice that along the HB the progeny of the He-rich population has to be located at F435W fainter than 17.2-17.4 mag, given that at brighter magnitudes the He-rich ZAHB is overluminous compared to the observed HB. This corresponds to masses smaller than . At F435W fainter than 17.4 mag the majority of stars is concentrated in the ‘blue clump’, and we therefore assume a typical HB mass equal to 0.460 for the He-rich progeny (see Fig 3).
On the other hand, the typical mass of the reference HB component has to be between 0.57 and 0.63 , corresponding to the objects along the extremely well populated knee of the observed HB (see Fig 2). Masses in this range have all extremely similar central He-burning lifetimes, differing by less than 5%, and as representative value we employed the lifetime of the 0.60 model.
With these estimates the theoretical HB lifetime ratio results to be equal to 1.6, the He-rich progeny being longer lived. The expected ratio between the progeny of the He-rich component and the progeny of the reference population is therefore equal to . On the observational side, even if we consider all HB stars with F435W fainter than 17.4 mag (about 600 objects) being the progeny of the He-rich population, the observed ratio between He-rich and reference HB progeny is equal to 0.370.03, lower than the theoretically expected value. Any contamination of the HB at F435W17.4 by the progeny of the reference population [as expected in case Moehler et al. (2007) results were to be valid also for this cluster field] would exacerbate this discrepancy.
Our result implies that at least 15% (about 100 objects) of the expected He-rich HB stars are unaccounted for. This means that their RGB progenitors have lost enough mass to avoid central He-ignition, and ended up along the He-core WD sequence. There is here an important connection with Calamida et al. (2008) result about the WD counts, that has been obtained by studying exactly the same cluster fields. These authors conclude that a fraction of He-core WDs ranging from 80% (for a mean mass of 0.5 for the CO-core and 0.3 for the He-core WDs) to 10% (for a mean mass of 0.5 for the CO-core and 0.23 for the He-core WDs) is necessary to explain their data. The ’missing’ progeny of the He-rich MS is a realistic candidate to produce at least a fraction of these He-core WDs. The WDs included in Calamida et al. (2008) calculations are bright, i.e. they are cooling fast and have been produced by objects that have just left the HB, or the RGB in case of He-core WDs. The ratio of the number of ’missing’ He-rich HB objects to the total number of HB stars is therefore a reasonable approximation of the fraction of bright He-core WDs. Assuming that all missing He-rich HB stars have become He-core WDs, they could provide a fraction of the order of 5% of the total WD population. This contribution would be higher in case the reference population contributes also to the HB population with F435W17.4.
We close this section with some considerations about the amount of mass that RGB stars need to lose to satisfy the constraints posed by HB models. The turn off mass of the He-rich population is equal to for an age of 13.5 Gyr. This means that a RGB mass loss between only 0.08 and is needed to populate the HB for F435W17.4. If the age of the two populations is decreased to 11 Gyr, the amount of mass lost along the RGB should be increased by only 0.03 , because of the slightly larger turn off mass. In case of the reference population the bulk of the HB stars should be populating the ’knee’ of the observed HB, given the turn off mass of for the assumed cluster age, this implies a mean mass loss of 0.17 (that has to be increased by 0.04 for an age of 11 Gyr) before settling on the HB. Very recently McDonald et al. (2009) have estimated that RGB stars in Cen lose typically about also from considerations about the colors of HB stars and assumptions about the cluster age.
4 Summary
Using accurate optical photometric data collected with ACS on board HST, we have focused on a peculiar clump of stars at the hottest end of the HB of Cen, that we have termed ‘blue clump’. Using theoretical stellar models we have tried to trace the evolutionary channel(s) able to produce this feature. In particular, we tried to determine possible links with the peculiar He-rich sub-population already identified in this cluster.
Our analysis indicates that the ‘blue clump’ can be reproduced by either hot flashers or canonical He-rich HB stars or a mixture of both types, plus possibly also a contribution, at least for the brighter part, from the reference HB population. The objects in the ‘blue clump’ have to span an extremely narrow range of masses, up to at most only 0.03.
When we combine the observed population ratios along the MS, the theoretical evolutionary timescales along MS, RGB and HB, and take into account the difference in luminosity between the ZAHB of the reference population and the He-rich one, we find that at least 15% of the expected He-rich HB stars are unaccounted for. The exact fraction depends on how many stars with F435W17.4 belong to the reference population. A non-zero contribution implies a larger fraction of missing He-rich HB stars. Our results imply that a fraction of He-rich stars failed to experience the He-flash along the RGB and have produced instead He-core WD. They should therefore contribute - at the level of at least about 5% - to the fraction of He-core WDs suggested by Calamida et al. (2008) to explain the observed ratio between WDs and MS star counts.
References
- (1) Anderson, A.J. 1997, PhD Thesis, University of California, Berkeley
- (2) Anderson, A.J. & King I. R. 2006, Space Telescope Science Institute, ISR-ACS, 2006-01
- (3) Anderson, A.J. et al. 2008, AJ, 135, 2055
- (4) Anderson, A.J. & van der Marel, R. 2009, ApJ submitted, arXiv:0905.0627
- (5) Bedin, L. R., Piotto, G., Anderson, J., Cassisi, S., King, I. R., Momany, Y., & Carraro, G. 2004, ApJ, 605, L125
- (6) Bedin, L. R. et al. 2005, MNRAS, 357, 1038
- (7) Behr, B.B. 2003, ApJS, 149, 67
- (8) Bellini, A. et al. 2009, A&A, submitted
- (9) Brown, T.M., Sweigart, A.V., Lanz, T., Landsman, W.B., & Hubeny, I. 2001, ApJ, 562, 368
- (10) Busso, G., Cassisi, S., Piotto, G., Castellani, M., Romaniello, M., Catelan, M., Djorgovski, S. G., et al. 2007,A&A, 474, 105
- (11) Calamida, A., et al. 2008, ApJ, 673, L29
- (12) Cardelli, J. A., Clayton, G. C., & Mathis, J. S. 1989, ApJ, 345, 245
- (13) Cassisi, S., Schlattl, H., Salaris, M., & Weiss, A. 2003, ApJ, 582, L43
- (14) Castellani, M., & Castellani, V. 1993, ApJ, 407, 649
- (15) D’Antona, F., Bellazzini, M., Fusi Pecci, F., Galleti, S., Caloi, V., & Rood, R.T. 2005, ApJ, 631, 868
- (16) Del Principe, M. et al. 2006, ApJ, 652, 362
- (17) D’Cruz, N. L., et al. 2000, ApJ, 530, 352
- (18) Girardi, L., Castelli, F., Bertelli, G., & Nasi, E. 2007, A&A, 468, 657
- (19) Gründahl, F., Catelan, M., Landsman, W. B., Stetson, P. B., & Andersen, M. I. 1999, ApJ, 524, 242
- (20) Lee, Y. W., et al. 1999, Nature, 402, 55
- (21) Lee, Y. W., et al. 2005, ApJ, 621, L57
- (22) McDonald, I., et al. 2009, MNRAS, in press, (arXiv:0812.0326)
- (23) Miller Bertolami, M. M., Althaus, L. G., Unglaub, K., & Weiss, A. 2008, A&A, 491, 253
- (24) Milone, A.P., et al. 2008, ApJ, 673, 241
- (25) Moehler, S., Sweigart, A.V., Landsman, W.B., & Dreizler, S. 2002, A&A, 395, 37
- (26) Moehler, S. et al. 2007, A&A, 475, L5
- (27) Momany, Y., Piotto, G., Recio-Blanco, A., et al. 2002, ApJ, 576, L65
- (28) Momany, Y., Bedin, L. R., Cassisi, S., et al. 2004, A&A, 420, 605
- (29) Pancino, E., Ferraro, F. R., Bellazzini, M., Piotto, G., & Zoccali, M. 2000, ApJ, 534, L83
- (30) Pietrinferni, A., Cassisi, S., Salaris, M., & Castelli, F. 2006, ApJ, 642, 797
- (31) Piotto, G. et al. 2005, ApJ, 621, 777
- (32) Piotto, G., et al. 2007, ApJ, 661, L53
- (33) Rey, S. C., Lee, Y. W., Ree, C. H., Joo, J. M., Sohn, Y. J., & Walker, A. R. 2004, AJ, 127, 958
- (34) Rosenberg, A., Recio-Blanco, A., & García-Marín, M. 2004, ApJ, 603, 135
- (35) Salaris, M., & Cassisi, S. 2005, ‘Evolution of Stars and Stellar Populations’, Wiley eds. (London)
- (36) Salaris, M., Cassisi, S., & Pietrinferni, A. 2008, ApJ, 678, L25
- (37) Sarajedini, A. et al. 2007, AJ, 133, 1658
- (38) Sirianni, M. et al. 2005, PASP, 117, 1049
- (39) Sollima, A., Ferraro, F. R., Bellazzini, M., Origlia, L., Straniero, O., & Pancino, E. 2007, ApJ, 654, 915
- (40) Sollima, A., Ferraro, F. R., Pancino, E., & Bellazzini, M. 2008, MemSaIt, 79, 342
- (41) Sollima, A., Pancino, E., Ferraro, F. R., Bellazzini, M., Straniero, O., & Pasquini, L. 2005, ApJ, 634, 322
- (42) Sweigart, A.V. 1997, in ‘The Third Conference on Faint Blue Stars’, A. G. D. Philip, J. Liebert, R. Saffer and D. S. Hayes eds., L. Davis Press, p. 3
- (43) Thompson, I. B., Kaluzny, J., Pych, W., et al. 2001, AJ, 121, 3089
- (44) Villanova, S., et al. 2007, ApJ, 663, 296
- (45) Whitney, J. H., et al. 1994, AJ, 108, 1350
- (46) Whitney, J. H., Rood, R. T., O’Connell, R. W., et al. 1998, ApJ, 495, 284