INTEGRAL and Swift/XRT observations of IGR J16460+0849
Abstract
Aims. IGR J16460+0849 is reported in the 3rd IBIS catalog with the shortest exposure of about 10 ks among all the detected sources, which makes it the most interesting target to be investigated with a deeper exposure. The currently available data have increased to an exposure time of a few hundred ks. This stimulates us to investigate the source again by using all the available data.
Methods. We analyze all available observations carried out by the International Gamma-Ray Astrophysics Laboratory (INTEGRAL) on the unidentified source IGR J16460+0849. The data were processed by using the latest version OSA 7.0. In addition we analyze also all the available Swift/XRT data on this source.
Results. We find that IGR J16460+0849 has a detection significance of 4.4 in the 20-100 keV band during the observational period between March 2003 and September 2004, when it was exposed by 19 ks. Thereafter the source was not detected anymore, despite an additional exposure of 271 ks. This suggests a flux variability on a timescale of years. The spectral analysis shows that the IBIS/ISGRI data are well presented by a power-law shape, with a photon index obtained as 1.450.86. So far, the source has been detected consistently by IBIS/ISGRI in the subsequent observations and in the adjacent energy bands. We have analyzed the Swift/XRT observations on IGR J16460+0849 as well, and found no source inside the IBIS/ISGRI error circle. The non-detection during the Swift/XRT observation is consistent with the source having a variable nature.
Key Words.:
X-rays: individual: IGR J16460+08491 INTRODUCTION
Totally 421 sources are listed in the 3rd IBIS/ISGRI catalog (Bird et al. 2007). Among them are 171 Galactic accreting systems, 122 extragalactic objects, and 113 of unknown nature. The diagram of detection significance versus net exposure for the unidentified sources is shown in Fig. 1. The net exposure refers to the corrected on-source exposure, e.g. omitting observations taken during periods of solar activity or near the spacecraft perigee passages when the background modeling is difficult (Bird et al. 2007). Most sources have significances at the 5-7 level and are detected under relatively large observational time of above hundreds ks. In these cases, an additional exposure will not lead to a large increment in source significance. However, the exceptions are IGR J06292+4858 and IGR J16460+0849. They are detected with a net exposure of only 14 ks and 11 ks, respectively. While for IGR J06292+4858 almost no additional exposure is available since Bird’s report in 2007, the situation has improved a lot for IGR J16460+0849. Therefore IGR J16460+0849 is the promising candidate for further analyses in the hard and soft X-ray bands, by using all currently available INTEGRAL and Swift/XRT data.
In this note we report the results from our INTEGRAL and Swift/XRT analyses on IGR J16460+0849, carried out by using the most updated analysis tools. The paper is structured as follows: the observations and the data analyses are described in Sect.2, the results are presented in Sect.3, and finally in Sect.4 we give the discussion and the summary.
2 OBSERVATIONS AND DATA ANALYSIS
2.1 INTEGRAL
INTEGRAL (Winkler et al. 2003) is a 15 keV - 10 MeV -ray mission. The main instruments are the imager onboard INTEGRAL (IBIS, 15 keV - 10 MeV) (Ubertini et al. 2003) and spectrometer (SPI, 20 keV - 8 MeV) (Vedrenne et al. 2003). They are supplemented by the Joint European X-ray Monitor (JEM-X, 3-35 keV) (Lund et al. 2003) and the Optical Monitor Camera (OMC, V, 500-600 nm) (Mas-Hesse et al. 2003). At the lower energies (15 keV - 1 MeV), the CdTe array ISGRI (Lebrun et al. 2003) of IBIS has a better continuum sensitivity than SPI. The satellite was launched in October 2002 into an elliptical orbit with a period of 3 days. Due to the coded-mask design of the detectors, the satellite normally operates in dithering mode, which suppresses the systematic effects on spatial and temporal backgrounds.
The INTEGRAL observations are carried out in the so-called individual SCience Windows (SCWs), with a typical time duration of about 2000 seconds each. Only IBIS/ISGRI public data have been taken into account, while JEMX data are not available because the source was outside its FOV. The data reduction has been performed by using the standard Online Science Analysis (OSA) software version 7.0, the latest released version. The results are obtained by running the pipeline from the flowchart to the image level. The flux and the detection significance are measured from the mosaic map at the source position reported previously by Bird et al. (2007).
2.2 Swift/XRT
SWIFT is a -ray burst explorer launched 2004 November 20. It carries three co-aligned detectors (Gehrels et al. 2004), the Burst Alert Telescope (BAT, Barthelmy et al. 2005), the X-Ray Telescope (XRT, Burrows et al. 2005), and the Ultraviolet/Optical Telescope (UVOT, Roming et al. 2005). We took only Swift/XRT data into account, bacause BAT data were not available. The XRT uses a grazing incidence Wolter I telescope to focus X-rays onto a state-of-the-art CCD. XRT has an effective area of 110 cm2, a FOV of 23.6 arcminutes, an angular resolution (half-power diameter) of 15 arcseconds, and it operates in the 0.2-10 keV energy range, providing the possibility of extending the investigation on the unidentified source to soft X-rays with the available SWIFT observations.
There is one SWIFT snapshot available for IGR J16460+0849 with an exposure of 4949 seconds. The observation was carried out on 2007 October 23 in the photon counting mode and has ID 00037052001. We analyzed the Swift/XRT 0.2-10 keV data by using the latest released analysis software, provided in HEAsoft version 6.4.
3 RESULTS
3.1 INTEGRAL
The available INTEGRAL observations, when IGR J16460+0849 falls into the partially coded field of view of ISGRI (offset angle less than 19 degrees), comprise about 290 SCWs, adding up to a total exposure time of 511 ks (until 2006 August 25). The details of the analyzed INTEGRAL observations on IGR J16460+0849, including the exposure and the time period, are summarized in Table 1. Most of these observations were carried out in the 5x5 dithering mode. We subdivided the data into 5 groups according to the observational sequence. For most of the time the source was at the edge of the field of view, at an offset angle of more than 14 degrees. In what follows the results are reported from the observations during which the source has the offset angle of less than 14 degrees.
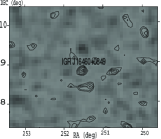
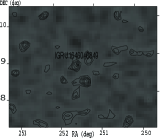
The imaging analyses show that the source is only detected by summing the first three observational groups (MJD 52725-53259). It is not detected afterwards, although the exposure is increased by a factor of 14. The best source detection, 4.4 at 20-100 keV (Fig. 2), is derived in the mosaic map of the first 3 observational groups. The flux in units of mcrab and the detection significance derived from each observational group in the 20-100 keV band are summarized in Table 1. We also generate the images in the 20-40 keV and 40-100 keV bands, with the combined observations of the revolutions 0056-0235 (MJD 52725.0-53259.0). We derive the fluxes of 7.4 mcrab and 12.4 mcrab for the two energy bands, respectively.
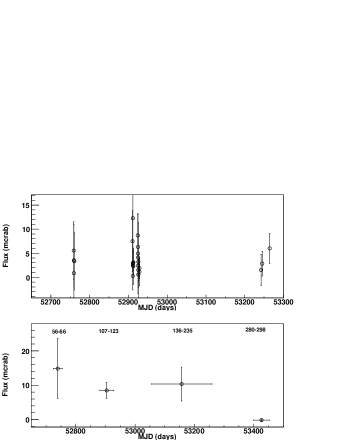
We produce in Fig. 3 the SCW lightcurve for the observational groups containing the revolutions 0056-0235 (MJD 52725.0-53259.0), during which the source is observed to have the highest detection significance. There are only a few SCWs with source offset angle of less than 14 degrees existing in each of the three observational groups. This prevents us from making a rough estimate of the duration of the source activity on a short time scale. To improve the statistics, we add the SCWs in each observational group together and produce the group lightcurve (Fig. 3). This lightcurve shows that the source stands out persistently during the first three observational groups 0056-0235 (MJD 52725.0-53259.0), and does not become detectable thereafter. The average flux drops from roughly 9 mcrab of the first three groups to an undetectable level of the later, clearly suggesting a flux variability over a time scale of years.
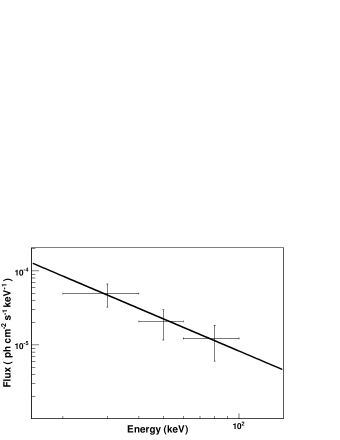
The source spectrum is extracted from the observational sequence of the revolutions 0056-0235 (MJD 52725.0-53259.0) where the highest detection significance is presented. The detection significances of the source in the energy bands 20-40 keV, 40-60 keV, and 60-100 keV are measured as 2.9 , 2.3 , and 2.0 , respectively. These data are well-fitted with a simple power-law model (see Fig. 4), with the photon index derived as 1.450.86 under a reduced of 0.1. The degree of freedom in the spectral fitting is 1.
3.2 Swift/XRT
The Swift/XRT imaging analysis (5 ks exposure time) does not show any detected source inside the IBIS error circle (5 arcminutes radius). We conclude that IGR J16460+0849 was not detected by Swift/XRT below 10 keV during this snapshot of 5 ks. Knowing the sensitivity of the XRT, we can put an upper limit on the source flux. With an XRT sensitivity of about 210-14 erg cm-2 s-1 in an exposure time of 10 ks (see Capalbi et al. 2005), we estimate an upper flux limit of 310-14 erg cm-2 s-1 from an observation of 5 ks. By extrapolating the ISGRI spectrum to energies below 10 keV, we have an integral flux of 1.310-10 erg cm-2 s-1 for the band 0.2-10 keV. We would therefore expect a bright X-ray source from Swift/XRT exposure of 5 ks if it was active at the time. The non-detection again shows that the source was variable and its flux dropped to a level below Swift/XRT threshold.
4 Discussion and summary
Bird et al. (2007) reported IGR J16460+0849 as an INTEGRAL hard X-ray source at a detection significance of 4.7 in the 20-100 keV from a net exposure of 11 ks. Our analyses agree with Bird’s result, using the latest software release. We find a source at a significance level of 4.4 in the sum of the observations between March 2003 and September 2004. The source was not detected later, and the exposure increased to 271 ks. This suggests the source is most likely variable on the timescale of years if the detected signal is real.
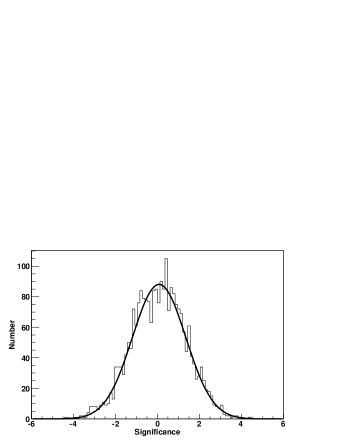
As listed in the 3rd IBIS catalog (Brid et al. 2007), IGR J16460+0849 belongs to a group of sources with low significances 5 . About 10-20 percent of them might result from false detections (Bird et al. 2007). We notice that the map (Fig. 2), where the source has the highest significance in detection, is rather noisy. To check whether this is statistical, we generated the histogram of the significance distribution. We find that the significance value for IGR J16460+0849 is consistent with the wing of a Gaussian shape, which fits this distribution well (see Fig. 5). The 1 variance of this distribution is about 1.27 and, accordingly, the probability of having a detection of 4.4 decreases to 4.4/1.27 3.5 sigma under such a distribution. Nevertheless. we tend to believe the detected signal is more likely related to a real source, since even under such a low detection significance we still have (1) the signals existing in adjacent three energy bands which can be well fitted by a simple power law shape and, (2) the signals showing up in subsequent three observational groups over a time period of almost 1.5 years. Moreover, by comparing the mosaic maps derived from the first three observational groups but with different source offset angles (14 degrees, Fig. 2 left panel; 19 degrees, Fig. 2 right panel), we find that IGR J16460+0849 stands out consistently in both maps, while the noise structures can fluctuate considerably.
Bird et al. (2007) report a location of = 16h45m57s; +08d49m05s (l/b = 26.297∘/31.853∘) for IGR J16460+0849 with an error circle at the 90 percent confidence level of about 5 arcminutes. A SIMBAD search within this error location yields no known source. The source location at middle Galactic latitude most probably indicates an extragalactic origin, so far for all AGNs reported in 3rd IBIS catalogue, additional exposure leads to large increment in their significance, which clearly agrees with their AGN nature. However, on the contrary, for IGR J16460+0849, additional IBIS exposure does not lead to an increment of its significance but instead leads to a significant decrease. This agrees with the evidence that IGR J16460+ 0849 is very likely a variable source spending a considerable fraction of the time in a “non active state”, during which it is below the Swift/XRT and IBIS threshold.
In summary, the most recent analyses carried out with the latest software releases again show a hint of a source signal from IGR J16460+0849. This is consistent with the previous report from Bird et al. (2007). The high Galactic latitude of IGR J16460+0849 suggests an extragalactic origin, but more data and further studies are needed to shed light on its nature.
| Rev. | Date | Expo.(a) | Flux | Sig. |
| MJD | ks | mcrab | ||
| 0056-0066 | 52725.0-52755.0 | 2.7(14) | 14.88.7 | 1.7 |
| 0107-0123 | 52880.5-52927.5 | 11.7(52) | 8.52.4 | 3.6 |
| 0136-0235 | 53055.0-53259.0 | 5.0(40) | 10.35.0 | 2.1 |
| 0280-0298 | 53399.1-53453.0 | 271(272) | 0 | 0 |
| 0345-0472(b) | 53592.7-53972.3 | 0(133) | – | – |
| 0056-0235 | 52725.0-53259.0 | 20(106) | 9.02.0 | 4.4 |
| 0056-0472 | 52725.0-53972.3 | 300(511) | 0.040.2 | 0.2 |
-
the first value is the exposure with a source offset angle less than 14 degrees, and the value in parentheses is the exposure with a source offset angle less than 19 degrees.
-
b
the source is never at an offset angle less than 14 degrees.
-
Note:
The flux and the significance are presented in the energy band 20-100 keV for the data where the source was within an offset angle of 14 degrees.

Acknowledgements.
We thank the anonymous referee and Dr. Werner Collmar for the constructive comments that helped in improving our paper. This work was subsidized by the National Natural Science Foundation of China, the CAS key Project KJCX2-YW-T03, and the 973 Program 2009CB824800. J.-M. W. thanks the Natural Science Foundation of China for support via NSFC-10325313, 10521001, and 10733010.References
- Barthelmy et al. (2005) Barthelmy S.D., et al. 2005, Space Sci. Rev., 120, 143
- Bird et al. (2007) Bird A.J., et al. 2007, ApJS, 170, 175
- Burrows et al. (2005) Burrows D.N., et al. 2005, Space Sci. Rev., 120, 165
- Capalbi et al. (2005) Capalbi M., Perri M., Saija B., et al. 2005, in “The SWIFT XRT data reduction guide”
- Gehrels et al. (2004) Gehrels N., et al. 2004, ApJ, 611, 1005
- Lebrun et al. (2003) Lebrun F., Leray J.P., Lavocat P., et al. 2003, A&A, 411, L141
- Lund et al. (2003) Lund N., Budtz-Jorgensen C., Westergaard N.J., et al. 2003, A&A, 411, L231
- Mas-Hesse et al. (2003) Mas-Hesse J.M., Gimenez A., Culhane J.L., et al. 2003, A&A, 411, L261
- Roming et al. (2005) Roming P.W.A., et al. 2005, Space Sci. Rev., 120, 95
- Ubertini et al. (2003) Ubertini P., Lebrun F., Cocco G., et al. 2003, A&A, 411, L131
- Vedrenne et al. (2003) Vedrenne G., Roques J.-P., Schonfelder V., et al. 2003, A&A, 411, L63
- Winkler et al. (2003) Winkler C., Courvoisier T.J.-L., Di Cocco G., et al. 2003, A&A, 411, 1L