Review of High Energy Diffraction in Real and Virtual Photon Proton scattering at HERA
Abstract
The electron-proton collider HERA at DESY opened the door for the study of diffraction in real and virtual photon-proton scattering at center-of-mass energies up to 250 GeV and for large negative mass squared of the virtual photon up to GeV2. At GeV and GeV2, diffraction accounts for about 15% of the total virtual photon proton cross section decreasing to % at GeV2. An overview of the results obtained by the experiments H1 and ZEUS on the production of neutral vectormesons and on inclusive diffraction up to the year 2008 is presented.
This article is dedicated to Volker Soergel, Gustav A. Voss, to the memory of Björn H. Wiik, and to Antonino Zichichi, who steered HERA from a plan to reality.
1 Introduction
Diffraction is a well known phenomenon in optics. Since the sixties, diffraction phenomena are also known from particle physics, for instance from proton-proton scattering. In hadron-hadron scattering these processes are phenomenologically described by the exchange of a virtual, colourless and flavourless neutral object carrying no quantum numbers, called the Pomeron. The Pomeron seemed to couple to quarks [1, 2]. The possibility that the Pomeron may have a partonic structure had been discussed [3, 4, 5]. This point was stressed again [6, 7, 8] based on results from UA8 [9, 10] which were obtained in collisions at a center-of-mass (c.m.) energy of 630 GeV.
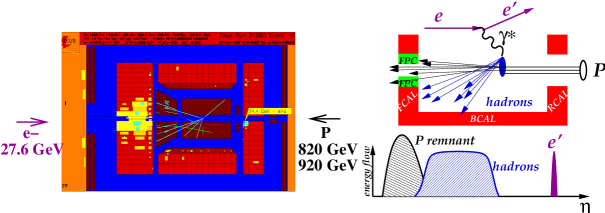
The electron (positron) collider HERA at DESY has opened a new avenue towards diffraction. In virtual photon-proton scattering, events can be studied where the spatial resolution provided by the virtual photon is much smaller than the proton radius such that the inner structure of the proton becomes visible. In the analysis of events with energy transfers between photon and proton of more than 10000 GeV - measured in the proton rest frame - the ZEUS collaboration [11] observed a special class of events, where a hadronic system is emitted close to the direction of the virtual photon, and separated by a large rapidity gap from a proton or low-mass nucleonic system emitted along the direction of the incoming proton. Such events were also detected by the H1 collaboration [12]. For comparison, standard events from deep-inelastic scattering exhibit uniform particle production in the rapidity space between the directions of the incoming virtual photon and the proton. The production characteristics of large rapidity gap events are those of a diffractive process in which no quantum numbers are exchanged in the t-channel, and where the cross section is found to be independent of the c.m. energy, up to logarithmic terms.
On the theoretical side, long before HERA had become a project, the authors of Ref. [13] had considered the possibility of producing a large mass object such as the Z-boson by diffractive deep-inelastic ep scattering and demonstrated that a viable production rate may be achieved. An extensive study of physics issues, such as diffraction, that could be addressed with a large electron proton collider had been presented by [14] before HERA was approved. A group of experimental physicists headed by A. Zichichi had insisted that a detector at HERA must be equipped with a magnetic spectrometer close to the outgoing proton beam for tagging protons which arise from diffractive scattering [15].
For large negative mass squared of the virtual photon (), the photon has a small transverse extension of the order ; for example, at GeV2 the transverse dimension of the photon is of the order of a few percent of the proton radius. Since small scales, in general, allow the use of perturbative methods, the data on scattering from HERA can be used to study diffractive scattering in the framework of QCD perturbation theory.
This article reviews the results obtained on diffraction in high energy photon-proton and deep-inelastic electron-proton scattering by the experiments H1 and ZEUS at HERA, which were in operation for physics between 1992 and 2007.
In order to put the results on diffraction into perspective the report starts with a brief review of the experimental results for the proton structure function and the total and cross section.
2 Kinematics of inelastic electron-proton scattering
The reaction
| (1) |
see Fig. 1, is described in terms of the four momenta of the incident (scattered) lepton ( or ) and proton (), with beam energies and , respectively. At fixed squared centre-of-mass energy, , deep-inelastic scattering is described in terms of and Bjorken-. The fractional energy transferred to the proton in its rest system is . The centre-of-mass energy of the hadronic final state, , is given by , where is the mass of the proton.
In diffraction, proceeding via
| (2) |
see Fig. 2, where , a hadronic system is produced. The incoming proton undergoes a small perturbation by the emission of a Pomeron, which in lowest order QCD can be represented by a two-gluon system. The proton emerges either intact (), or as a low-mass nucleonic state with mass , in both cases carrying a large fraction, , of the incoming proton momentum. Diffraction is described in terms of , , , and of , the four-momentum transfer squared between the incoming proton and the outgoing system . Alternatively, diffraction is parametrised in terms of , the fraction of the proton momentum carried by the pomeron, and , the momentum fraction of the struck quark within the pomeron:
| (3) | |||||
| (4) |
3 The H1 and ZEUS detectors
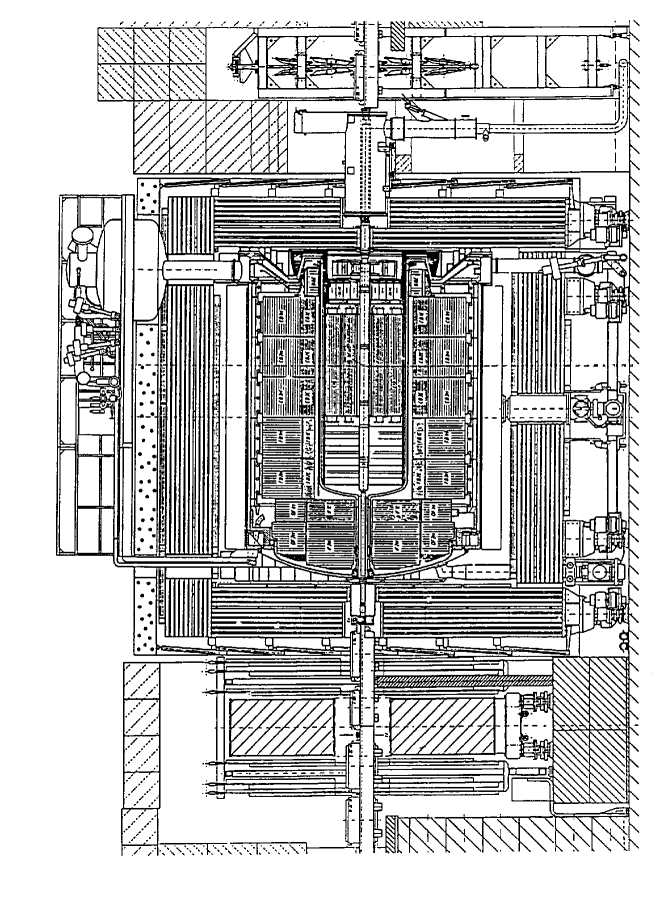
For the study of diffraction and of the total photon-proton cross section at HERA it was essential that the detectors of H1 [16, 17] and ZEUS [18, 19] covered the full solid angle (up to the beam pipe) with calorimetry. Figures 3 and 4 show side views of the two detectors. The H1 detector had tracking detectors around the interaction region and a large liquid argon calorimeter equipped with lead plates as absorber for particle detection. The ZEUS detector employed tracking detectors and a large, almost hermetic calorimeter consisting of Uranium plates interspaced with scintillator for signal collection, which provided equal response to electrons, photons and hadrons of the same momentum.
For a substantial fraction of the data taken by ZEUS, the forward area close to the outgoing proton beam (pseudorapidities , where and is the polar angle in radians) was instrumented with the Forward Plug Calorimeter (FPC), which had been inserted in the Uranium-scintillator calorimeter leaving a hole of only 3.15 cm radius for the passage of the beams. The FPC was a lead scintillator sandwich calorimeter with 5.4 nuclear absorption lengths that provided equal response to electrons and hadrons of the same energy [20].
Close to the direction of the outgoing proton beam, at a distance of about 100m from the central detector, H1 and ZEUS were equipped with spectrometers and calorimeters (not shown) for the detection of leading protons and neutrons.
4 The structure function of the proton
The differential cross section for inclusive ep scattering,
| (5) |
mediated by virtual photon exchange, is given in terms of the structure functions and of the proton by
| (6) |
where . In general, the structure function represents the main component of the cross section. In the deep-inelastic scattering (DIS) factorisation scheme, corresponds to the sum of the momentum densities of the quarks and antiquarks weighted by the squares of their electric charges; is the longitudinal structure function and is a term accounting for radiative corrections. The contribution of to the cross section relative to that from is given by . For the determination of by ZEUS [21, 22], the contribution was taken from the ZEUS NLO QCD fit [24]. The contribution of to the cross section in the highest (= lowest ) bin of this analysis was 3.2%, decreasing to 1.3% for the next highest bin. For the other bins, the contribution is below 1%. The resulting uncertainties on are below 1% [21, 22].
In the range considered here ( GeV2), the contributions from exchange and - interference were estimated to be at most 0.4% [21, 22] and were ignored.
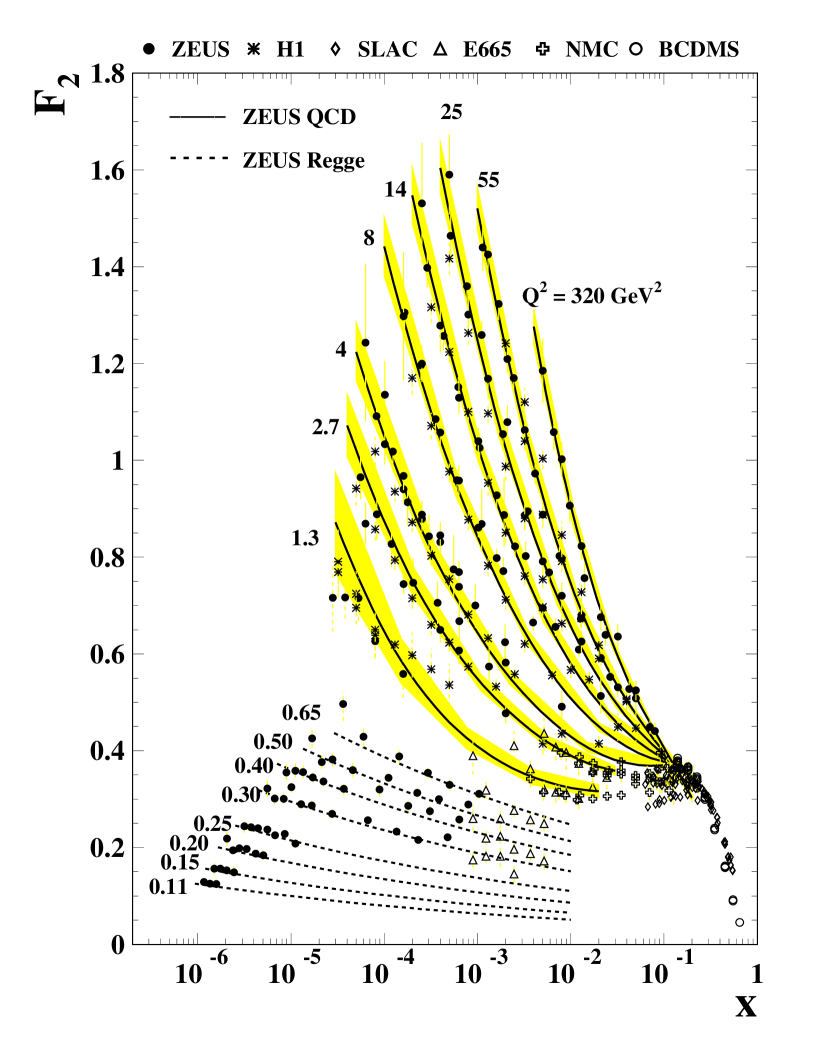
The structure function is shown in Fig. 5 as a function of for fixed . The results by H1 [23] and ZEUS [21, 22] are presented together with the results from the fixed target experiments [25], E665 [26], NMC [27] and BCDMS [28]. For between 0.11 and 0.65 GeV2 and , the structure function exhibits a modest rise as . At larger values of , starting from , is rising with decreasing , reaching a plateau around . Below and the HERA measurements show growing rapidly as ; the growth accelerates as increases from 1.3 to 320 GeV2.
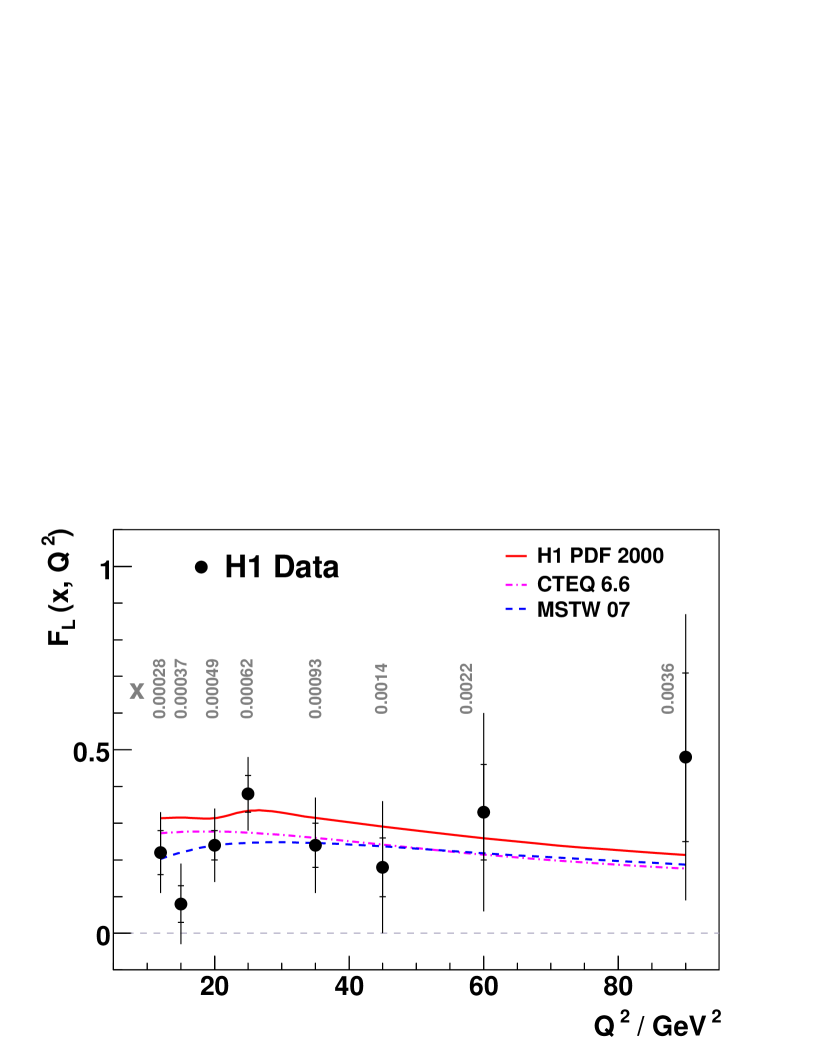
The most recent measurement of the longitudinal structure function at HERA, as provided by H1 [29], is shown in Fig. 6. Within errors, for the values measured.
The leading order (LO) and next-to-leading order (NLO) QCD diagrams for deep-inelastic electron proton scattering are shown in Fig. 7. The QCD-cascade which develops at large energies is illustrated by Fig. 8. The solid curves in Fig. 5 show the ZEUS next-to-leading order QCD fit [24] to data from ZEUS and fixed target experiments. The dashed curves were determined by a Regge fit to the low data from ZEUS [30].
The HERA data for can be represented in a compact form:
| (7) |
where in units of GeV2. A fit to the HERA data for GeV2 with 389 data points yielded , , , and , with . The fit gives a good representation of the data, see Fig. 9.
The data will be presented below also in terms of the total cross section for virtual photon proton scattering.
5 The total cross section for real and virtual photon-proton scattering
5.1 Real photons,
The total photon-proton cross section for real photons, , was measured by ZEUS [19, 32, 31] and H1 [33, 34] at several stages of the two experiments. The final results at the total photon proton center-of-mass energy are
H1: :
ZEUS: :
The HERA measurements are presented in Fig. 10 together with the low-energy results [35, 36]. For , the total-photon proton cross section exhibits a steep descent - on a logarithmic scale - with , followed by a rapid increase to the values measured at HERA. The solid curve shows a fit of the data to the form [31]
with in units of GeV, , , ; had been fixed to the value , found by [37, 38]. The dot-dashed curve shows a fit which includes a soft and a hard Pomeron trajectory [39].
5.2 Virtual photons,
The total cross section for virtual photon-proton scattering, , where stands for transverse (longitudinal) photons, was extracted from the measurement of using the relation
| (8) |
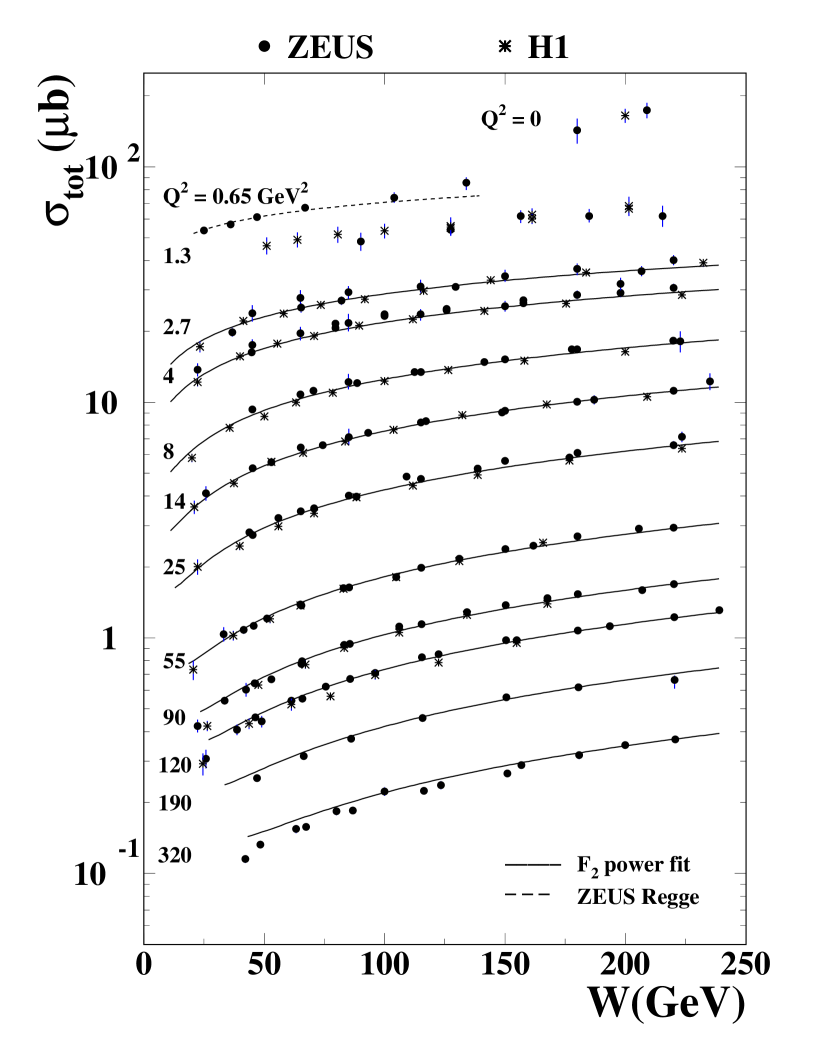
which is valid for [40]. The total cross section for virtual photons is shown in Fig. 11 as a function of for fixed between zero and 320 GeV2. The lines show the power fit presented above for the stucture function , see Eq. 7. The power , decribing the rise , is increasing with from at to at GeV2; the latter value of implies an almost linear rise with . Such a rise with has not been seen in hadron-hadron interactions. The NLO QCD fit presented above for gives also a good description of .
6 Diffraction
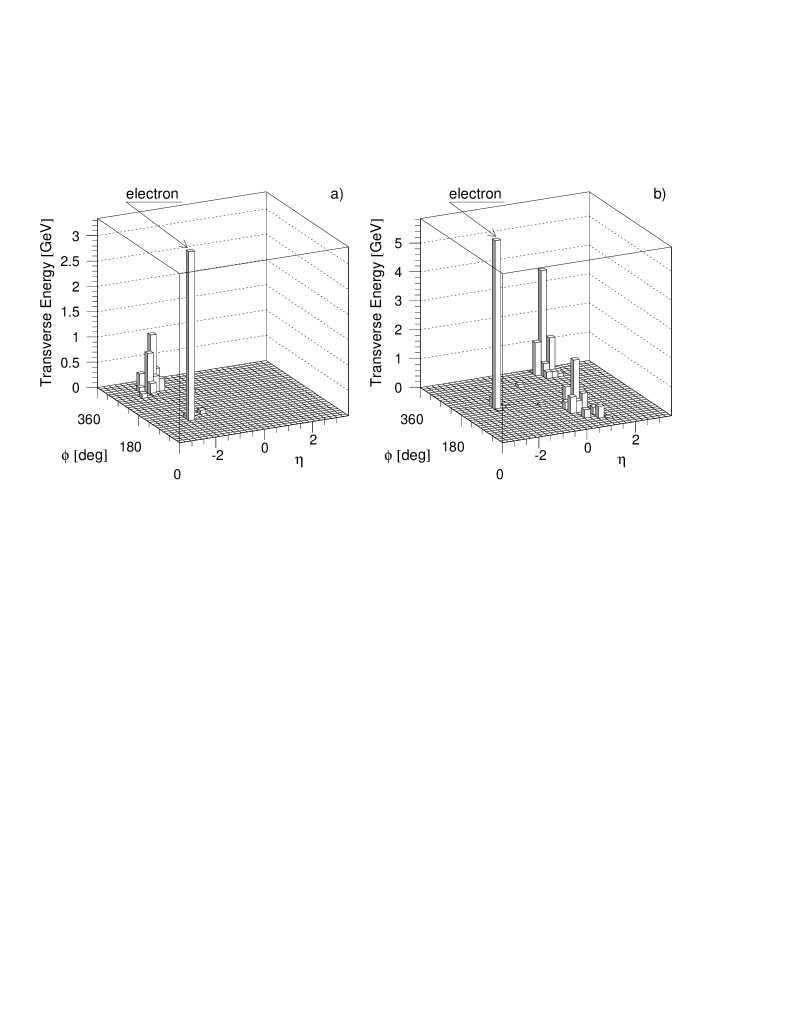
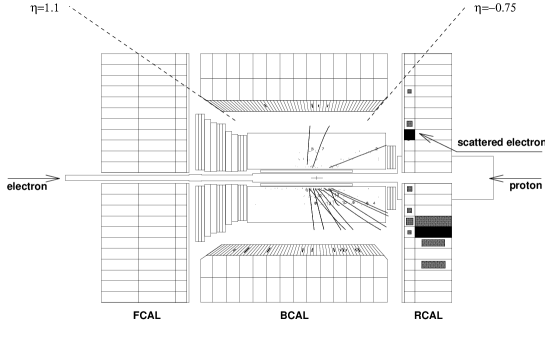
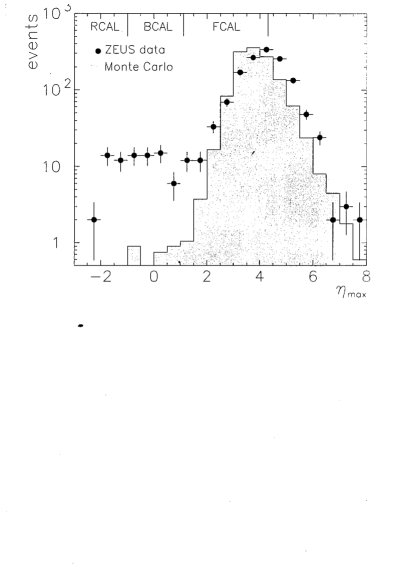
First evidence for a substantial contribution from diffraction in deep-inelastic scattering was reported by ZEUS [11], observing events in which no energy is deposited close to the direction of the proton beam, i.e. at large angle , see Fig. 12. Described in terms of pseudorapidity , where
| (9) |
nondiffractive events show uniform particle production in , see Fig. 13(a), while diffractive events exhibit a sizeable gap between the pseudorapidity of the smallest calorimeter angle (, ) and the pseudorapidity of the hadron(s) observed closest to the proton direction, see Fig. 13(b): in diffractive scattering particle emission is concentrated around the directions of the incoming photon and proton.
Figure 14 illustrates the different topologies of nondiffractive events (bottom) and diffractive events (top), as registered in the ZEUS detector.
Figure 15 shows the distribution of the maximum rapidity () observed in the calorimeter for events from deep-inelastic scattering with GeV2. There is a large excess of events at compared to the expectation from nondiffractive deep-inelastic scattering (shaded histogram).
Different methods have been employed by H1 and ZEUS for isolating diffractive contributions. In the case of vectormeson production, , resonance signals in the decay mass spectrum combined with the absence of other substantial activity in the detector have been used. The contribution from inclusive diffraction has been extracted using the presence of a large rapidity gap, the detection of the leading proton or the hadronic mass spectrum observed in the central detector ( method [41, 42]). Event samples selected on the basis of a large rapidity gap or a leading proton may include additional contributions from Reggeon exchange. Such contributions are exponentially suppressed when using the method.
7 Deeply virtual Compton scattering
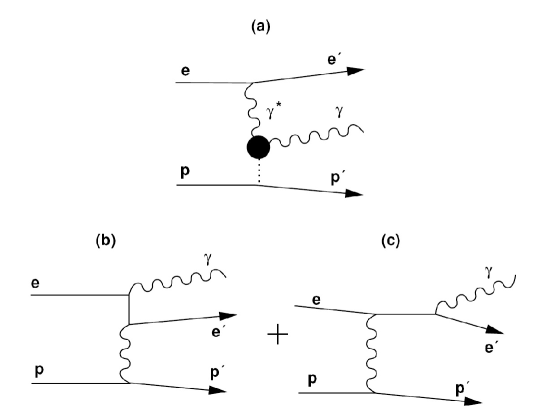
In deeply virtual Compton scattering, DVCS, the incoming electron emits a virtual photon with mass squared , which in turn scatters on the proton and is emitted as a real photon:
| (10) |
This process can be regarded as the (quasi) elastic scattering of a virtual photon off the proton, viz. . Figure 16 shows the diagram for DVCS together with the diagrams for the Bethe-Heitler contribution, which is purely electromagnetic and leads to the same final state.
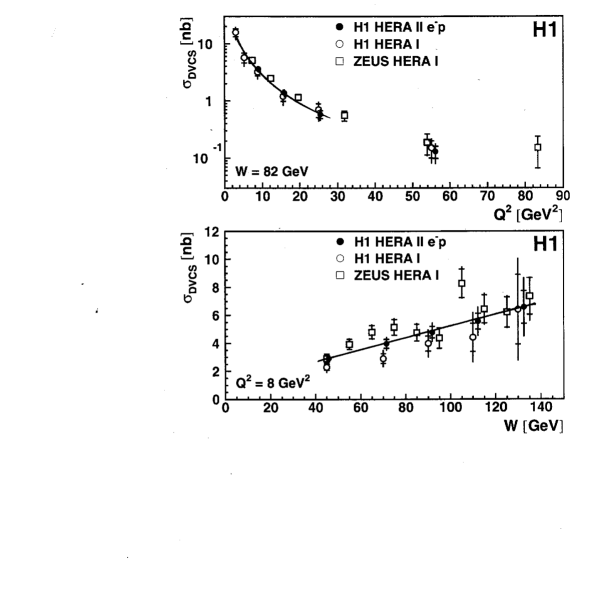
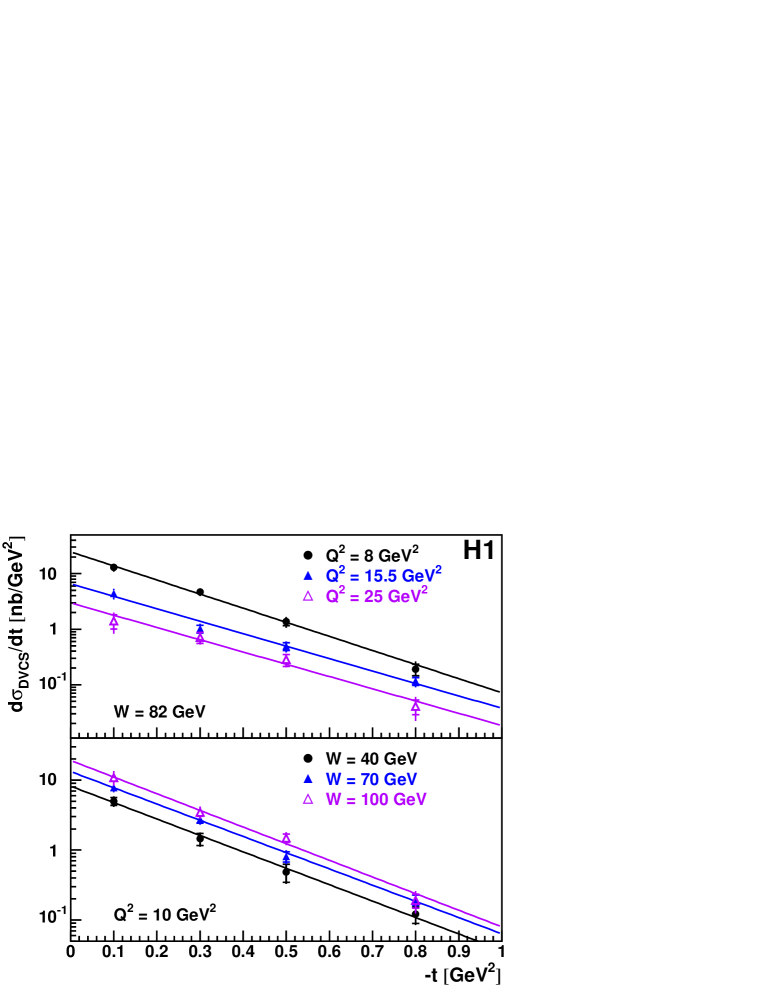
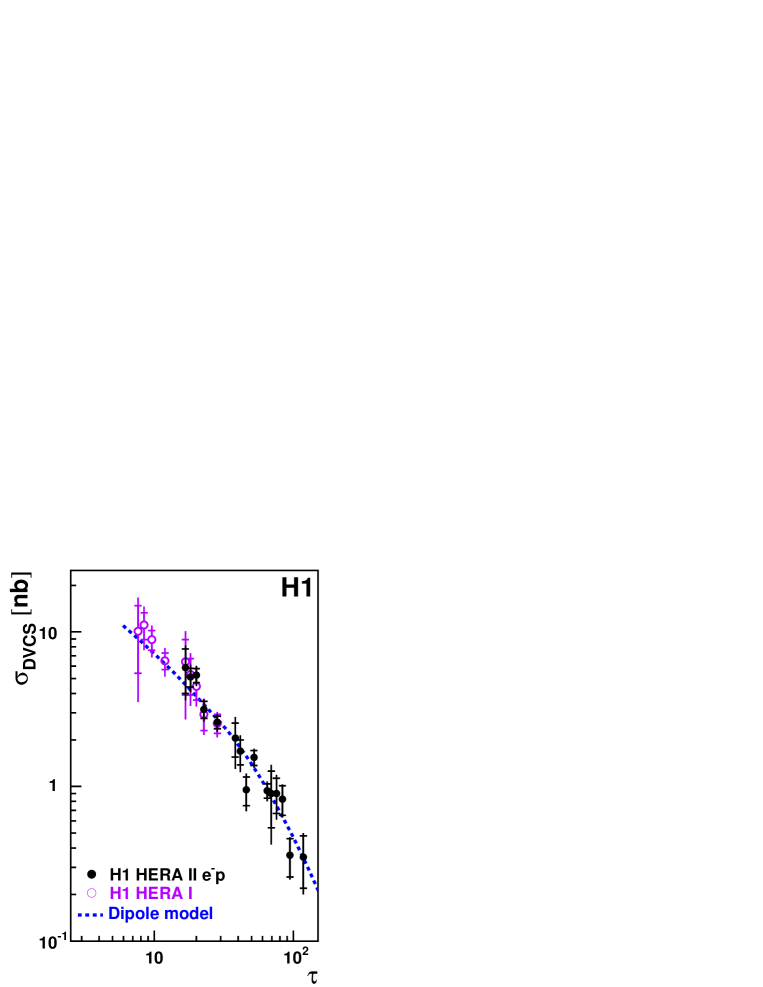
Measurements of DVCS at HERA were reported by H1 [43, 44] and ZEUS [45, 46]. The combined data presented in Fig. 17 show that for fixed GeV the DVCS cross section, , falls rapidly with increasing , while for fixed the cross section is rising proportional to . For fixed and , is falling exponentially with , the four-momentum transfer squared between incoming and outgoing proton: (see Fig. 18). A fit to the H1 data at average values of GeV2 and GeV, yielded GeV-2. The slope is shown below (Fig. 26) as a function of () (where for DVCS) together with the -values for the production of vectormesons with mass : within errors, the values from DVCS and from the production of vectormesons lie on a universal curve. The H1 data show that the DVCS cross section scales as a function of where with GeV, and , see Fig. 19.
The dependence of the DVCS cross section for fixed , as well as its dependence for fixed , have been compared with QCD calculations by [47] which assume that the virtual photon fluctuates into a system which in turn interacts with the target proton. The observed increase of the DVCS cross section with at fixed is due to the increase of the gluon content of the proton with decreasing Bjorken-x. The QCD calculations are based on twist-2 generalised parton distributions (GPDs) which have been extracted from experimental data. Comparison with the H1 and ZEUS data shows that leading order parton distributions (MRST2001 [48]) lead to a good description of the data, see Fig. 17: here the calculated DVCS cross section (curves) is compared with the HERA data for fixed GeV as a function of , and for fixed GeV2 as a function of .
8 Production of vectormesons by real and virtual photons
8.1 production
8.1.1
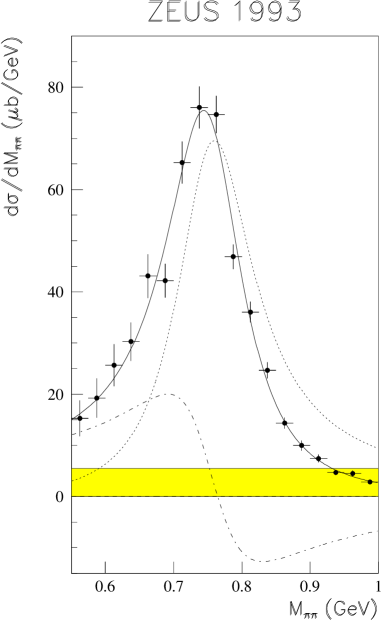
First results from HERA on production by real photons, , were presented in Refs. [32, 49]. The second analysis is based on 6000 events of the type at an average energy GeV, obtained with an integrated luminosity of pb-1. The final state electron and proton were not detected. Figure 20(top) shows the mass spectrum in terms of the differential cross section for events with four-momentum transfer squared between incoming photon an proton, GeV2. The mass spectrum is skewed compared to a Breit-Wigner distribution which can be understood in terms of the interference between the resonant production and a non-resonant () Drell-type background [50], as explained by Söding [51].
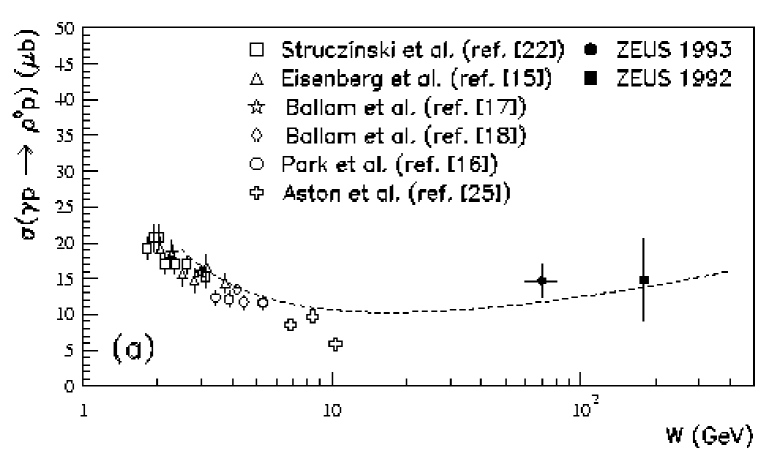
The dependence of the cross section is shown in Fig. 20(bottom) which includes measurements from fixed-target experiments [52, 53, 54, 55, 56, 57]. The ZEUS data indicate a substantial rise of for GeV. The differential cross section, - see Fig. 21 (top) - is proportional to with GeV-2 for GeV-2. In a measurement of production by ZEUS, where the four-momentum of the scattered proton was determined directly, within errors the same value was obtained, viz. GeV-2 [58]. A similar behaviour of was observed by H1 [59] where GeV-2 was obtained. The value of the slope is comparable to what is found for elastic scattering.
The decay angular distribution of the mesons has been used to determine the orientation of the spin [60, 61]. The exclusive electroproduction of mesons and their decay into is described by three angles: - the angle between the production plane and the electron scattering plane in the c.m. system, and - the polar and azimuthal angles of the w.r.t. the proton direction, all determined in the rest system. The decay angular distribution, , can be parametrised by the spin-density matrix elements, , with i,k = -1,0,1, and . The s-channel helicity decay angular distribution w.r.t. and can be written as follows:
| (11) | |||||
| (12) |
where the density matrix element represents the probability that the is produced longitudinally polarised.
The distributions of and for production by photons [49] are shown in Fig. 21. The dominant contribution is proportional to which shows that the mesons are mostly transversely polarised, as verified by the small value of . The distribution is constant, yielding a value of . The values of and are compatible with zero as expected for s-channel helicity conservation (SCHC): the in the final state has the same helicity as the photon in the initial state.
8.1.2
The first observation at HERA of production by photons, (see Fig. 22) leading to the final state [62], is shown in Fig. 23. The mass spectrum is completely dominated by the production of mesons. The cross section for shows a fast decrease with , viz. . For fixed GeV2, the cross section rises by about a factor of five from GeV to GeV.
The distribution of the polar angle for the decay is shown in Fig. 23c. The dominant -type distribution shows that the -mesons are mostly longitudinally aligned. Further results on from HERA were reported in Refs. [64, 65, 101].
A first precise measurement of the helicity amplitudes for at HERA was provided by H1 [66]. It showed that the helicity is conserved in the s-channel except for a small but nonzero helicity flip amplitude at the level of of the nonflip amplitudes. This is evidence for a (small) contribution of longitudinal mesons produced by transverse photons. The finding was corroborated by results from ZEUS [67]. For comparison, in a fixed target experiment at low GeV and low GeV2, the ratio of single flip to nonflip amplitudes had been found to be of order 15-20 [68].
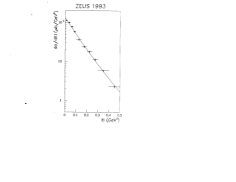
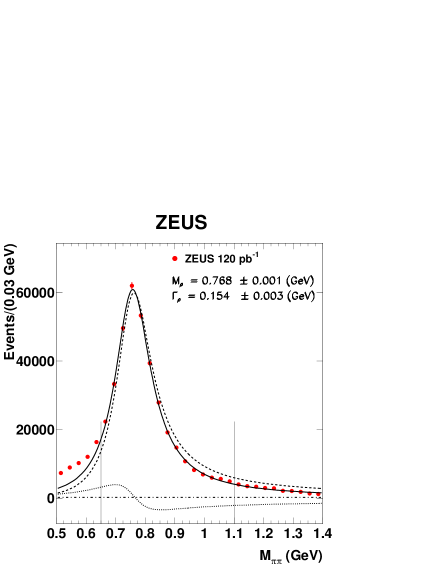
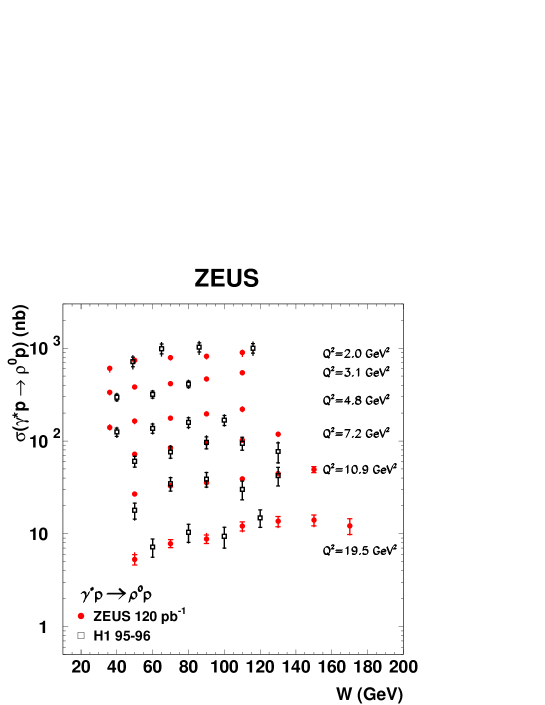
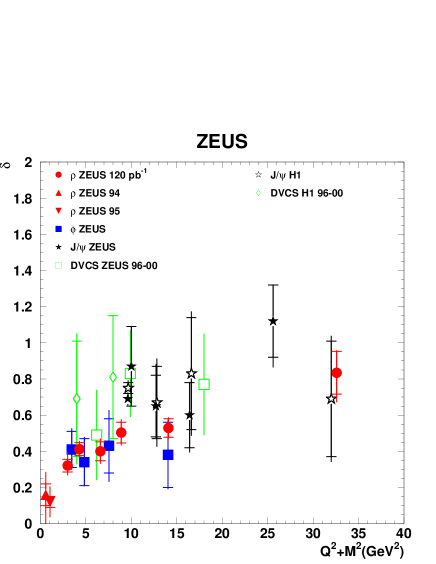
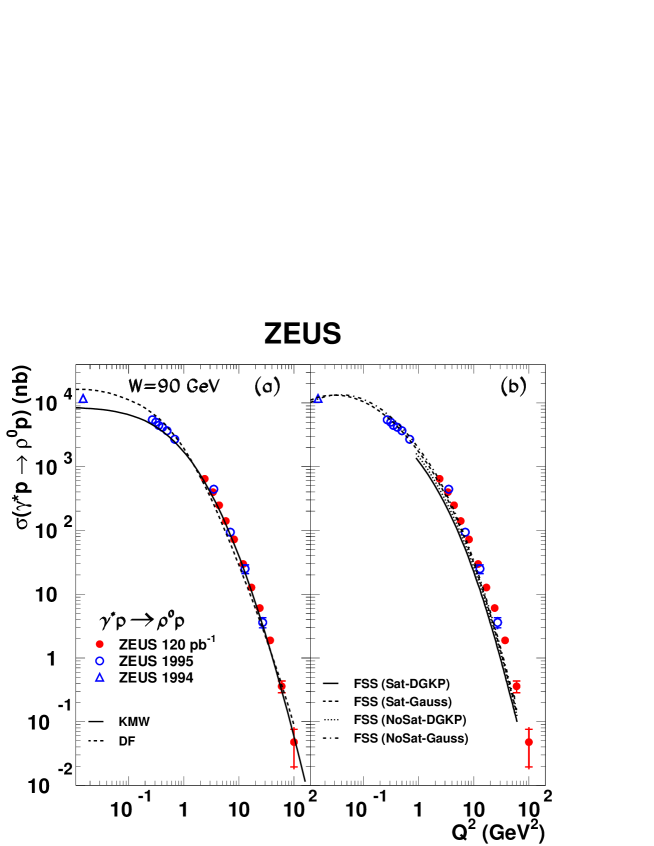
An extended study of was presented by ZEUS [69], based on an integrated luminosity of 120 pb-1. The mass distribution (Fig. 24) is dominated by production111The skewing of the mass distribution is explained by the Söding model, see above. The excess of events observed at masses below 0.65 GeV is due to background from , where the was not detected, and from , where the were misidentified as .. The cross section for , as measured by H1 and ZEUS, is presented in Fig. 25 as a function of for values between 2 and 19.5 GeV2. For fixed , is falling rapidly with . For fixed , the cross section rises with . A parametrisation of the form yielded the values shown in Fig. 26 as a function of : the power rises from around at to about at GeV2.
The dependence of is shown in detail [69] in Fig. 27 for GeV. There is an almost exponential decrease from nb at GeV2 to nb at GeV2. The measurements were compared with several models which are based on the dipole representation of the virtual photon: the photon fluctuates into a pair - the colour dipole - which in turn interacts with the gluon cloud of the proton to produce the , see e.g. [70]. For GeV2, the calculations of [71] (KMW) and [72] (DF) give a good description of the data while those of FSS [73] are somewhat low for above GeV2.
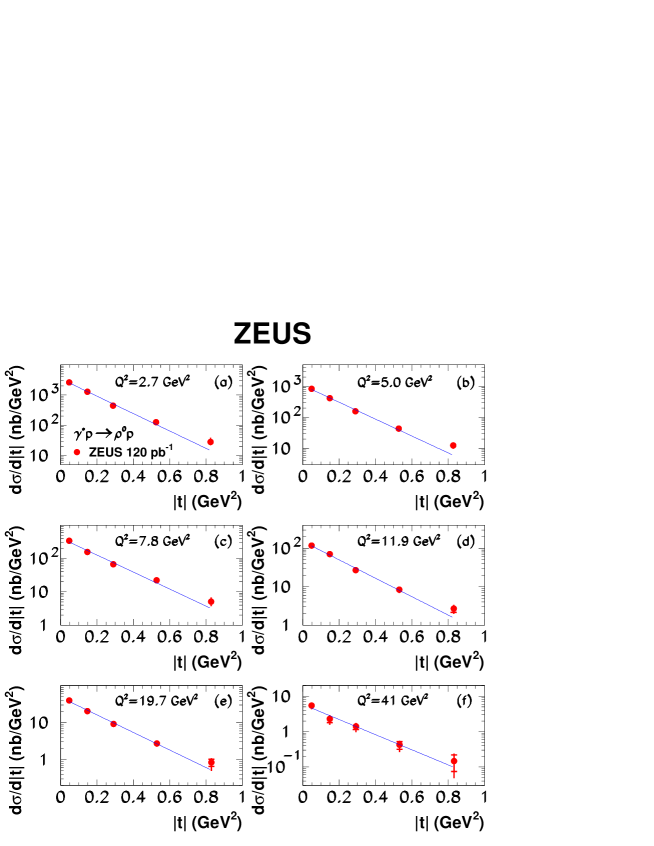
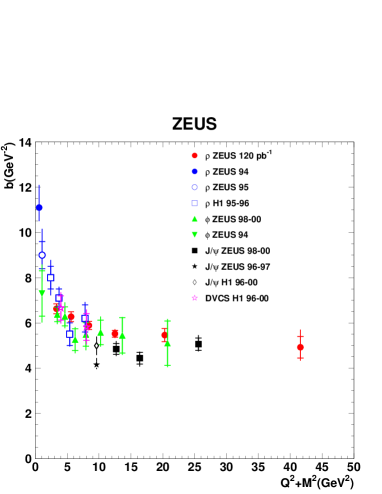
As a function of , the differential cross section at GeV is falling exponentially, [69], see Fig. 28. The dependence of on , where is the mass of the vectormeson, is shown in Fig. 29. For GeV2, is of the order of GeV-2, similar to what has been measured for elastic scattering at GeV, viz. GeV-2 [74]. At larger values of the slope decreases rapidly approaching a constant value of GeV-2 for GeV-2. In an optical model, is proportional to the sum of the radii squared of the virtual photon and the proton, . As increases, the transverse extension of the virtual photon expected to be proportional to , goes to zero, such that .
The dependence of at fixed values of was used to determine the parameters of the Pomeron trajectory, , with the following result [69]:
GeV2:
, GeV-2
GeV2:
, GeV-2
The data suggest a small increase of with increasing .
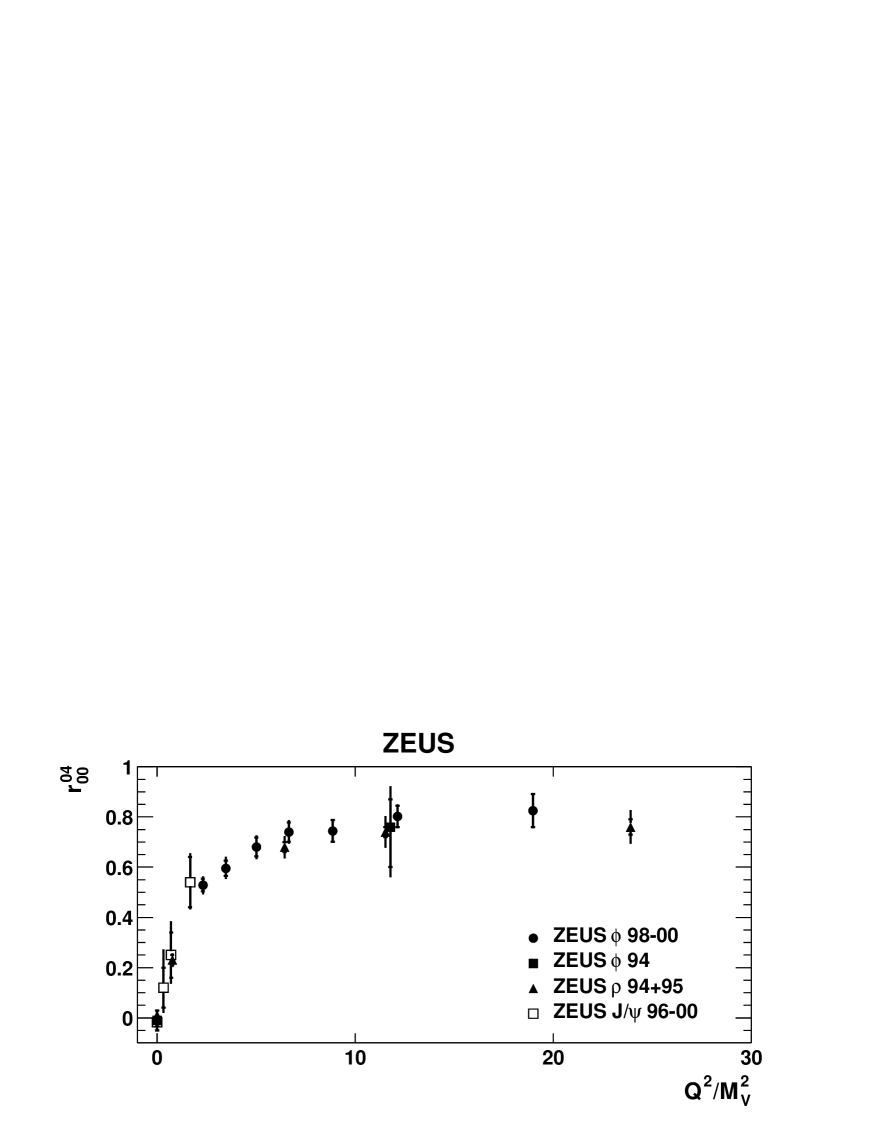
Figure 30 summarises the measurements of for , and production as a function of . The same behaviour is observed for all three vectormeson species: rises sharply from zero at to a value of for GeV2. This shows that at large the vectormesons are predominantly longitudinally polarised. Under the assumption of SCHC their production is dominated by longitudinal photons.
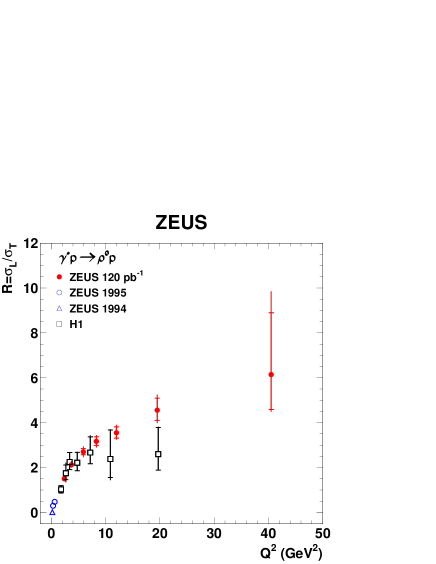
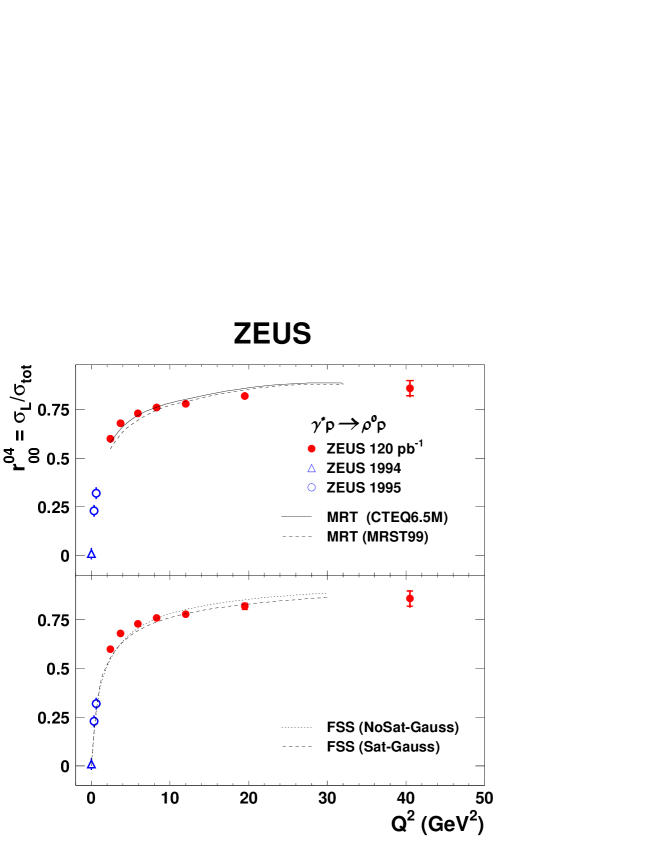
The ratio for is shown in Fig. 31: rises rapidly with , reaching unity at GeV2 and values around at = 20 GeV2: for GeV2 the dominant contribution to comes from longitudinal photons. The ratio of the contribution from longitudinal photons to the total cross section for production - as given by the density matrix element (see Fig. 32) - illustrates the preponderance of longitudinal photon contributions at large . The measurements are well described by the models of [73] and [75], which are based on two-gluon exchange.
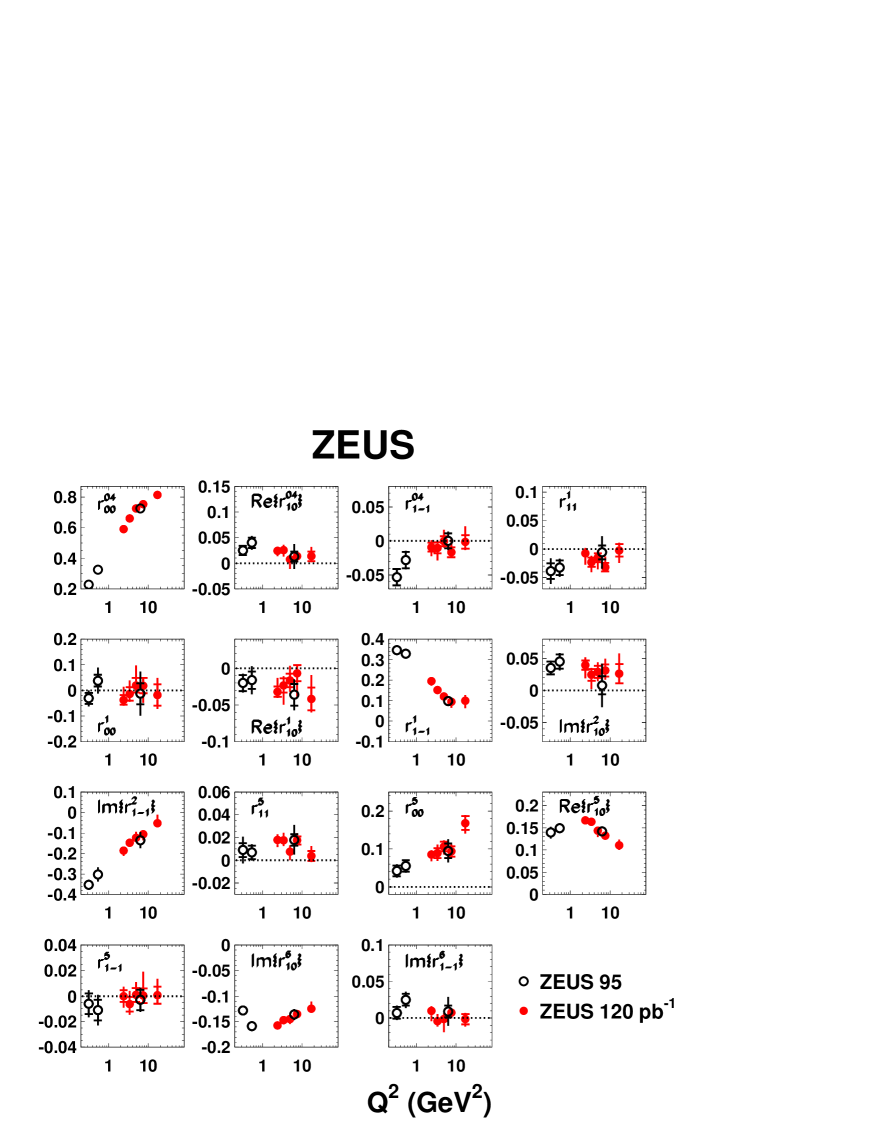
The complete set of densitiy matrix elements for is shown in Fig.33 as a function of . A strong dependence on is observed for , , and . Under the assumption of SCHC, the dependence on is driven by the dependence of on , i.e. by the rapid increase of the contribution from longitudinal relative to that from transverse photons.
8.2 production
The data on production at HERA are scanty, due mainly to the difficulty in reconstructing the of the final state . Two measurements have been published, one on production by real photons [76], based on an integrated luminosity of 0.89pb-1, and one on production by virtual photons [77] (integrated luminosity 37.7pb-1).
8.2.1
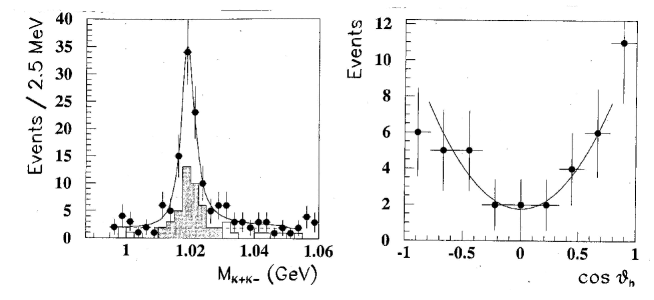
The and mass spectra, measured at GeV (Fig. 34), show clear signals for (Fig. 34a), and production (Fig. 34b) [76]. The cross section is presented in Fig. 35 as a function of together with measurements by fixed target experiments from [78, 79, 80, 53, 56, 52, 81, 82, 57, 83, 84, 85]. It is large at low c.m. energies, GeV, due to the contribution from one-pion exchange which decreases approximately proportional to . For GeV the cross section is approximately constant as a function of , as expected for diffractive production. The ZEUS measurement yielded at GeV.
8.2.2
The production of mesons by virtual photons was studied [77] for the kinematic region: GeV2, GeV and GeV2. Only events with GeV were kept. The results are presented in Fig. 37. The mass spectrum shows clear signals for the production of and mesons. The cross section for at GeV2 is a factor of about 10 smaller than for and shows, for fixed GeV, a rapid decrease with , similar to the -behaviour of .
8.3 production
First observations of production by real and virtual photons were reported by ZEUS [86, 87] for integrated luminosities of 0.9 and 2.6 pb-1, respectively.
8.3.1
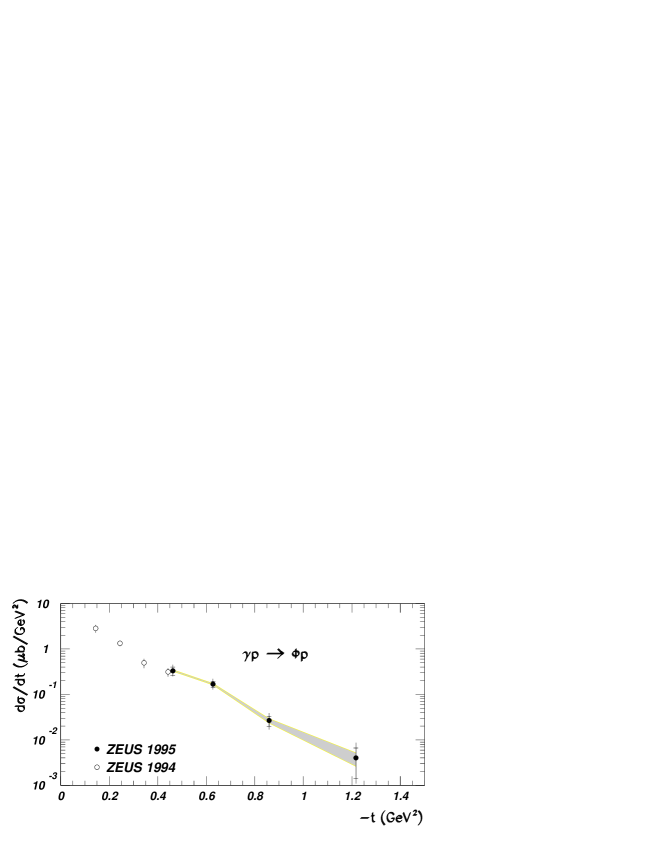
The reaction measured at a c.m. energy GeV [86] exhibits a clean signal in the mass spectrum (Fig. 38). The comparison with results at lower energy shows that the cross section is rising with . The differential cross section, , is falling exponentially with . The distributions of the meson decay angles and measured in the helicity system are shown in Fig. 38 (bottom). They yield and . These values are consistent with SCHC, and agree with those measured for and , see above.
8.4
First results from HERA on production by photons, , have been published by ZEUS [87], based on an integrated luminosity of 2.6 . The mass spectrum (Fig. 39) shows the -signal. The distribution of the decay angle is approximately proportional to - indicating predominant production of longitudinal ’s, in contrast to production by real photons, see Fig. 38.
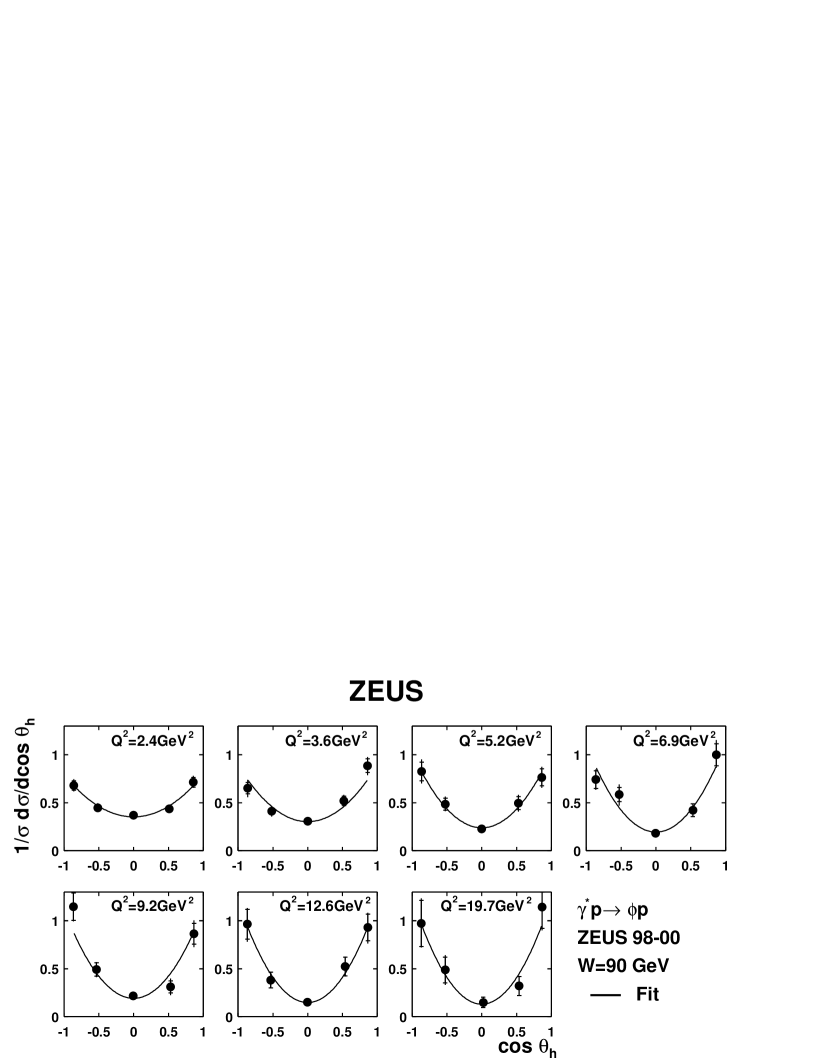
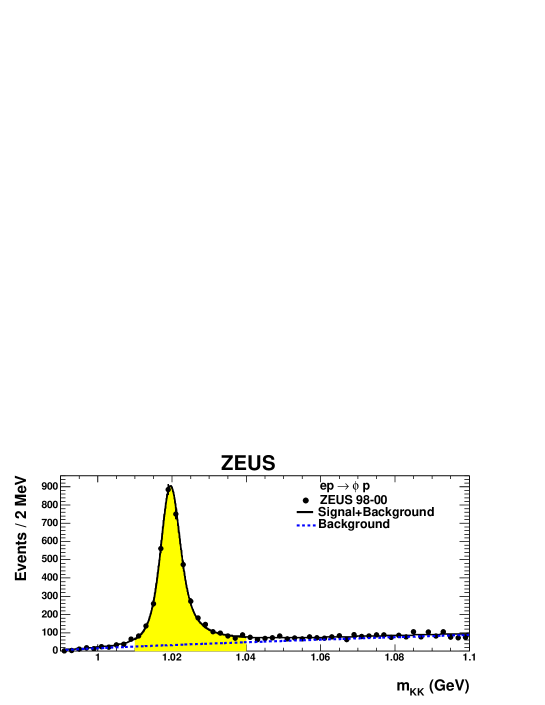
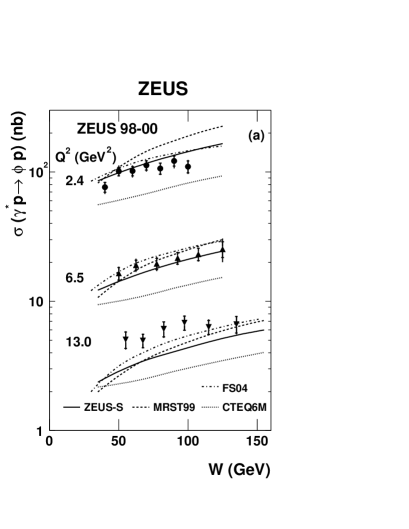
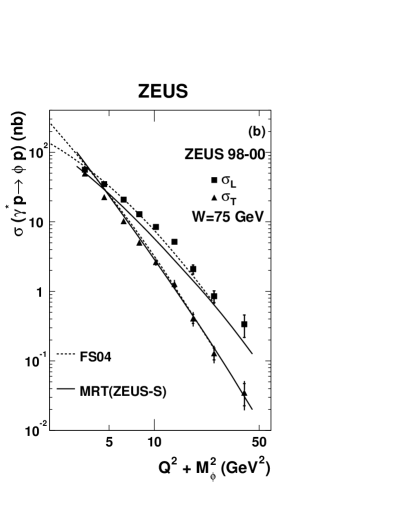
Further results on production were presented by H1 [88] (integrated luminosity L = 3.1 ) and ZEUS [89, 90] (L = 45 and 119 , respectively). Figure 40 shows the results from ZEUS: the mass spectrum is completely dominated by production. The cross section for at and GeV2 (Fig. 40a) shows a moderate rise with . The dependence on is shown in Fig. 40b for GeV, separately for the contributions from longitudinal (L) and transverse photons (T). At GeV2, and are approximately equal; for larger values of , falls off more rapidly than . At GeV2 is larger than by about a factor of 10.
The - dependence of production is displayed in Fig. 41(top) for different values of . The data yield , with GeV-2 for GeV2, see Fig. 29.
The distribution of the polar decay angle in the helicity system, , is displayed in Fig. 41 (bottom): it is of the form , where tends to zero as increases from 2.4 to 19.7 GeV2. This implies that at large , the mesons are predominantly longitudinally polarised - as has been observed for production (see above). Under the assumption of SCHC, production at GeV2 proceeds predominantly by longitudinal-photon proton scattering.
8.5 production
8.5.1
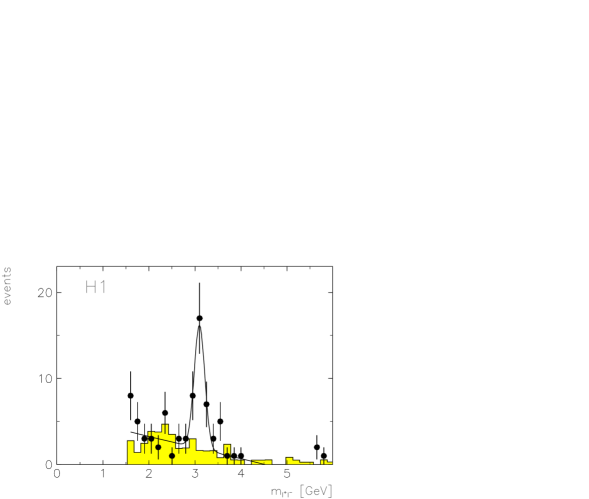
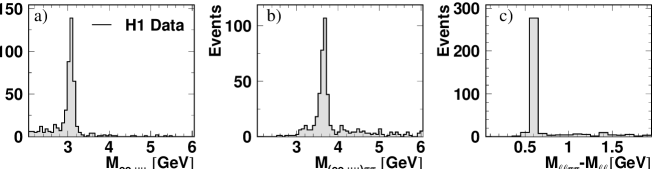
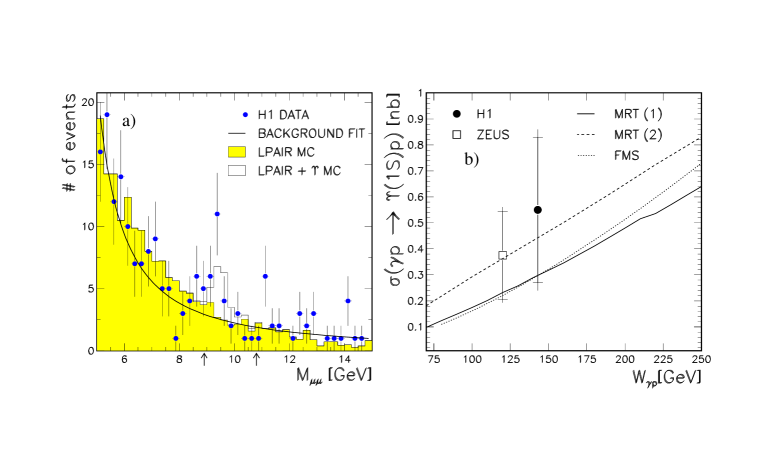
First evidence at HERA for production by scattering was obtained by H1 [91] from the analysis of events with two leptons in the final state (40 and 48 events, respectively). The mass spectrum (Fig. 42) shows a peak at the mass of the . The cross section for measured by H1 for GeV2, GeV, indicates a substantial rise with compared to the fixed target measurements at lower energies [92, 93, 94, 95, 96, 97, 98], and an exponential decrease with the transverse momentum squared , see Fig. 43.
The and mass distributions obtained in photoproduction by ZEUS [99] are shown in Figs. 44, 45; they are based on integrated luminosities of 55.2 pb-1 and 38.0 pb-1, providing about 11000 and 6500 events, respectively. For values between 35 and 260 GeV, production is observed with little background.
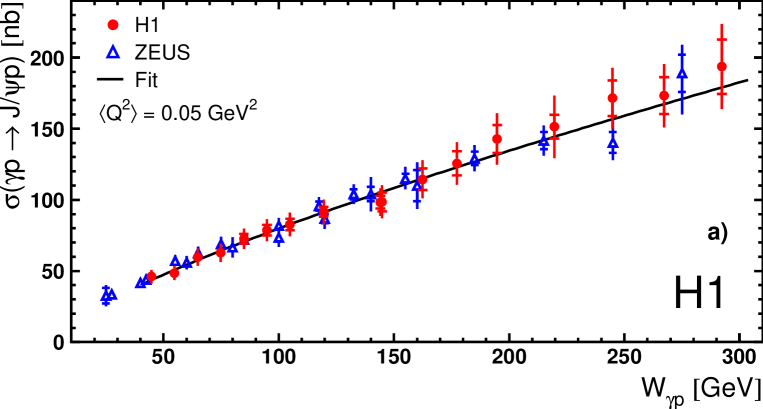
The dependence of the cross section as obtained by ZEUS [99] and H1 [100] is shown in Fig. 46. There is excellent agreement between the two measurements. The cross section is rising proportional to , where , as determined by H1.
The dependence of the cross section as measured by ZEUS [99] is shown in Fig. 47 for several bins in between 50 and 290 GeV: is of the form . The slope is rising with , as shown by Fig. 47. A fit of the data [99] to the form
| (13) |
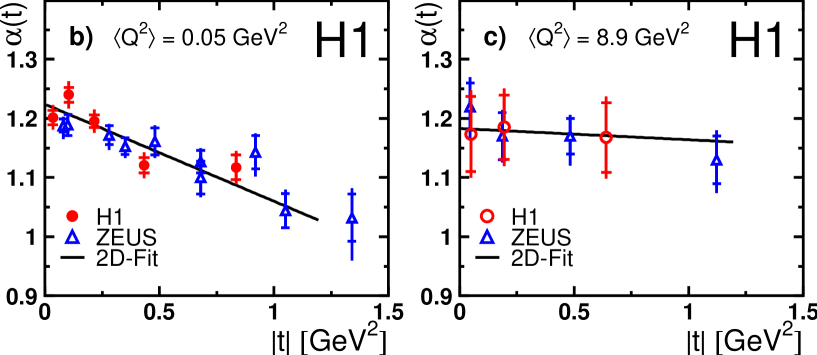
where is the slope of the Regge trajectory of the Pomeron, yielded and , see the straight line. The effective Pomeron trajectory deduced by H1 [100] from the H1 and ZEUS data is shown in Fig. 48 as a function of .
For GeV2:
and for GeV2:
.
8.5.2
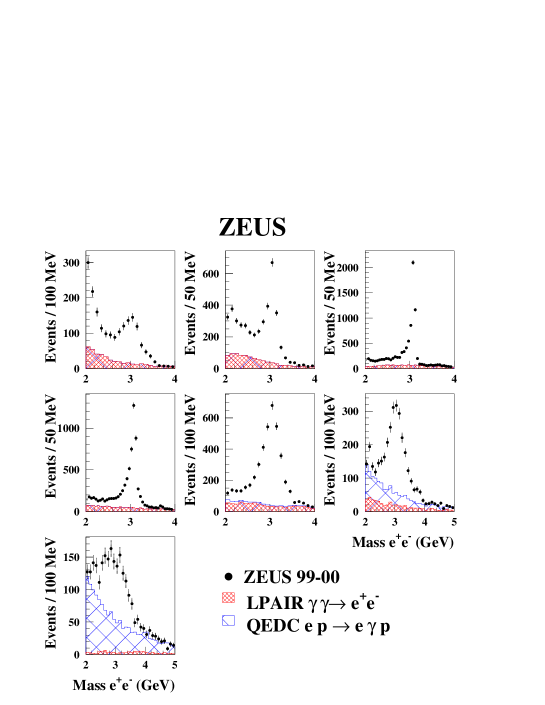
The first signal for production in deep-inelastic scattering was reported by H1 [64]: Fig. 50 shows the lepton-lepton mass distribution, the differential cross section and the cross section as a function of . The cross sections at GeV2 are a factor of about below the measurements at .
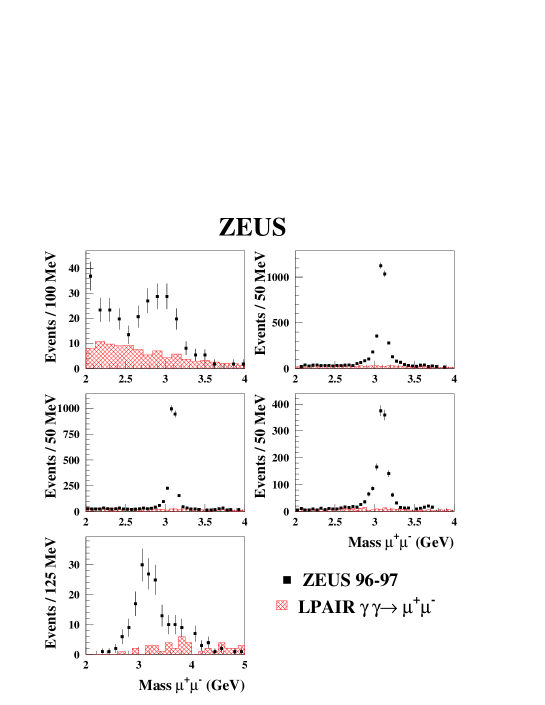
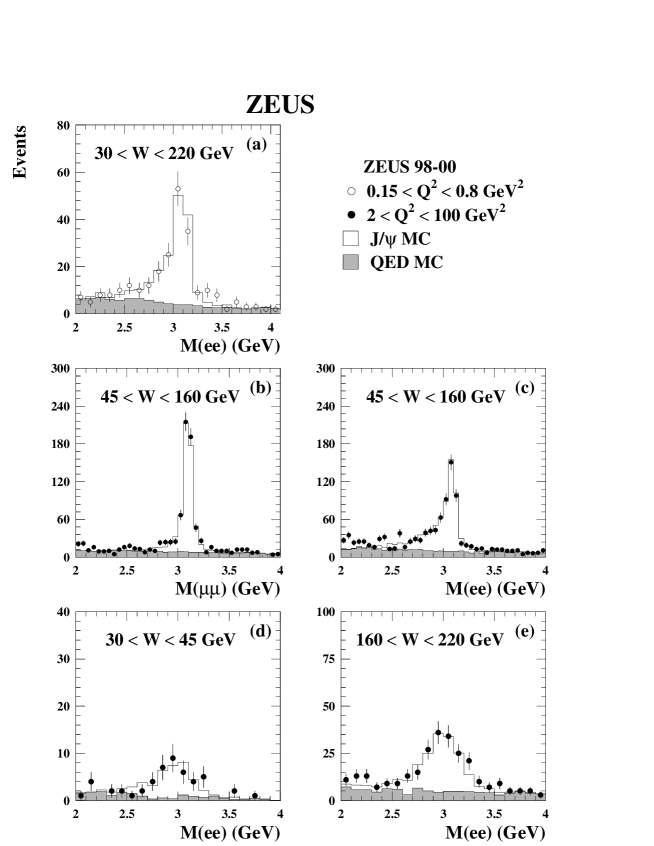
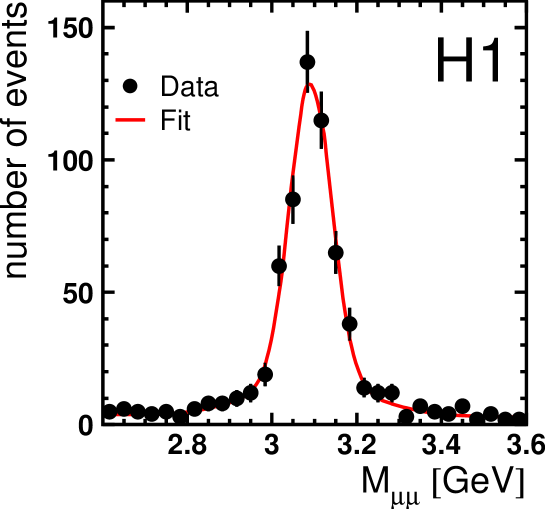
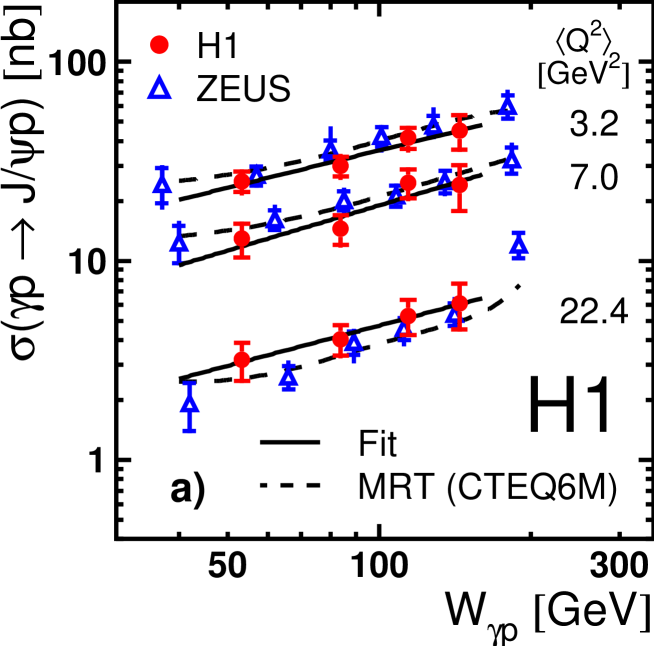
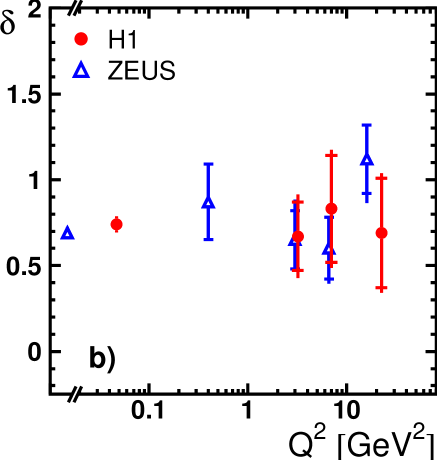
Further results were reported by ZEUS [101, 102] and H1 [103, 100]. The final results stem from about 1200 (ZEUS) and 600 (H1) events with GeV2, see Figs. 51, 52. The dependence of the cross section is shown in Fig. 53 for values between 3.2 and 22.4 GeV2. The parametrisation yields the values shown as a function of in Fig. 53(bottom); within errors, .
The differential cross section (Fig. 54a-d) is proportional to , where GeV-2 (Fig. 54a) independent of , as shown by Fig. 54(e). The measured -value of 4.7 GeV-2 corresponds to the size of the radius of the proton alone. Hence, the radius of the virtual photon must be small.
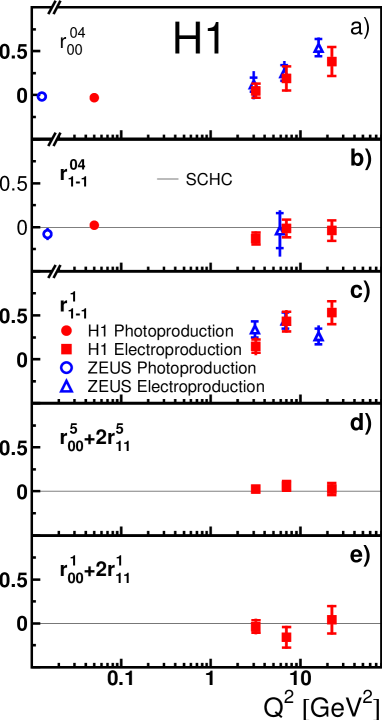
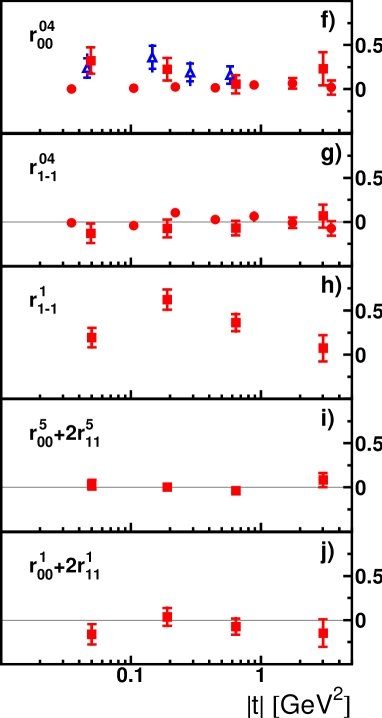
The decay was studied in terms of the decay angles and , where and are the polar and azimuthal angles of the positively charged decay lepton, and is the angle between the production plane and the lepton scattering plane. The distributions of and of are shown in Figs. 55a-f for between 2 and 100 GeV2. The full set of is shown in Fig. 56 as a function of (left) and (right). The element and the combinations and are zero, within errors, in agreement with SCHC. Assuming SCHC, the ratio of the longitudinal to transverse cross sections, , was determined from : , where is the polarisation parameter. The ratio is shown in Fig 55(g): it is rising proportional to : with . For GeV2, and are approximately equal.
8.5.3
The production of in collisions was reported by H1 [104, 105]. In the first analysis, based on an integrated luminosity of 6.3 pb-1, the was identified by the decays , , and , , see Fig. 57. A total of 60 events were observed. In the second analysis, performed with 77 pb-1, about 300 could be isolated (Fig. 58). Figure 59 shows the cross section ratio . When is assumed to be independent of , the data yield
,
where the last error accounts for the uncertainty of the branching ratio. The dashed and dashed-dotted lines show the predictions of [106], [107]: in these models the photon fluctuates into a colour dipole which interacts with the proton via the exchange of two gluons. The different wave functions of and are taken into account. The model of Nemchik et al. [106] reproduces the data somewhat better.
8.5.4
The first observation of the reaction was reported by ZEUS [108], see Fig. 60. Based on an integrated luminosity of 43.2 pb-1, a total of 57 events were observed in the mass range 8.9 - 10.9 GeV of which 17 events were estimated to come from production(assuming that the relative production cross sections for the states are the same as those measured in collisions by CDF [109]). The cross section derived for a mean GeV is
| (14) |
and the ratio
| (15) |
8.6 The dependence of the photoproduction of vectormesons
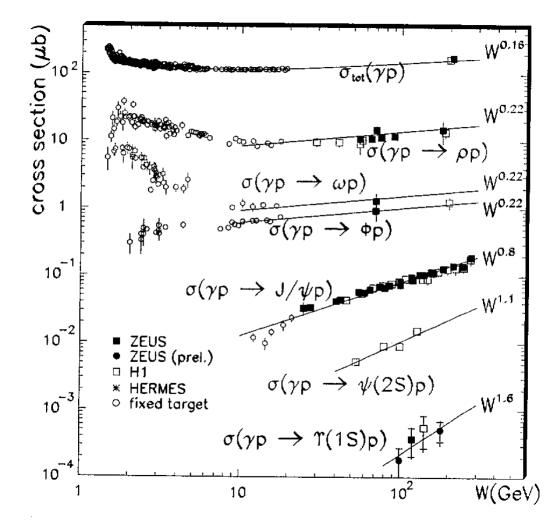
The cross sections for photoproduction of vectormesons, , are shown in Fig. 62 as a function of together with the total cross section [111]. The parametrisation of the cross sections by the form gives the -values indicated: for the total cross section ; for vectormeson production increases with the mass of the vectormeson from () to () and ().
8.6.1 Estimate of cross sections for elastic vectormeson proton scattering
Assuming Vector Meson Dominance (VDM), the cross sections measured for photoproduction of vectormesons, , can be used to estimate the cross sections for elastic scattering of transverse vectormesons on protons, :
| (16) |
where for , respectively [118]. The resulting cross sections for GeV are
| (17) | |||||
| (18) | |||||
| (19) | |||||
| (20) |
The elastic and cross sections are of the same magnitude as the cross sections measured for elastic and scattering - albeit at a somewhat lower energy of GeV: mb and mb [119].
8.7 The and -dependences of vectormeson production
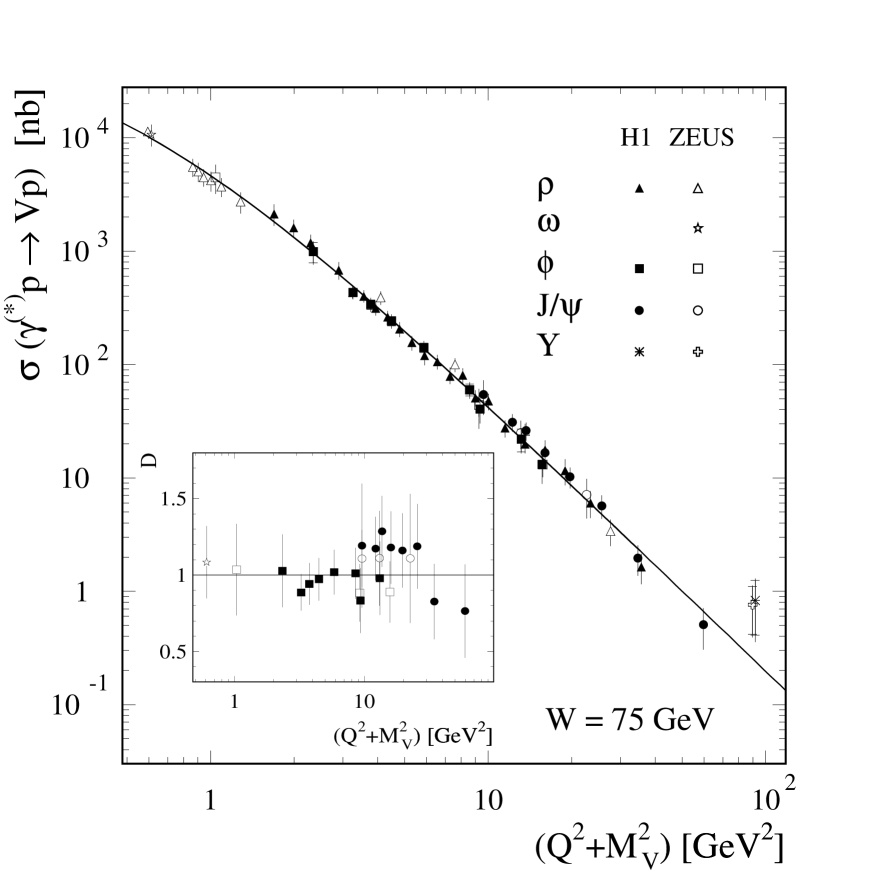
Figure 63 shows the cross sections for at GeV, as a function of , where [88]. The cross sections lie on a universal curve and are falling by four orders of magnitude from to GeV2. The curve shown has the form , with , GeV2 and [88].
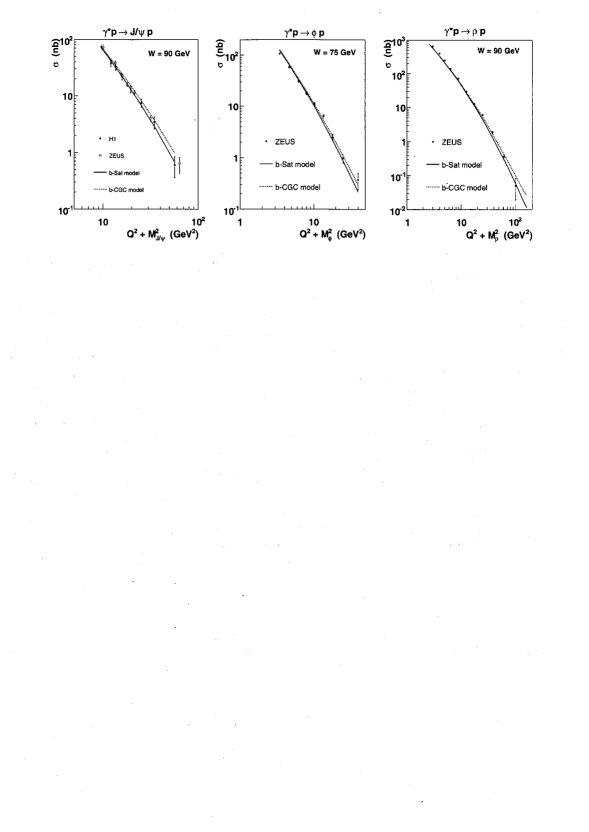
The cross sections for are compared in Fig. 64 with the predictions of the bSat and gGGC models [112] 222These models are based on the socalled color glass concept [113]: the hadrons participating in the scattering process behave as a new form of matter (color glass condensate) which is made of small-x gluons. These gluons carry small fractions of the total momentum and are created by slowly moving color sources - i.e. partons at large - like for a glass where, on short time scales, the constituents appear to be frozen., as provided by [114]. A good description of the data is obtained.
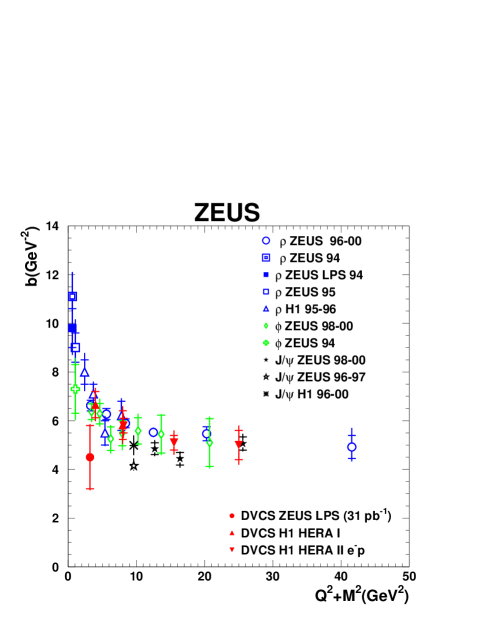
The slope characterising the dependence of photon and vectormeson production, , is shown in Fig. 65 as a function of , where for DVCS, and equal to the mass of the vectormeson produced, otherwise [46]. Within errors, all slope values lie on a universal curve. For GeV2, reaches a constant value of about GeV-2. As remarked before, this value of corresponds to an interaction radius of cm, consistent with the radius of the proton: in reactions of the type , the transverse extension of the virtual photon becomes negligible when GeV2.
The differential cross sections for are shown in Fig. 66 as a function of , where ( GeV) and ( GeV); is fixed with values between 2.4 and 19.7 GeV2. The -dependences of the three reactions are consistent with an exponential fall-off, .
The relative size of these cross sections at large can be understood by assuming that the virtual - predominantly longitudinal - photon couples to a vectormeson , which scatters elastically on the proton, see Fig 67. The cross section for is given by:
| (21) |
From Fig. 66 one finds for = 0.5 GeV2:
| (22) | |||
| (23) |
Both ratios are about a factor of two larger than those obtained with transverse photons at , see above.
8.8 and
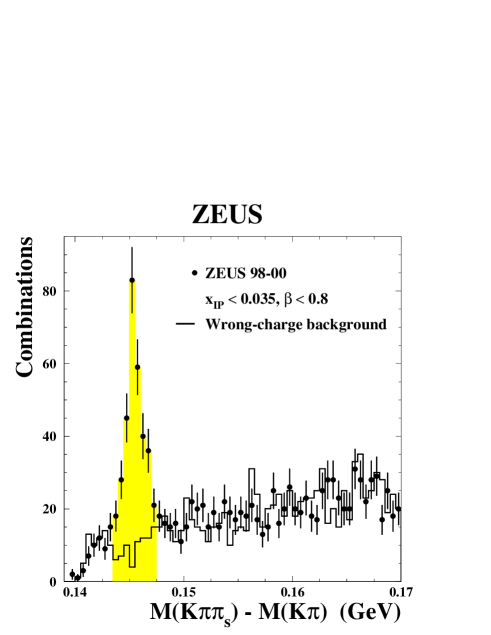
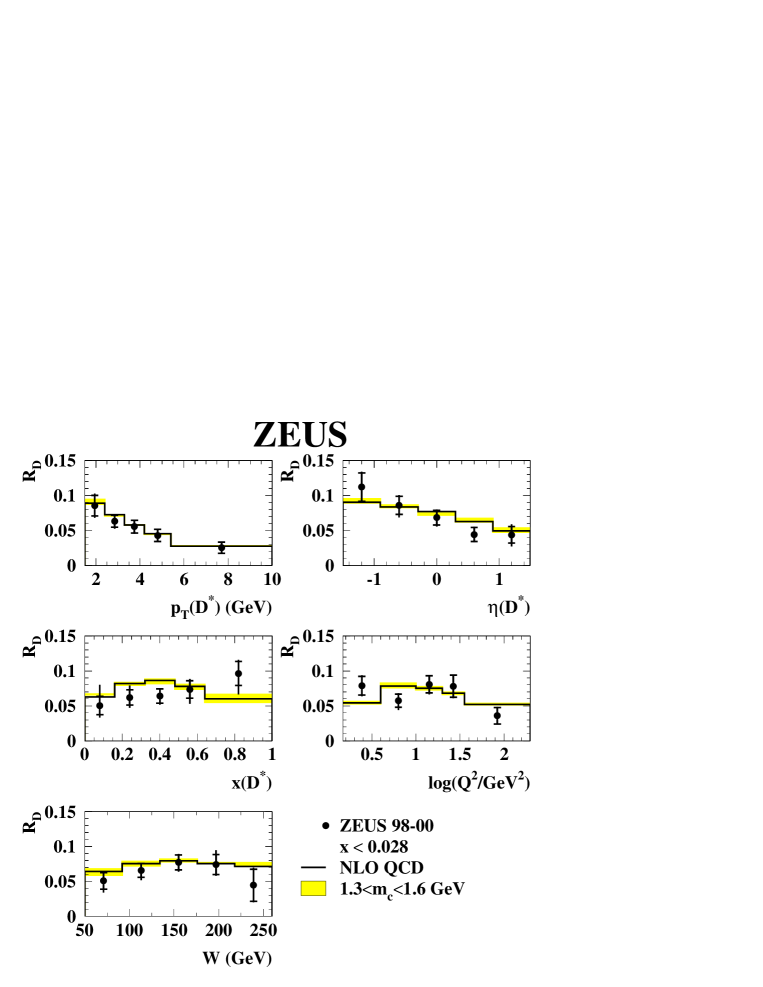
The contribution from diffractive production of pairs (see diagrams in Fig. 68) was determined by ZEUS [120], studying the reaction with an integrated luminosity of 81.8 pb-1. Events with a decay were isolated by making use of the small mass difference between and , see Fig. 69. For GeV2, in total events with an identified meson were obtained.
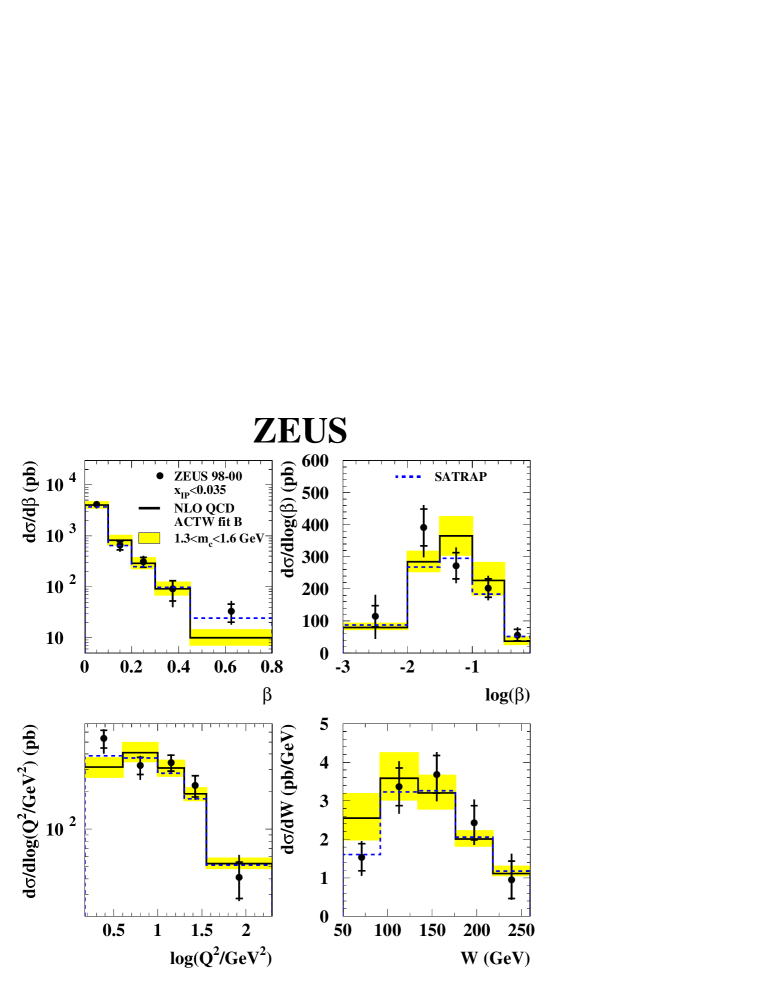
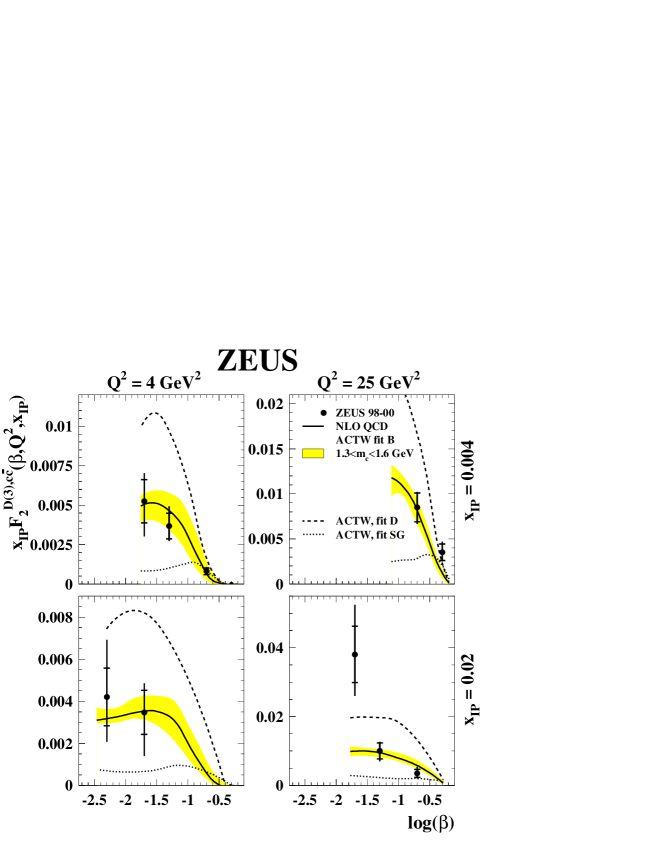
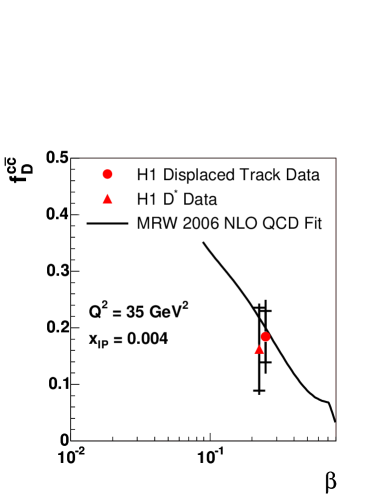
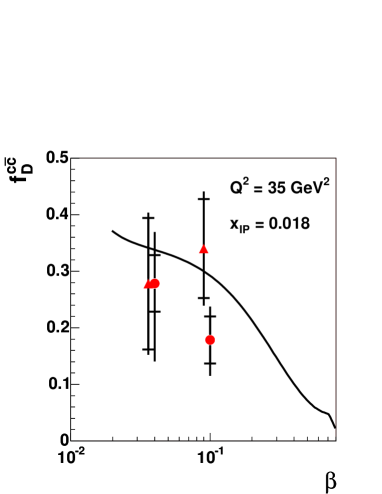
The differential cross sections for as function of , and , are shown in Fig. 70. The ratio of diffractively produced mesons to inclusive production is of the order of 0.05 to 0.1, see Fig. 71. The charm contribution to the diffractive structure function of the proton, , is presented in Figs. 72, 73 as a function of for and GeV2 and : the structure function rises rapidly as decreases. The ACTW calculation [121] with the gluon-dominated fit B reproduces the data.
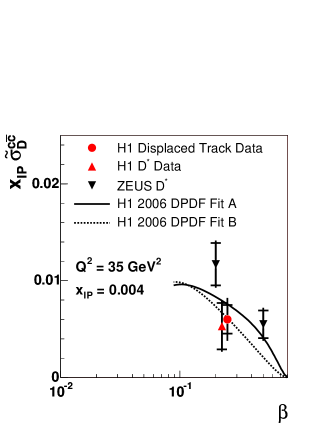
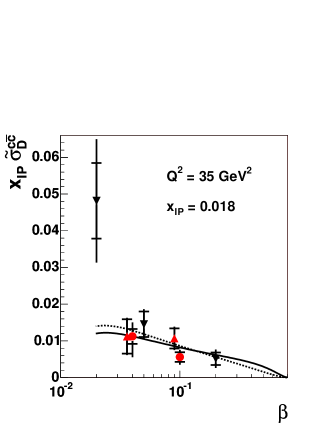
A similar measurement was performed by H1 [122]. Based on an integrated luminosity of 47 pb-1, () events with production were detected at GeV2 ( GeV2). Figure 73 shows for GeV2 the combined results from H1 and ZEUS for : within the limited statistics there is agreement between the two data sets. The fraction of the total diffractive cross section contributed by the production of charm quarks is shown in Fig. 74 as a function of for GeV2, and . For around 0.03 - 0.1, is of the order of 20-30%.
9 Jet production by and diffractive scattering
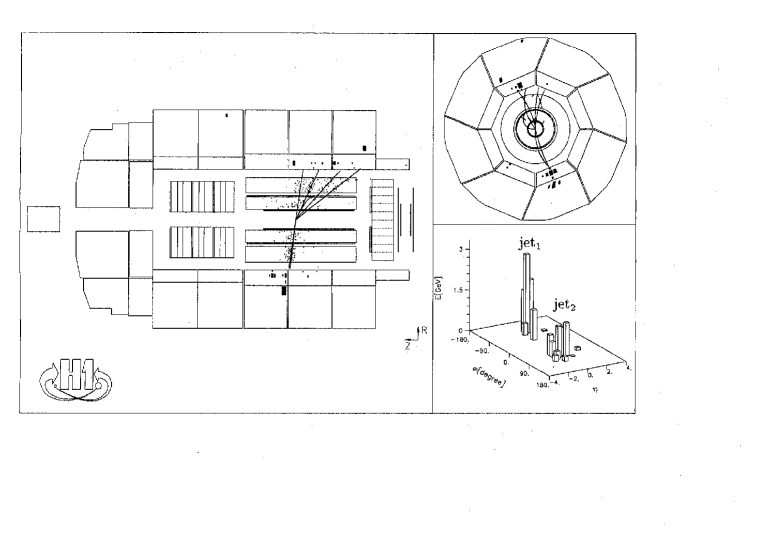
The study of jet production by virtual-photon proton scattering led ZEUS to the observation of events with a large rapidity gap between the jet - or system of jets - and the direction of the outgoing proton [123]. With an integrated luminosity of 0.55 pb-1 a total of events were collected for GeV2. A fraction of these events showed a large gap between the direction of the outgoing proton and the direction of particle(s) emitted closest to the outgoing proton. The size of the gap was quantified by the variable , where is the polar angle of the most forward going particle measured w.r.t the proton beam direction. Figure 75 shows two events with a large rapidity gap in space ( = azimuthal angle), (a) with one jet and (b) with two jets (b). In both events there is a large space in (a) or (b) without energy deposition. The distribution of the total hadronic transverse energy, , as determined in the c.m. system, is shown in Fig. 76 for events with 0,1,2 or 3 jets and a large rapidity gap. A fraction of these events have one () or two jets (). For GeV, the dominant production mechanism is jet production. In the case of two-jet production the two jets are back-to-back in the system (not shown).
9.1
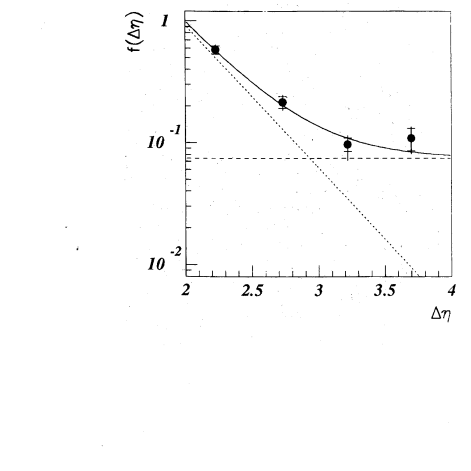
An early observation of photo-produced events with a large rapidity gap and two back-to-back jets was reported by H1 [124], see Fig. 77. An analysis by ZEUS [125] indicated that between 30% and 80% of the Pomeron momentum carried by partons is due to hard gluons. Photoproduction of two or more jets with jet-transverse energies above 6 GeV was studied by ZEUS [126]. For a fraction of events with two jets, the jets are separated by a large rapidity gap of up to four units, with little hadronic energy in between the jets. The fraction of such events decreases exponentially with up to where it reaches a constant value of about 0.08, see Fig. 78. The excess of events above the exponential fall-off gave evidence for hard diffractive scattering in photoproduction.
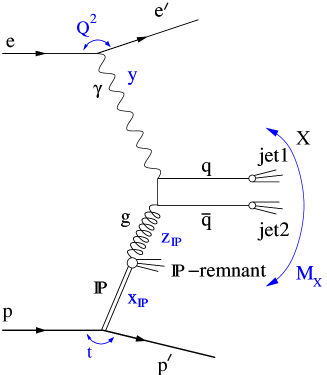
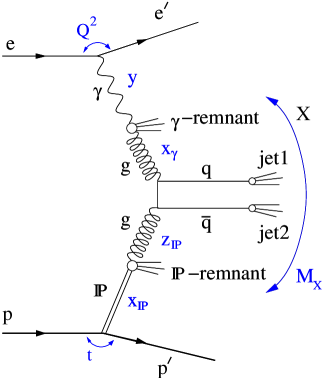
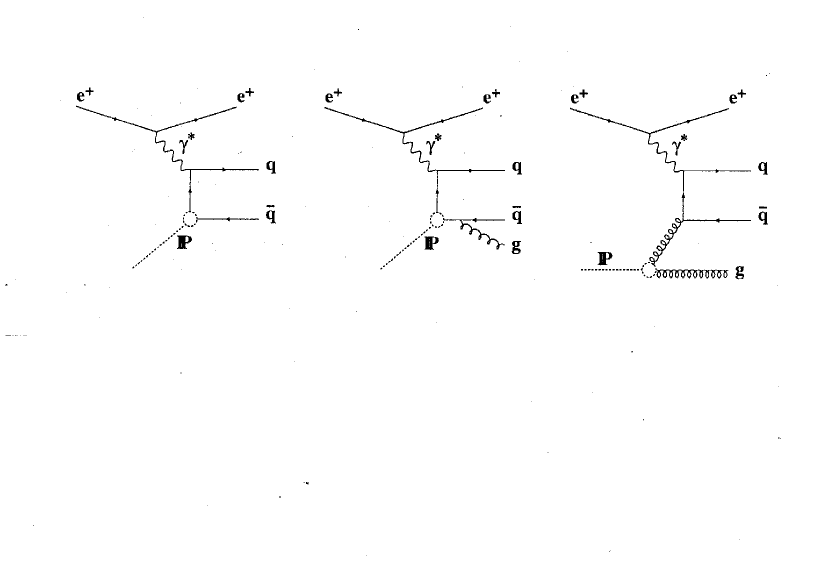
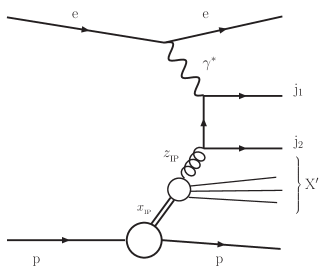
Further measurements on diffractive photoproduction of two jets have been reported by ZEUS [127, 128] and H1 [129, 130, 131]. Figure 79 shows leading-order digrams for direct and resolved diffractive photoproduction,
| (24) |
The process is described in terms of the four-momenta of the incoming and scattered electron, the incoming and scattered proton , and the outgoing system . Defining the four-momentum of the virtual photon, , and the square of the photon-proton c.m. energy, , the fraction of the energy of the incoming electron transferred to the proton is given by . Under the assumption that the virtual photon interacts with the Pomeron () and produces a hadronic system of mass , the fraction of the proton momentum carried by the Pomeron is . The partons from the resolved photon and the diffractive exchange have fractional momenta (where is the four-momentum of the parton in the resolved photon) and (where is the four-momentum of the parton in the diffractive exchange). The variables and are approximately given by the energies and pseudorapidities of the two jets with the highest transverse energies in the laboratory system:
| (25) |
9.2
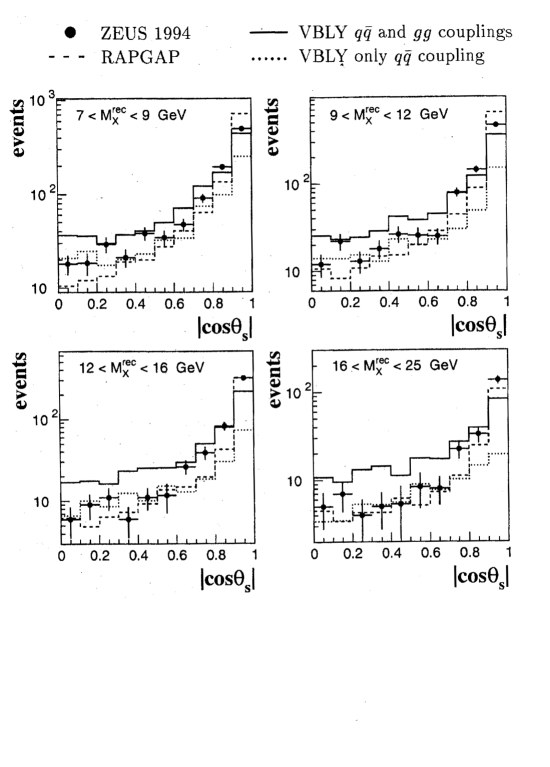
A first in-depth analysis of deep-inelastic scattering leading to the production of two jets combined with a large rapidity gap has been presented by ZEUS [133] for GeV, GeV2 and . For this event sample the value of is below 0.01; thus, dominance by Pomeron exchange can be expected. The observed multihadron final state of mass is studied in its rest system which is interpreted as the -Pomeron rest system. As shown by Fig. 82, the system is collimated around the direction of the virtual photon. The observed features are close to those observed in annihilation at a total c.m. energy [134, 135]. The solid and dotted histograms show the comparison with the VBLY model [136] which is based on QCD. In this model, the Pomeron is assumed to have a pointlike coupling to , and an additional gluon may be radiated. The prediction for alone agrees with the data for , but is too low for , while the prediction for plus agrees with the data at and overshoots the data when . RAPGAP [137], which also considers the sum of the contributions from plus , gives a fair representation of the data for the full range.
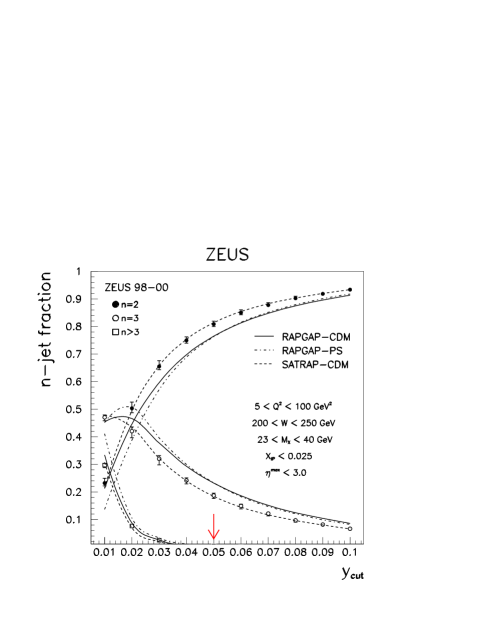
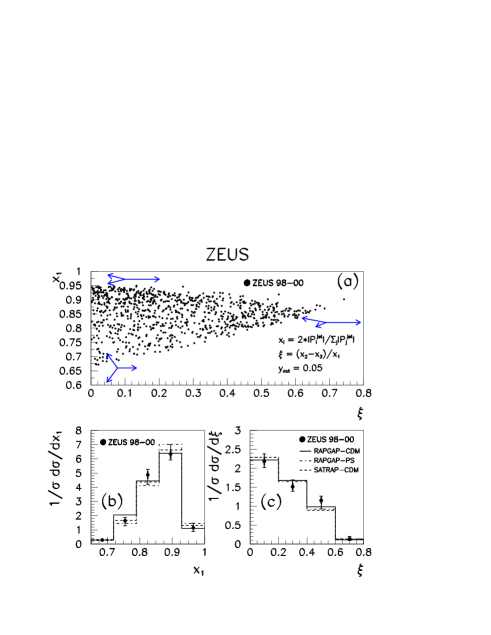
The importance of multi-jet production by diffraction is also illustrated by Fig. 83 [138] which shows the fraction of events with and two or more jets, as a function of the jet resolution parameter . For , the dominant contributions are of the two- and three-jet type. QCD diagrams leading to two- and three-jet configurations by diffractive processes are shown in Fig. 84. The curves in Fig. 83 show predictions of several models: the Monte Carlo generator SATRAP [139] combined with higher order QCD contributions [140, 141] describes the data best.
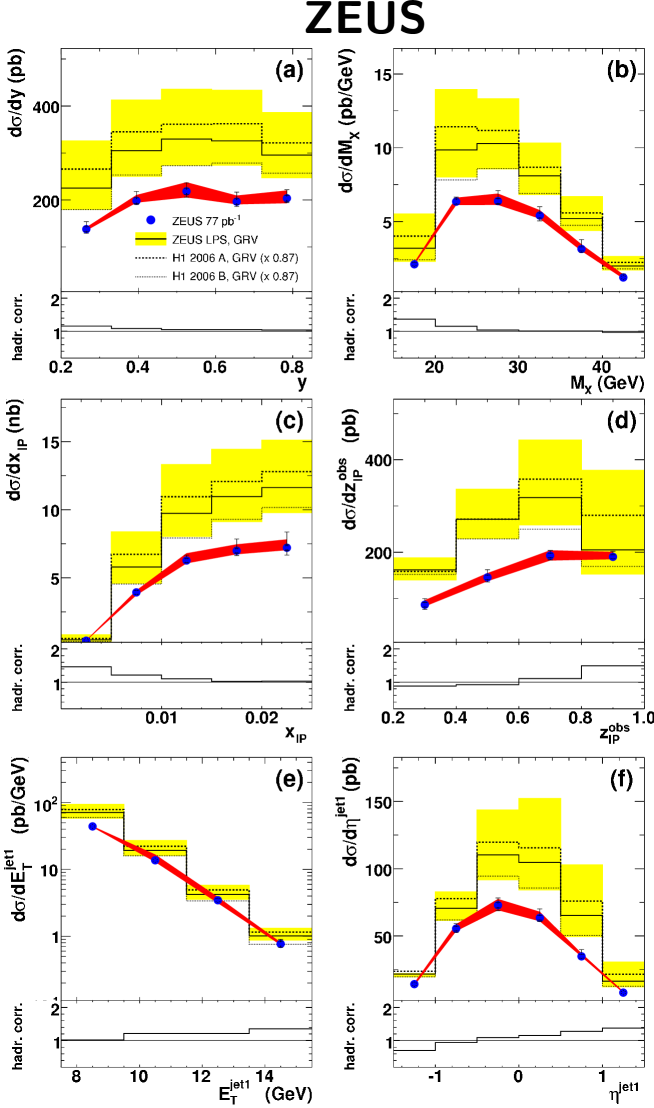
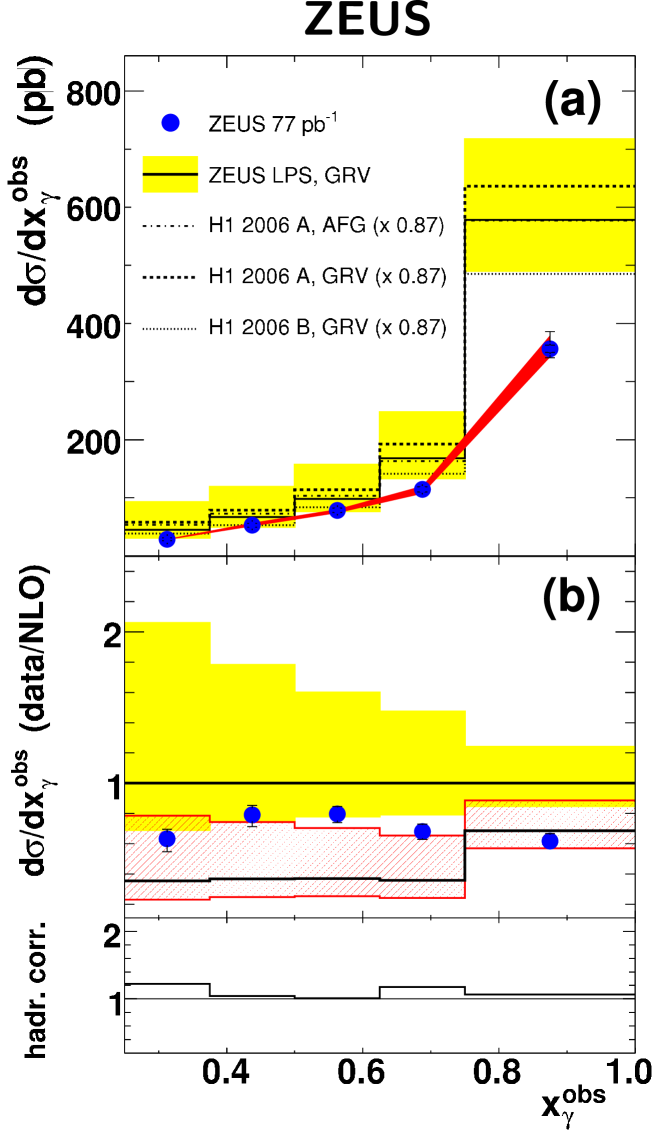
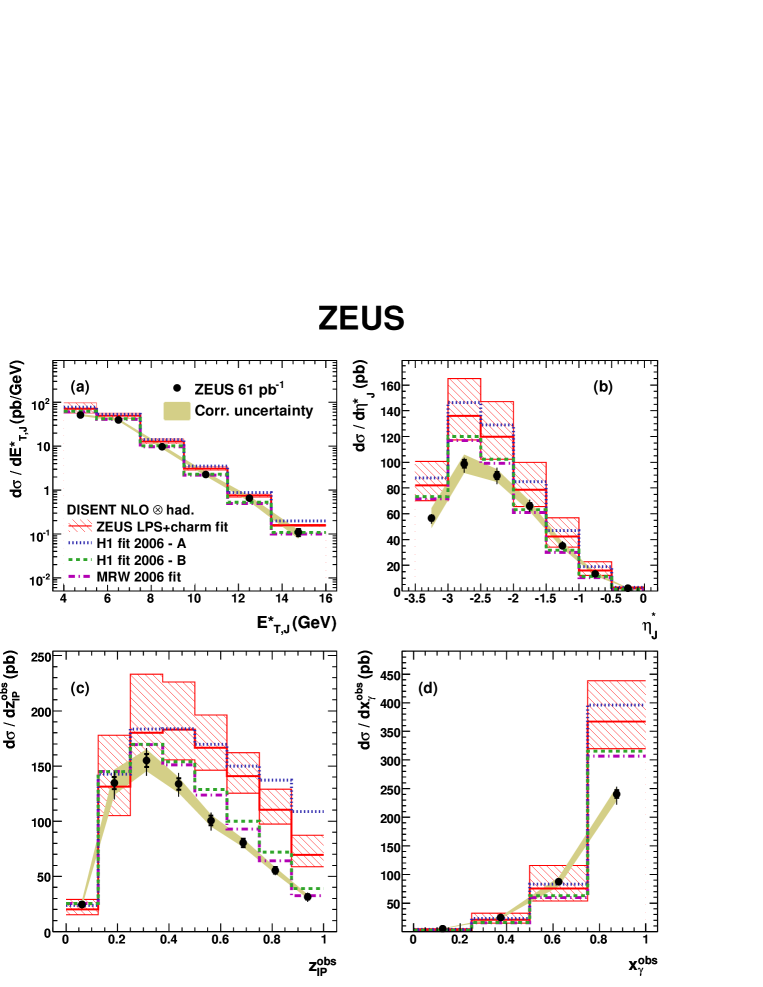
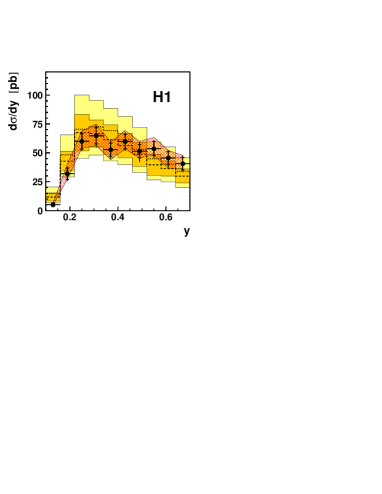
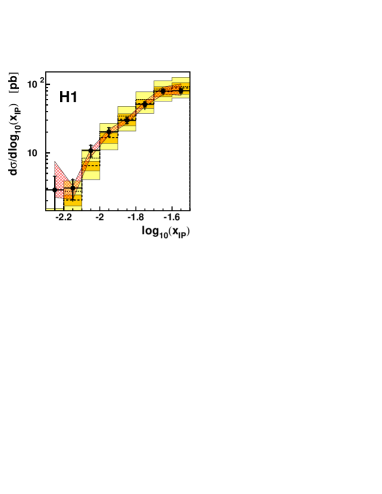
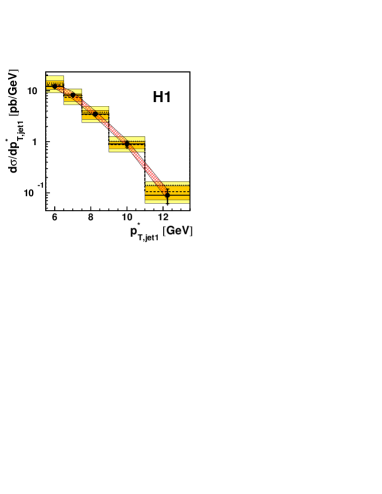
In Ref. [142] diffractive dijet production (see Fig. 85) for GeV, GeV2 has been studied by ZEUS with an integrated luminosity of 61 pb-1. The jet transverse energies in the rest system were required to be GeV and GeV, respectively; their pseudorapidities had to satisfy and their pseudorapidities in the laboratory frame were restricted to . Diffractive events were selected by requiring less than 1 GeV energy deposition in a small forward calorimeter (FPC), which ensures a large rapidity gap, and by demanding . Figure 86 shows the differential cross section as functions of , , and of , the fractional momentum of the virtual photon. For GeV, the jet cross section is falling exponentially with . The requirement of two high jets suppresses the contribution at low . The low value of the peak position in indicates additional production of hadrons.
The data were compared with NLO calculations which include direct and resolved photon contributions and use diffractive PDFs (DPDF) of Refs. [143, 144]. They determine the probability to find in the proton a parton of type i carrying a fraction of the proton momentum with a probe resolution under the condition that the proton stays intact. They have been determined by fits to inclusive diffractive DIS data. The predictions from the ZEUS LPS+charm fit, as well as those from the H1-2006 fits A and B, lie in general above the data. The MRW fit [144] is in broad agreement with the data with the exception of the high region, where the predictions are too high.
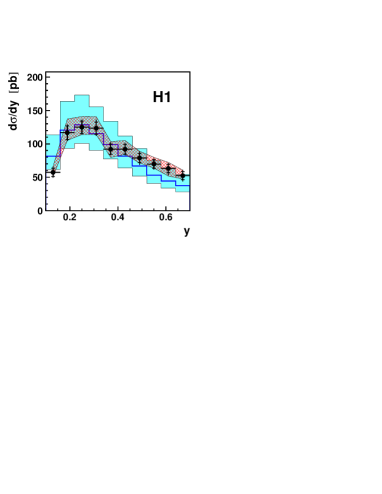
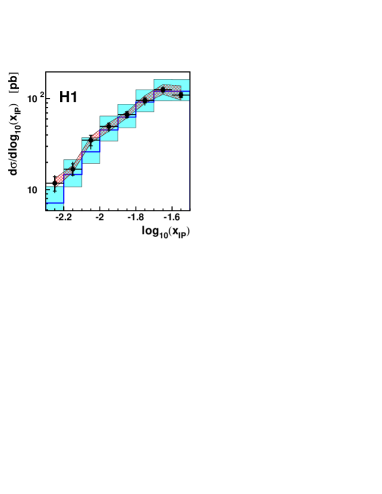
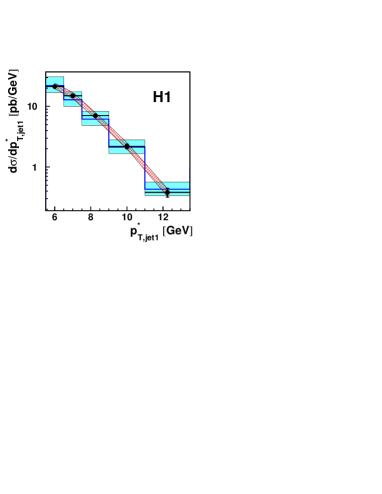
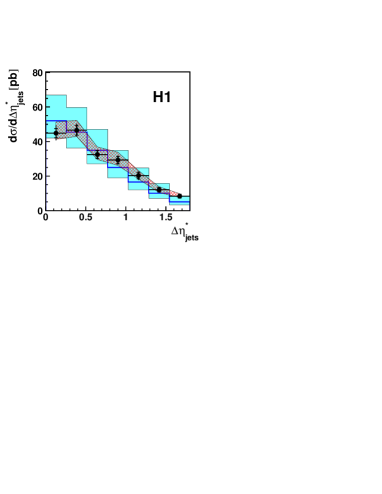
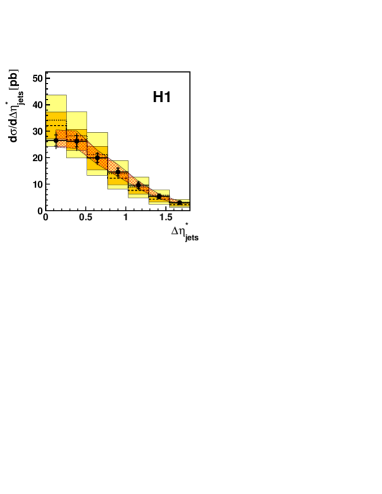
Diffractive production of dijets has also been reported by H1 [145], using data from an integrated luminosity of 51.5 with GeV and GeV2. Diffractive events were required to have , GeV, where is the mass of the nucleonic system produced in the forward (= proton direction), and GeV2. The jet selection required GeV, GeV and , where the index indicates evaluation relative to the collision axis in the centre of mass frame. Figures 87, 88 show the differential cross section as functions of and , for all ( is the fractional longitudinal momentum of the diffractive exchange carried by the parton entering the hard interaction), and for , respectively.
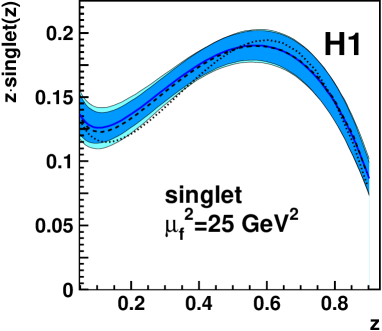
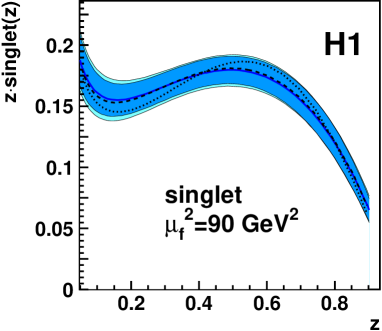
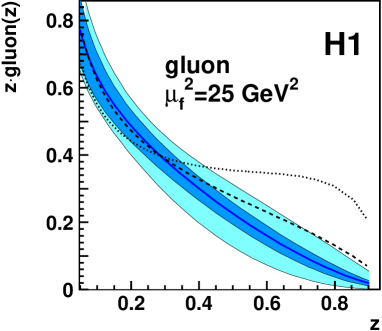
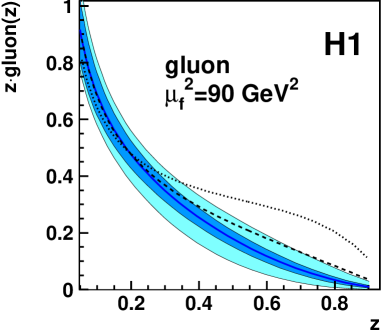
The dijet data are compared with QCD predictions at next-to-leading order based on diffractive parton distribution functions obtained from a fit to these data (H1 2007 Jets DPDF fit B, based on Refs. [146, 147]), and to H1 data on inclusive diffraction in deep-inelastic scattering. As a function of the dijet data at low and intermediate are well described. The resulting diffractive quark and gluon densities are shown in Fig. 89 (for factorisation scales = 25 and 90 GeV2, respectively) as a function of . The singlet quark densities show a (small) rise towards and a broad maximum around . In contrast, the gluon density is falling rapidly with .
10 Inclusive diffraction
Following the first observation of events with a large rapidity gap [11], ZEUS presented a quantitative study of the diffractive contribution to deep-inelastic scattering [148]. The energy flow was analyzed in the Breit frame, where the virtual photon carries only a space-like momentum component, , and the momentum vector of the incoming proton is given by . In the Quark-Parton Model, the interacting quark from the proton carries a momentum ; the component of the incoming quark is before, and after interaction with the virtual photon.
Figure 90 shows for between 14 and 380 GeV2 the energy flow distributions, , as a function of , where is the pseudorapidity of a calorimeter cell with energy deposit above 60 MeV (110 MeV) depending on the calorimeter section, and corresponds to the scattering angle of the massless struck quark emerging as the current jet. Here, and were measured in the laboratory frame. For non-rapidity gap events, (open circles), the energy flow rises towards large in the direction of the incoming proton. For events with a large rapidity gap, , the energy flow peaks around the direction of the virtual photon, , and is small at large . Note, the outgoing proton or low-mass nucleonic system arising from diffractive production was not detected in this analysis.
The colour dipole model (CDMBGF [149, 150, 151]) which decribes standard deep-inelastic scattering without diffraction, considers the production of arbitrarily many jets in leading-log approximation for parton shower development. It gives an excellent representation of the non-rapidity gap events (solid histograms) but fails for events with a large rapidity gap. Diffractive scattering is modelled by POMPYT [152] where the beam proton emits a pomeron, whose constituents take part in a hard scattering process with the virtual photon. POMPYT reproduces the distribution of events with a large rapidity gap (dashed histograms).
10.1 Inclusive diffraction by interactions
First results on inclusive photoproduction by diffraction were presented by ZEUS [153]. The selection of events with GeV, and , respectively, provided separate samples of diffractive and nondiffractive events. For diffraction, events with average hadronic masses reconstructed in the detector, = 5 and 10 GeV, respectively, were selected. The spectra for charged particles with from the nondiffractive and diffractive event samples are displayed in Fig. 91: for the diffractive samples the -spectra fall off with GeV-1 (average GeV), while the spectra for the nondiffractive sample show a long tail towards large .
10.2 Inclusive diffraction by interactions
The early observations of inclusive diffractive production in deep-inelastic scattering by ZEUS [11, 148] (see Figs.12,15,90), and subsequently by H1 [12], were followed by detailed studies of this subject.
The first measurement of the diffractive structure function was presented by H1 [157], based on an integrated luminosity of 0.27 pb-1. For unpolarised beams, the differential cross section for , can be described in terms of the diffractive structure functions, :
| (26) |
where , is the square of the c.m. energy, and the relation has been used. A possible contribution from longitudinal photons, as measured by , will be neglected in the following: it would increase the value of extracted from the differential cross section by at most .
Figure 92 shows the diffractive structure function measured by H1 [157] as a function of for different values of and . For fixed and , decreases with proportional to with , independent of and . This behaviour suggests a colourless target () in the proton, which carries only a small fraction of the proton momentum. In this case , where describes the flux of in the proton, and the cross section factorises into the flux and the cross section for virtual photon - proton scattering on target . The observed dependence corresponds to an effective Regge trajectory of which agrees with that of the Pomeron. Note, for or exchange one would expect . Therefore, the large rapidity gap events observed in deep-inelastic scattering result predominantly from diffractive scattering.
A similar conclusion was reached by ZEUS in Ref. [158]. Furthermore, the ratio of diffractive to total cross section was found to be of the order of 10 to 20%, independent of and , for and 39 GeV2. Further results were reported by H1 [159].
A novel method (-method) in the analysis of inclusive diffractive production was introduced by ZEUS [42]. Until then, the diffractive contribution had been extracted by selecting events with a large rapidity gap ( cut), or with a leading proton. The drawback of both procedures is that not only diffractive production (by the exchange of the Pomeron), but any -channel exchange (see Fig. 93) of a colourless and electrical neutral particle such as the Reggeons , etc. can produce events with a large rapidity gap and/or with a leading proton. The dependence of the cross section in the case of Reggeon exchange is proportional to at : for instance -exchange, with at , leads to .
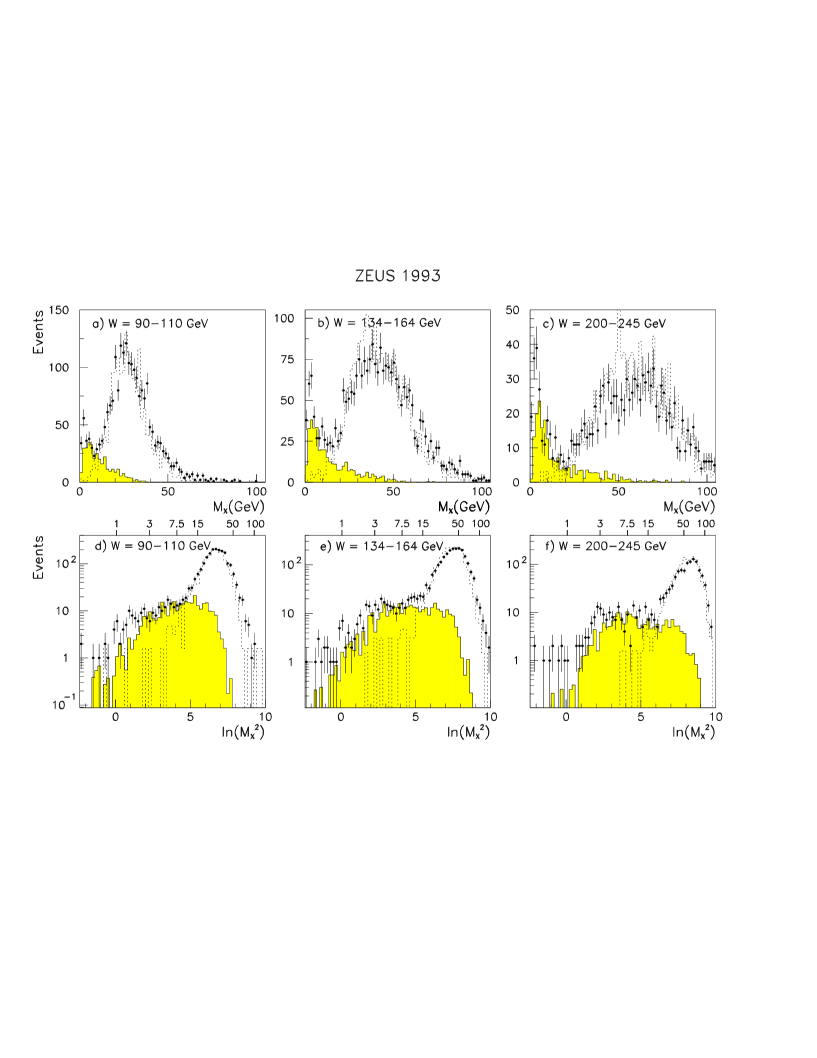
Such background is avoided by using the -method[41] for the extraction of the diffractive part since contributions from Reggeon exchange are exponentially suppressed. Here, is the mass of the hadronic system observed in the detector. The first extraction of the diffractive cross section with the -method was performed by ZEUS [42], using data from an integrated luminosity of 0.54 pb-1. The and distributions are shown in Fig. 94 at GeV2 for several bins of . In the spectra (top) the diffractive contribution is falling rapidly with increasing , while the spectra (bottom) show a plateau for the diffractive component once is sufficiently above the kinematical threshold. This allows the extraction of the diffractive contribution by a fit to the spectrum of the form:
| (27) |
The fit is applied in the interval , where is the maximum value of up to which the exponential behaviour of the nondiffractive part holds. The diffractive contribution is not taken from the fitted value of ; rather it is obtained by subtracting the nondiffractive contribution determined by the fit () from the observed number of events.
The cross section for diffractive scattering, , is shown in Fig. 95 as a function of for different values of and . The diffractive cross section is rising with for all , values. Assuming that only Pomeron exchange is contributing, the dependence for fixed was parametrised in terms of the Regge trajectory of the Pomeron,
| (28) |
The data yielded for the Regge trajectory of the Pomeron [42],
| (29) |
in agreement with the result obtained by H1, see above.
The diffractive structure function determined with the -method is shown in Fig. 96 together with the results from previous measurements of H1 [157] and ZEUS [158]. As indicated, the three measurements were performed at slightly different values of and . Broad agreement is observed between the H1 and ZEUS measurements.
The first measurement of , where the scattered proton was momentum analyzed in a magnetic spectrometer, has been reported by ZEUS [160]. Figure 97 shows as a function of the four-momentum transfer squared , for the range GeV2, GeV and . A fit of the form yielded for the slope GeV-2. Further results on from [161, 162] are also presented in Fig. 97. Since for these -values the transverse extension of the virtual photon is negligible compared to the radius of the proton then . Elastic scattering at a c.m. energy of 546 GeV yields GeV-2[163] which is expected to be equal to . This result is in good agreement with the data from HERA.
In the following, the high statistics results on inclusive diffraction as obtained by H1 and ZEUS are presented.
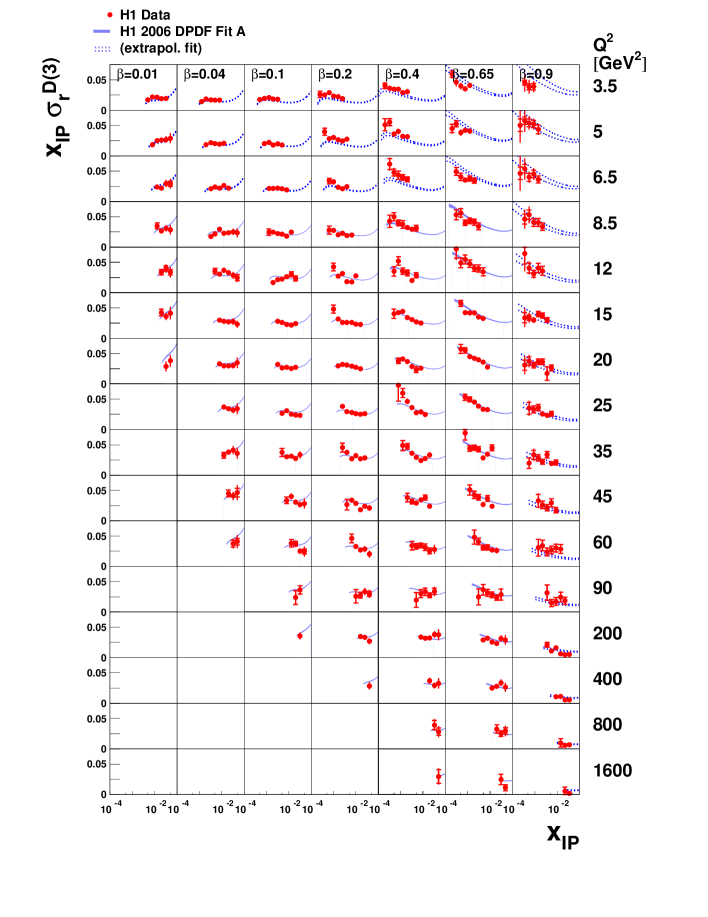
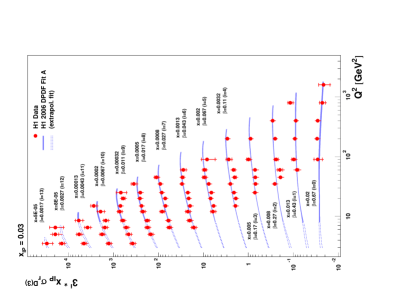
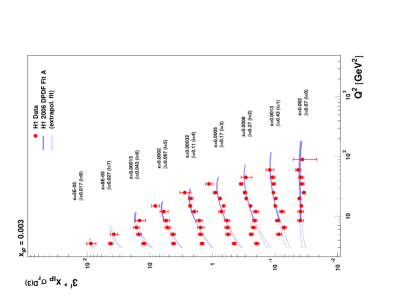
The diffractive structure function measured by H1 for values between 0.01 and 0.9, and values from 3.5 to 1600 GeV2 is shown in Fig. 98 as a function of . (From here on the term “diffractive structure function” is used for the function which H1 denotes by while ZEUS uses the notation ; multiplication by takes out a trivial dependence on and elucidates better the dependence of the diffractive structure function.). In the H1 measurement, the mass of the nucleonic system escaping through the forward beam hole is limited to GeV.
Figure 98 shows that increases as , provided . A fit of the data by a QCD motivated model, which includes the contributions from Pomeron plus Reggeon exchanges in the -channel, gives a good account of the data (see solid curves): it indicates that a large fraction of the momentum of the Pomeron exchanged in the -channel is carried by gluons (see dashed curves). In the model, the rise of for is due to Pomeron-Reggeon interference.
10.3 Inclusive diffraction at GeV, GeV2
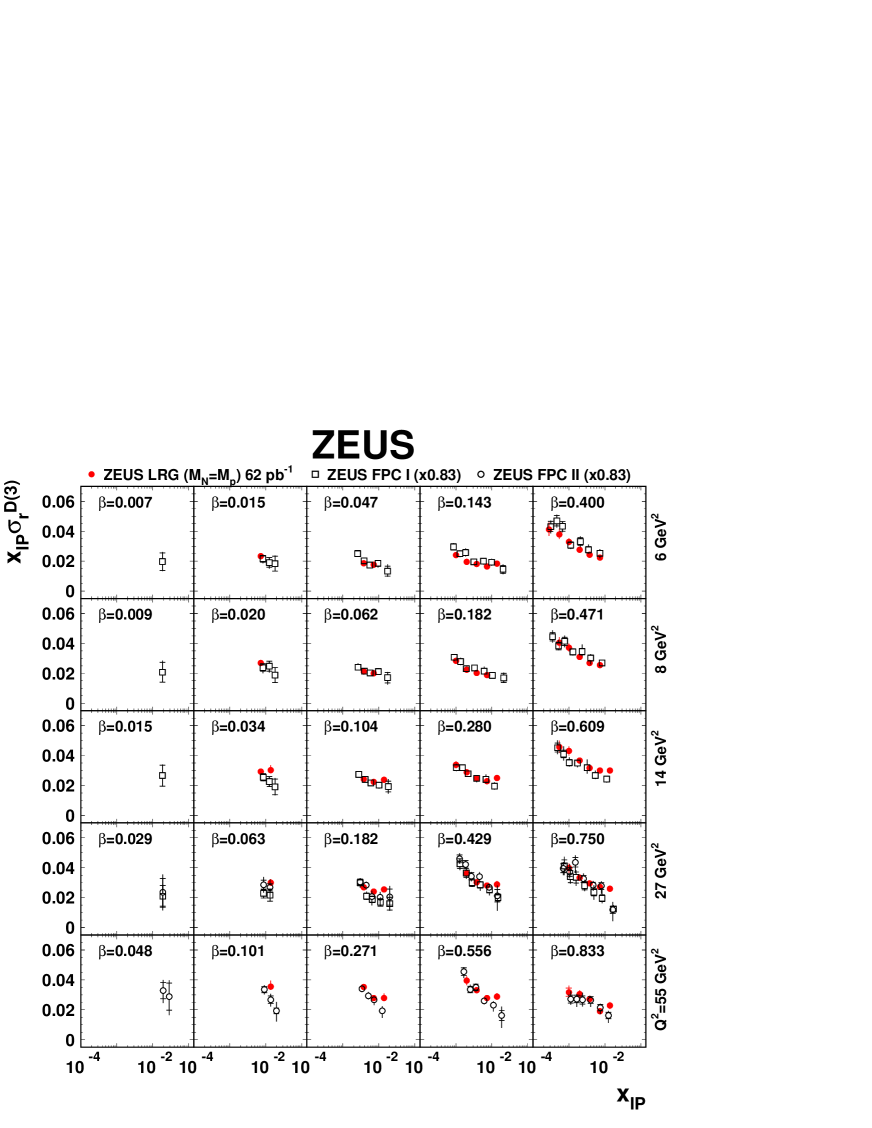
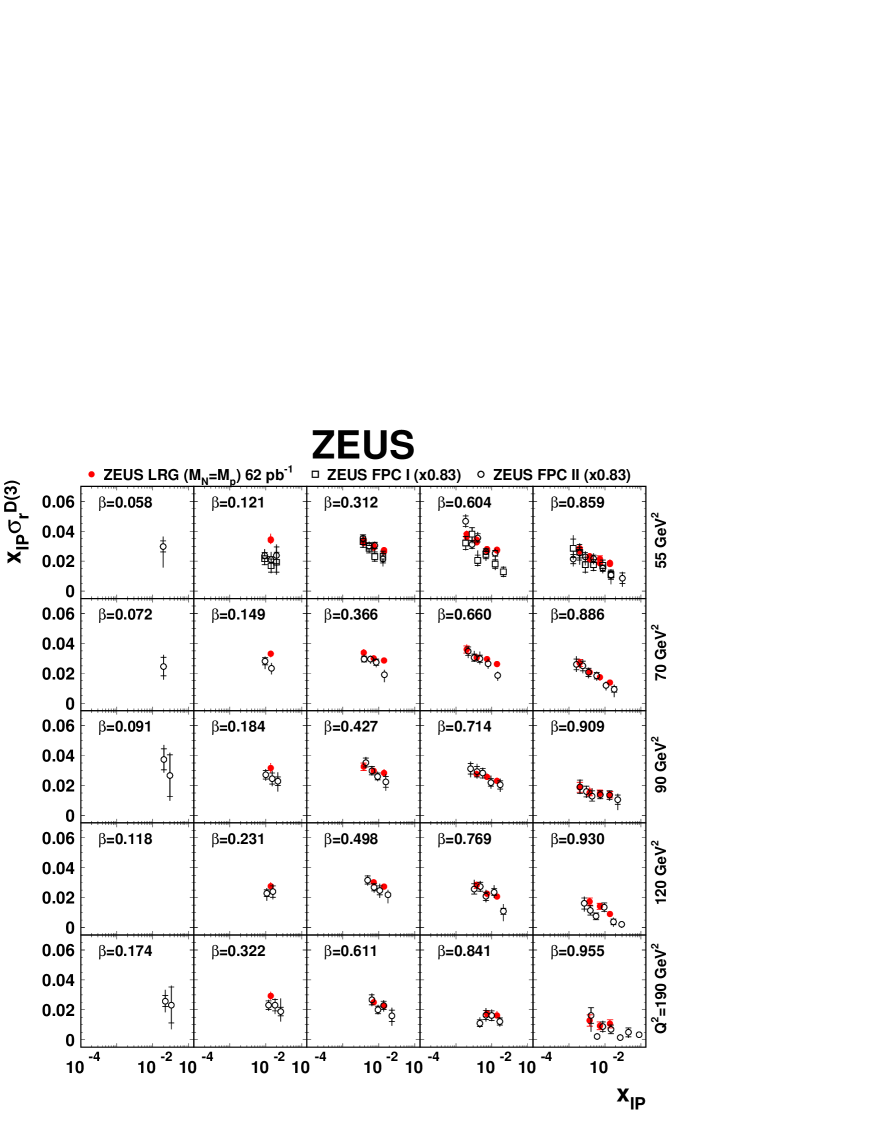
Inclusive diffraction in deep-inelastic scattering has been measured by ZEUS over a wide space in , and , making use of the forward-plug calorimeter (FPC). The FPC had a beamhole of only 3.15 cm radius for the passage of the beams. This limited the mass of the nucleonic system escaping undetected in the forward (= proton) direction to GeV, on average.
Data were collected in two periods for GeV2 and GeV2 with integrated luminosities of 4.2 [21] and 52.4 pb-1 [22], respectively. The diffractive cross section is shown in Figs. 101, 102 as a function of for the bins of and indicated. In all , bins with sufficient coverage the diffractive cross section shows a strong rise with .
The ratio of the diffractive contribution to the total cross section is displayed in Figs. 103, 104 as a function of , for different values of and . For fixed values of the relative contribution of diffraction to the total cross section is approximately independent of . It is substantial when . The ratio is at GeV2, decreasing to at GeV2, see Fig. 105. Since the optical theorem relates the forward amplitude for elastic scattering to the total cross section - which behaves, say, proportional to - one would naively expect that the diffractive cross section is proportional to . However, the measured ratio of the diffractive contribution to the total cross section is approximately independent of , as shown in Figs. 103, 104. This apparent contradiction is understood as the result of a strong growth of the gluon density (“color glass condensate”) such that gluon-gluon interactions become important and damp the rise of the diffractive cross section [165].
The diffractive structure function for , , is shown in Figs. 106, 107 as a function of for fixed , or equivqalently for fixed : rises approximately proportional to as , reflecting the rise of the diffractive cross section with increasing . The rise is observed for most values between 2.7 and 320 GeV2.
The dependence of for fixed and is shown in Fig. 108. The data are dominated by positive scaling violations for , by negative scaling violations for , and by constancy in between. The data contradict the assumption of Regge factorisation, namely that factorises into a term that depends only on , and a second term that depends only on and .
10.4 Leading proton production and the contribution from diffraction
Deep inelastic diffractive scattering has also been studied in measurements where the scattered proton was detetced in a forward spectrometer. The first such measurement has been reported by ZEUS [160]. Figure 97 shows as a function of the four-momentum transfer squared , for the range GeV2, GeV and . A fit of the form yielded for the slope GeV-2. Further results on from [161, 162] are also presented in Figure 97. For the -values selected, the transverse extension of the virtual photon is negligible compared to the radius of the proton.
The final measurement [166], based on an integrated luminosity of 32.6 pb-1, provided results for the kinematic region GeV2, GeV, GeV. The diffractive peak covered the region , where is the fraction of the momentum of the incoming proton carried by the scattered proton.
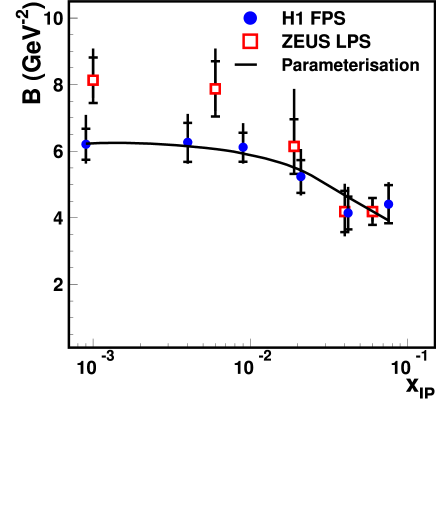
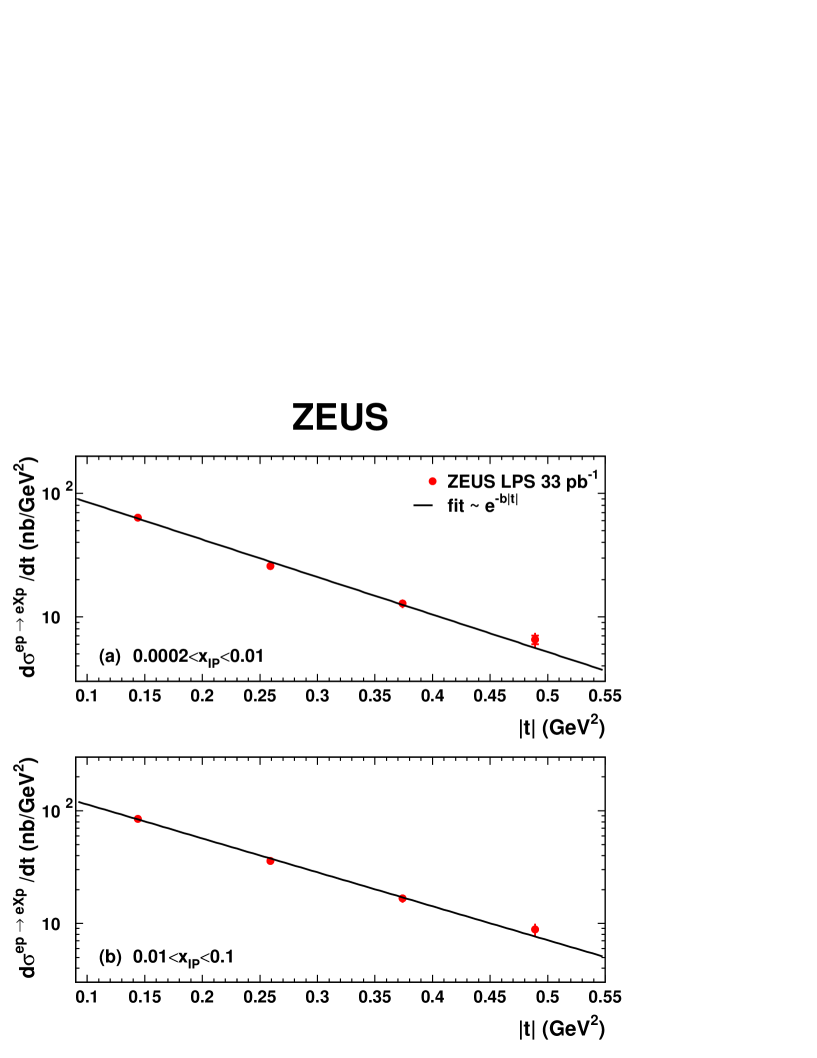
The differential cross section is shown in Fig. 109 as a function of for and , respectively. The cross section is falling exponentially with , , where GeV-2 for and GeV-2 for . Within errors the value of is independent of , and .
The cross section for was also studied in terms of the azimuthal angle between the positron scattering angle and the proton scattering plane. Within errors no significant dependence on was observed for and , respectively. This is in contrast to production by deep-inelastic scattering, [69], where a substantial dependence on had been observed, viz. , .
The structure function , here denoted by , is shown in Figs. 110, 111 and compared with the FPCI,II measurements discussed before. The data from the FPCI,II measurements have been scaled down by a factor of 0.83 to account for the extra contribution from dissociation with GeV. Good agreement between the FPC and LPS measurements is observed.
10.4.1 Comparison with the BEKW parametrisation
Further insight into the behavior of the diffractive structure function can be gained with the help of the BEKW parametrisation [164] which is guided by QCD. It considers the case where the incoming virtual photon fluctuates into a or dipole, which in turn interacts with the target proton via the exchange of a two-gluon system, the Pomeron. The contributions from the transitions: transverse photon to and , respectively, and longitudinal photon to , are taken into account. The spectrum and the scaling behaviour in are derived in the non-perturbative limit from the wave functions of the incoming transverse () and longitudinal () photons on the light cone. The dependence of the cross section is not predicted by BEKW and has to be determined by experiment. The BEKW parametrisation reads as follows:
| (30) |
where
| (31) | |||||
| (32) | |||||
| (33) |
In the ZEUS analysis, the powers were assumed to be the same for the contributions from and , and of the form with GeV2.
The contribution from longitudinal photons coupling to is limited to values close to unity. The contribution from transverse photons is expected to have a broad maximum around , while the contribution becomes important at small , provided the power is large.
The original BEKW parametrisation also includes a higher-twist term for produced by transverse photons. Since the data were insensitive to this term, it was neglected. A fit of this modified BEKW form (BEKW(mod)) to the ZEUS data [21, 22] gave an excellent description of the data with the following result for the five parameters left free: , , , and .
The curves in Figs. 106, 107 show the individual contributions from the , and terms, and their sum. The contribution from is important for ; the contribution is dominant for , while gluon emission, , is important at small . The curves in Fig. 108 show the sum of the contributions.
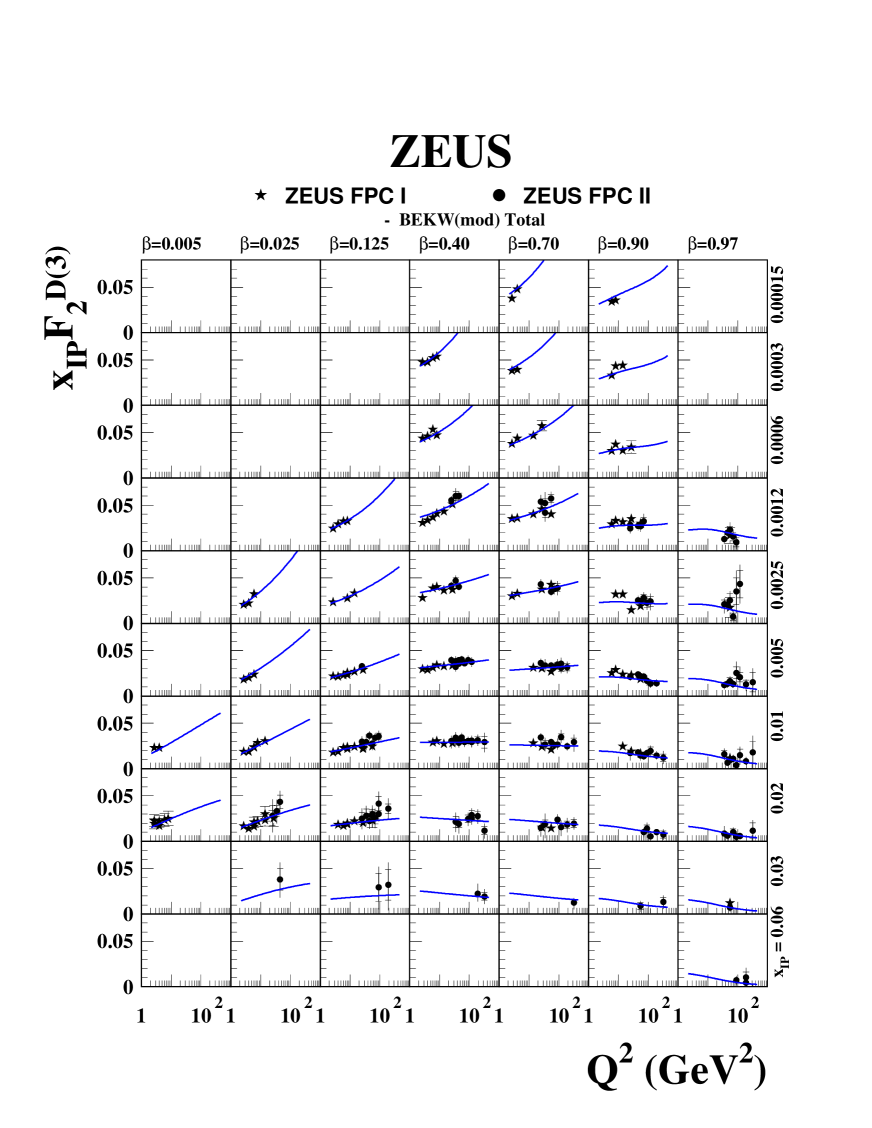
The dependence of is shown in Figs. 112, 113, 114 for fixed values of and . In general, the values measured at different values cluster around a narrow band of the form . The curves show the contributions from , and , as determined by the BEKW(mod) fit. The dominant contribution is of the form as predicted for ; the rise towards small is the result of gluon emission, ; contributions from longitudinal photons, , are important near only.
11 Summary and conclusions
HERA has opened the door to the study of diffraction in real and virtual photon proton scattering within a large range in total c.m. energy and photon virtuality .
A substantial fraction of diffractive scattering leads to the production of vectormesons, , where . For fixed , the cross sections rise with c.m. energy proportional to . In photoproduction, for the light vectormesons, and () for (. In virtual-photon proton scattering, the integrated cross sections at fixed GeV lie on a universal curve, decreasing exponentially with provided GeV2. The differential cross sections decrease with proportional to , where GeV-2 for GeV2, and dropping rapidly to a constant value of GeV-2 when GeV2.
The dependence of is reproduced well by a QCD based model where the photon fluctuates into a pair which interacts with the gluon cloud of the proton to produce the .
The decay angular distributions of photoproduced , and show that the vectormesons are transversely aligned and the helicity is conserved in the s-channel (SCHC). In virtual photon proton scattering, the decay angular distributions show that under the assumption of SCHC, and are produced predominantly by longitudinal photons.
The production by real and virtual photons of events with a large rapidity gap and two or more jets gave evidence for hard diffractive scattering. The experimental results are reproduced by QCD calculations in NLO.
Inclusive diffraction, , where is a proton or a low-mass nucleonic system, behaves similar to the production of vectormesons. For fixed and sufficient coverage in , the cross section differential in the mass of the system , shows a rapid rise with , , where for GeV2. It yields for the average of the Pomeron trajectory a value of . The dependence on is of the form with GeV-2.
The ratio of the diffractive cross section, integrated over GeV, to the total cross section is approximately constant with , being at GeV2 and decreasing to at GeV2.
The diffractive structure function of the proton, , where and , has been measured for values between 2.7 and 1600 GeV2. For fixed values of and , is rising as .
A QCD inspired model (BEKW), in which the incoming photon fluctuates into a or dipole that interacts with the target proton by the exchange of a two-gluon system (the ”Pomeron”), gives an excellent description of the data for inclusive diffraction, after adjusting the free parameters. The contribution from longitudinal photons via exchange is important for while transverse photons dominate the regions by exchange, and by exchange.
Acknowledgements
The author is most grateful to Erich Lohrmann and Paul Söding for a critical review of the manuscript.
{mcbibliography}10
References
- [1] P. V. Landshoff and J. C. Polkinghorne, Nucl. Phys. B 32, 541 (1971)
- [2] G. A. Jaroskiewicz and P. V. Landshoff, Phys. Rev. D 10, 170 (1974)
- [3] F. E. Low, Phys. Rev. D 12, 169 (1975)
- [4] S. Nussinov, Phys. Rev. Lett. 34, 1286 (1975)
- [5] S. Nussinov, Phys. Rev. D 14, 246 (1976)
- [6] G. Ingelman and P. E. Schlein, Phys. Lett. B 152, 256 (1985)
- [7] A. Donnachie and P. V. Landshoff, Phys. Lett. B 191, 309 (1987)
- [8] K. H. Streng, Proc. HERA Workshop, Vol. 1, eds. W. Buchmüller and G. Ingelman (1991) p.23.
- [9] UA8 Coll., A. Brandt et al., Phys. Lett. B 211, 239 (1988)
- [10] UA8 Coll., A. Brandt et al., Phys. Lett. B 297, 417 (1992)
- [11] ZEUS Coll., M. Derrick et al., Phys. Lett. B 315, 481 (1993)
- [12] H1 Coll., T. Ahmed et al., Nucl. Phys. B 429, 477 (1994)
- [13] J. Bartels and M. Loewe, Z. Phys. C 12, 263 (1982)
- [14] L. V. Gribov,E. M. Levin and M. G. Ryskin, Pysics Reports 100, 1 (1983)
- [15] See ZEUS: A Detector for HERA, Letter of Intent, (1985)
- [16] H1 Coll., I. Abt et al., Nucl. Inst. Meth. A 386, 310 (1997)
- [17] H1 Coll., I. Abt et al., Nucl. Inst. Meth. A 386, 348 (1997)
- [18] ZEUS Coll., U. Holm (ed.), The ZEUS Detector, Status Report (unpublished), DESY (1993), available on http://www-zeus.desy.de/bluebook/bluebook.html
- [19] ZEUS Coll., M. Derrick et al., Phys. Lett. B 293, 465 (1992)
- [20] A. Bamberger et al., Nucl. Inst. Meth. A 450, 235 (2000)
- [21] ZEUS Coll., S. Chekanov et al., Nucl. Phys. B 713, 3 (2005)
- [22] ZEUS Coll., S. Chekanov et al., Nucl. Phys. B 800, 1 (2008)
- [23] H1 Coll., C. Adloff et al. Eur. Phys. J. C 21, 33 (2001)
- [24] ZEUS Coll., S. Chekanov et al., Phys. Rev. D 67, 12007 (2003)
- [25] SLAC-MIT Coll., L. W.Whitlaw et al., Phys. Lett. B 282, 475 (1992)
- [26] E665 Coll., M. R. Adams et al., Phys. Rev. D 54, 3006 (1996)
- [27] NMC Coll., M. Arneodo et al., Nucl. Phys. B 483, 3 (1997)
- [28] BCDMS Coll., A. C. Benvenuti et al., Phys. Lett. B 223, 485 (1989)
- [29] H1 Coll., F. D. Aaron et al. Phys. Lett. B 665, 139 (2008)
- [30] ZEUS Coll., J. Breitweg et al., Phys. Lett. B 487, 53 (2000)
- [31] ZEUS Coll., S. Chekanov et al., Nucl. Phys. B 627, 3 (2002)
- [32] ZEUS Coll., M. Derrick et al., Z. Phys. C 63, 391 (1994)
- [33] H1 Coll., T. Ahmed et al., Phys. Lett. B 299, 374 (1995)
- [34] H1 Coll., S. Aid et al., Z. Phys. C 69, 27 (1995)
- [35] D. O. Caldwell et al., Phys. Rev. Lett. 40, 1222 (1978)
- [36] S. I. Alekhin et al., CERN Report HERA 87-01 (1987)
- [37] J. R. Cudell et al. Phys. Rev. D61, 034019 (2000)
- [38] J. R. Cudell et al. Phys. Rev. D63, 059901 (2001)
- [39] A. Donnachie and P. V. Landshoff, Phys. Lett. B 437, 408 (1998)
- [40] L. Hand, Phys. Rev. 129, 408 (1963)
- [41] H. Kowalski, M. Roco and G. Wolf, ZEUS note 96-038 (18-12-1995), unpublished
- [42] ZEUS Coll., M. Derrick et al., Z. Phys. C 70, 391 (1996)
- [43] H1 Coll., C. Adloff et al., Phys. Lett. B 517, 47 (2001)
- [44] H1 Coll., A. Aktas et al., Phys. Lett. B 659, 796 (2005)
- [45] ZEUS Coll., S. Chekanov et al., Phys. Lett. B 573, 46 (2003)
- [46] ZEUS Coll., S. Chekanov et al., DESY Report 08-132(2008), to be publ. in JHEP
- [47] A. Freund, Phys. Rev. D 68, 09006 (2003)
- [48] A. D. Martin et al. Eur. Phys. J. C 23, 73 (2002)
- [49] ZEUS Coll., M. Derrick et al., Z. Phys. C 69, 39 (1995)
- [50] S. D. Drell, Phys. Rev. Lett. 5, 278 (1960)
- [51] P. Söding, Phys. Lett. 19, 702 (1996)
- [52] W. Struczinski et al., Nucl. Phys. B 108, 45 (1976)
- [53] SWT Coll., Y. Eisenberg et al., Phys. Rev. D5, 15 (1972)
- [54] SBT Coll., J. Ballam et al., Phys. Rev. D5, 545 (1972)
- [55] J. Park et al., Nucl. Phys. B 36, 404 (1972)
- [56] SBT Coll., J. Ballam et al., Phys. Rev. D7, 3150 (1973)
- [57] OMEGA Coll., D. Aston et al., Nucl. Phys. B 209, 56 (1982)
- [58] ZEUS Coll., M. Derrick et al., Z. Phys. C 73, 253 (1997)
- [59] H1 Coll., S. Aid et al., Nucl. Phys. B 463, 3 (1996)
- [60] K. Schilling, P. Seyboth and G. Wolf, Nucl. Phys. B 15, 397 (1973)
- [61] K. Schilling and G. Wolf, Nucl. Phys. B 61, 381 (1970)
- [62] ZEUS Coll., M. Derrick et al., Phys. Lett. B 356, 601 (1995)
- [63] P. Amaudruz et al., Z. Phys. C 54, 239 (1992)
- [64] H1 Coll., S. Aid et al., Nucl. Phys. B 468, 3 (1996)
- [65] H1 Coll., C. Adloff et al., Z. Phys. C 75, 607 (1997)
- [66] H1 Coll., C. Adloff et al., Eur. Phys. J. C 13, 371 (2000)
- [67] ZEUS Coll., J. Breitweg et al., Eur. Phys. J. C 7, 609 (1999)
- [68] P. Joos et al., Nucl. Phys. B 113, 53 (1976)
- [69] ZEUS Coll., S. Chekanov et al., PMC A 1, 6 (2007)
- [70] Henri Kowalski and Derek Teany, Phys. Rev. D 68, 114005 (2003)
- [71] H. Kowalski, L. Motyka and G. Watt, Phys. Rev. D 74, 074016 (2006)
- [72] H. G. Dosch and E. Ferreira, hep-ph/0610311 (2006)
- [73] J. R. Forshaw,R. Sandapen and G. Shaw, Phys. Rev. D 69, 094013 (2004)
- [74] A. Breakstone et al., Nucl. Phys. B 248, 253 (1984)
- [75] A. D. Martin,M. G. Ryskin and T. Teubner, Phys. Rev. D 55, 4329 (1997)
- [76] ZEUS Coll., M. Derrick et al., Z. Phys. C 73, 73 (1996)
- [77] ZEUS Coll., J. Breitweg et al., Phys. Lett. B 487, 3 (2000)
- [78] H. R. Crouch et al., Phys. Rev. 155, 1468 (1967)
- [79] ABBHHM Coll., R. Erbe et al., Phys. Rev. 175, 1669 (1968)
- [80] M. Davier et al., Phys. Rev. D1, 790 (1970)
- [81] R. M. Egloff et al., Phys. Rev. Lett. 43, 1545 (1979); erratum ibid.44, 690 (1979)
- [82] A. M. Breakstone et al., Phys. Rev. Lett. 47, 1782 (1981) Erratum
- [83] LAMP2 Group, D. P. Barber et al., Z. Phys. C 26, 343 (1984)
- [84] OMEGA Coll., M. Atkinson et al., Nucl. Phys. B 231, 15 (1984)
- [85] J. Busenitz et al., Phys. Rev. D40, 1 (1989)
- [86] ZEUS Coll., M. Derrick et al., Phys. Lett. B 377, 259 (1996)
- [87] ZEUS Coll., M. Derrick et al., Phys. Lett. B 380, 220 (1996)
- [88] H1 Coll., C. Adloff et al., Phys. Lett. B 483, 360 (2000)
- [89] ZEUS Coll., S. Chekanov et al., Phys. Lett. B 553, 141 (2003)
- [90] ZEUS Coll., S. Chekanov et al., Nucl. Phys. B 718, 3 (2003)
- [91] H1 Coll., T. Ahmed et al., Phys. Lett. B 338, 507 (1994)
- [92] U. Camerini et al., Phys. Rev. Lett. 43, 187 (1979)
- [93] EMC Coll., J. J. Aubert et al., Nucl. Phys. B 213, 1 (1983)
- [94] NMC Coll., M. Arneodo et al., Phys. Lett. B 332, 195 (1994)
- [95] NMC Coll., P. L. Frabettiet al., Phys. Lett. B 316, 197 (1993)
- [96] FTPS Coll., B. H. Denby et al., Phys. Rev. Lett. 52, 795 (1984)
- [97] Na14 Coll.. R. Barate et al., Z. Phys. C 33, 505 (1987)
- [98] E401 Coll., M. Binkley et al., Phys. Rev. Lett. 48, 73 (1982)
- [99] ZEUS Coll., S. Chekanov et al., Eur. Phys. J. C 24, 345 (2002)
- [100] H1 Coll., A.Aktas et al., Eur. Phys. J. C 46, 585 (2006)
- [101] ZEUS Coll., J. Breitweg et al., Eur. Phys. J. C 6, 603 (1999)
- [102] ZEUS Coll., S. Chekanov et al., Nucl. Phys. B 695, 3 (2004)
- [103] H1 Coll., C. Adloff et al., Eur. Phys. J. C 10, 373 (1999)
- [104] H1 Coll., C. Adloff et al., Phys. Lett. B 421, 385 (2002)
- [105] H1 Coll., C. Adloff et al., Phys. Lett. B 541, 251 (2002)
- [106] J. Nemchik et al., J. Exp. Theor. Phys. 86, 1054 (1998)
- [107] J. Hüfner et al., Phys. Rev. 62, 092022 (2000)
- [108] ZEUS Coll., J. Breitweg et al., Phys. Lett. B 437, 432 (2000)
- [109] CDF Coll. F. Abe et al., Phys. Rev. Lett. 75, 4358 (1995)
- [110] H1 Coll., C. Adloff et al., Phys. Lett. B 483, 23 (2000)
-
[111]
A. Levy,
12th Int. Conf. Elastic and Diffractive Scattering
(Blois Workshop), 2 (2007) - [112] E. Iancu, K. Itakura and S. Munier, Phys. Lett. B 590, 199 (2004)
- [113] L. McLerran and R. Venugopolan, Phys. Rev. D49, 2233 (1994) and D50, 2225 (1994)
- [114] G. Watt and H. Kowalski, Phys. Rev. D 78, 014016 (2008)
- [115] L. Motyka and G. Watt, arXiv:0805.2113v2 (2008)
- [116] P. G. Freund, Nuovo Cim. 48 A, 541 (1967)
- [117] V. Barger and D. Cline, Phys. Rev. Lett. 24, 1313 (1970)
- [118] Particle Data Group, Particle Physics Booklet, (July 2006)
- [119] Particle Data Group, Journal Physics G. 33 341 (July 2006)
- [120] ZEUS Coll., S. Chekanov et al., Eur. Phys. J. C 51, 301 (2007)
- [121] L. Alvero et al., Phys. Rev. D 59, 074022 (1999)
- [122] H1 Coll., F. D. Aaron et al., Eur. Phys. J., to be published
- [123] ZEUS Coll., M. Derrick et al., Phys. Lett. B 332, 228 (1994)
- [124] H1 Coll., T. Ahmed et al., Nucl. Phys. B 435, 3 (1995)
- [125] ZEUS Coll., M. Derrick et al., Phys. Lett. B 356, 129 (1995)
- [126] ZEUS Coll., M. Derrick et al., Phys. Lett. B 369, 55 (1996)
- [127] ZEUS Coll., J. Breitweg et al., Eur. Phys. J. C 5, 41 (1998)
- [128] ZEUS Coll., S. Chekanov et al., Eur. Phys. J. C 52, 177 (2008)
- [129] H1 Coll., C. Adloff et al., Eur. Phys. J. C 6, 421 (1999)
- [130] H1 Coll., C. Adloff et al., Eur. Phys. J. C 24, 517 (2002)
- [131] H1 Coll., A. Aktas et al., Eur. Phys. J. C 51, 549 (2007)
- [132] M. Klasen and G. Kramer, Eur. Phys. J. C 38, 93 (2004)
- [133] ZEUS Coll., J. Breitweg et al., Phys. Lett. B 421, 368 (1998)
- [134] PLUTO Coll., Ch. Berger et al., Z. Phys. C 12, 297 (1982)
- [135] TASSO Coll., M. Althoff et al., Z. Phys. C 26, 157 (1984)
- [136] J. Vermaseren, F. Barreiro, L. Labarga, F. J. Yndurain, DESY Report 97-031 (1997).
- [137] H. Jung, Comp. Phys. 86, 147 (1995)
- [138] ZEUS Coll., S. Chekanov et al., Phys. Lett. B 516, 3 (2001)
- [139] H. Kowalski DESY 99-141 (1999)
- [140] T. Yamashita, Ph.D. thesis, University of Tokyo (2001)
- [141] H. Jung and H. Kowalski, private communication
- [142] ZEUS Coll., S. Chekanov et al., Eur. Phys. J. C 52, 813 (2007)
- [143] H1 Coll., A. Aktas et al., Eur. Phys. J. C 48, 715 (2006)
- [144] A. D. Martin, M. G. Ryskin and G. Watt, Phys. Lett. B 644, 131 (2006)
- [145] H1 Coll., A. Aktas et al., J. High Energy Physics 0710, 42 (2007)
- [146] B. List and A. Mastroberardino DESY-Proc-1999-02(1999)396
- [147] Z. Nagy and Z. Trocsanyi, Phys. Rev. Lett. 87, 082001 (2001)
- [148] ZEUS Coll., M. Derrick et al., Phys. Lett. B 338, 483 (1994)
- [149] M. Bengtsson, G. Ingelman and T. Sjöstrand, Nucl. Phys. B 301, 554 (1988)
- [150] L. Łönnblad, Comp. Phys. Comm. 39, 347 (1986)
- [151] T. Sjöstrand and M. Bengtsson, Comp. Phys. Comm. 43, 367 (1987)
- [152] P. Bruni and G. Ingelman, DESY-Report 187 (1993)
- [153] ZEUS Coll., M. Derrick et al., Z. Phys. C 67, 227 (1995)
- [154] H1 Coll., C. Adloff et al., Nucl. Phys. B 619, 3 (2001)
- [155] ZEUS Coll., S. Chekanov et al., Nucl. Phys. B 658, 3 (2003)
- [156] J. Whitmore et al., Phys. Ref. D 11, 3124 (1975)
- [157] H1 Coll., T. Ahmed et al., Nucl. Phys. B 348, 681 (1995)
- [158] ZEUS Coll., M. Derrick et al., Z. Phys. C 68, 569 (1995)
- [159] H1 Coll., S. Aid et al., Z. Phys. C 70, 609 (1996)
- [160] ZEUS Coll., J. Breitweg et al., Eur. Phys. J. C 1, 81 (1998)
- [161] ZEUS Coll., S. Chekanov et al., Eur. Phys. J. C 38, 43 (2004)
- [162] H1 Coll., C. Aktas et al., Eur. Phys. J. C 48, 749 (2006)
- [163] UA4 Coll., M. Bozzo et al., Phys. Lett. B 147, 385 (1984)
- [164] J. Bartels, J. Ellis, H. Kowalski, M. Wüsthoff, Eur. Phys. J. C 7, 443 (1999)
- [165] J. Bartels, Eur. Phys. J. C 43, 3 (2005)
- [166] ZEUS Coll., S. Chekanov et al. Nucl. Phys. B 816, 1 (2009)
- [167] J. D. Bjorken, Journal Mod. Phys. A7, 4189 (1992)
- [168] J. D. Bjorken, Phys. Rev. D47, 101 (1993)
- [169] J. Bartels, S. Badarenko, K. Kutak, L. Motyka, Phys. Rev. D75, 93004 (2006)
- [170] E. G. S. Luna, V. A. Khoze, A. D. Martin, M. G. Ryskin, Eur. Phys. J. C 59, 1 (2009)


![[Uncaptioned image]](/html/0907.1217/assets/x53.png)