11email: vidakris@elte.hu 22institutetext: Konkoly Observatory of the Hungarian Academy of Sciences, 1525 Budapest, PO Box 67, Hungary 33institutetext: European Southern Observatory, Karl-Schwarzschild-Straße 2, 85748 Garching bei München, Germany 44institutetext: Astrophysical Institute Potsdam, An der Sternwarte 16, 14482 Potsdam, Germany 55institutetext: AEKI, KFKI Atomic Energy Research Institute, Thermohydraulic Department, H–1525 Budapest 114, PO Box 49, Hungary
Photospheric and chromospheric activity in V405 And
We investigate the fast rotating ( ) active dwarf binary V405 And (M0V+M5V) using photometric and optical spectroscopic data. The light variation is caused by the combined effect of spottedness and binarity with a small eclipse. From the available light and radial velocity curves we estimate the system parameters. Three flare events happened during the observations: two were found in the spectroscopic data and one was observed photometrically in colours. An interesting eruptive phenomenon emerged from the photometric measurements which can be interpreted as a series of post-flare eruptions lasting for at least 3 orbits (rotations) of the system, originating from trans-equatorial magnetic loops, which connect the active regions in the two hemispheres. The two components of V405 And have masses well over and below the theoretical limit of full convection. This rare property makes the binary an ideal target for observing and testing models for stellar dynamo action.
Key Words.:
Stars: individual: V405 And – (Stars:) binaries: eclipsing – Stars: activity – Stars: chromospheres – (Stars:) starspots – Stars: fundamental parameters1 Introduction
Low mass stars are in the focus of studying stellar structure: these kind of objects make up the majority of the Galaxy, yet, because of their low luminosity, it is not easy to study them in detail. Low mass stars with fast rotation show magnetic phenomena (spots, plages, flares, strong X-ray emission) due to some kind of magnetic dynamo in their interiors. Stars with radiative core and convection zone are thought to operate dynamos. The -effect creates poloidal field from toroidal one by helical turbulence in the convection zone, whereas -effect produce toroidal field from poloidal one by differential rotation. The place of the dynamo process is thought to be a thin layer between the core and convection zone, called tachocline, where the shear is the strongest. Below about 0.32M⊙ stars are thought to be fully convective, yet show all known magnetic phenomena as well. The source of the magnetic field in these low mass stars could be dynamo generating strong, long-lasting, axisymmetric magnetic fields by turbulence, or by some other mechanism involving differential rotation. However, the mass limit (or the spectral limit of M3.5) of the full convection is not well established, since strong magnetic fields may shift this boundary towards lower masses (Mullan & MacDonald 2001, Chabrier et al. 2007). For low mass () active stars a significant discrepancy is found between models and observations of stellar radii, i.e., theory predicts 10% lower radii, while temperatures are underestimated by about 5% (see e.g. Ribas 2006).
An interesting approach is to study low mass stars above and below this hypothetical mass limit together in close binary systems. As to our knowledge, only two such systems are known. 2MASS J04463285+1901432, in NGC 1647 (Hebb et al. 2006) has an orbital period of and masses of 0.47 and 0.19M⊙, however, its prevents more detailed investigation of this binary.
The binary studied in this work is an X-ray bright object, listed in the ROSAT All-Sky-Survey as RX J0222.4+4729 (Voges et al. 1996), later named as V405 And classified as RS CVn type in the General Catalogue of Variable Stars (Kazarovets et al. 2000; Samus et al. 2009). The only detailed study of V405 And is from Chevalier & Ilovaisky (1997) (CI97 hereafter), who find that the binary has an orbital period of showing a small (near grazing) eclipse, and present photometric observations in and , radial velocity data and H study. The components have spectral types M0V and M5V derived by CI97, both of them showing strong H emission lines, of which the primary is modulated by the rotation. The original classification of the system is BY Dra binary by the above authors. Note, that the definitions of the ’RS’ and ’BY’ types overlap in the GCVS, and for V405 And both classifications seem to be valid. In CI97 orbital elements and estimates of the masses around 0.2 and 0.5M⊙, and radii of 0.78 and 0.25–0.30R⊙ are given as well, which were used as starting point for our analysis.
2 Observations and data reduction
Photometric observations were carried out using the 1m RCC telescope of Konkoly Observatory at Piszkéstető Mountain Station equipped with a Princeton Instruments CCD and the 60cm telescope of Konkoly Observatory at Svábhegy, Budapest with a Wright Instruments CCD camera.
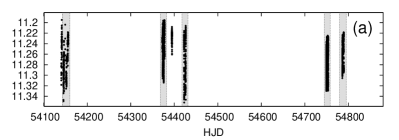
Observations were collected during 28 nights: 13 nights with the 60cm telescope (February 8 – October 1, 2007; 2454140–2454375 HJDs), and 18 nights with the RCC telescope (September 28, 2007 – November 18, 2008; 2454372–2454789 HJDs), on three nights both telescopes were used simultaneously.
After correcting for atmospheric extinction and transforming the data to standard photometric system, we matched the two data series by fine-tuning the telescope constants within their errors.
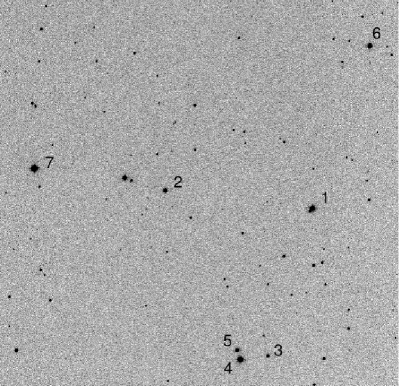
A finding chart is plotted on Fig. 1, V405 And is marked as Star 1 (using the numbering of CI97). Two of the comparison stars (Star 3, Star 6) used by CI97 turned out to be variable. Star 3 shows changes on a longer timescale of 20-30 days. Star 6, showing a period of , is possibly a W UMa type star. This effect would only cause small shifts, if any in CI97, since they used the average value of the five comparison stars.
In this work GSC 03298-00148 (Star 7) was used as a comparison star. Magnitudes of Star 7 were calculated using stars 2,3,4 and 5 separately and the results were compared. The differences were 0.03 magnitudes at maximum. According to the results, we chose finally Star 2 for defining the magnitudes of the comparison star.
As mentioned in CI97, there is a star near V405 And, at about 4.5 arc-seconds to the south-east, which is blended with the variable on most of the frames. We determined the magnitudes of the star near V405 And using frames taken on 2007 September 29, October 01 and October 02. IRAF111 IRAF is distributed by the National Optical Astronomy Observatory, which is operated by the Association of Universities for Research in Astronomy, Inc., under cooperative agreement with the National Science Foundation. PHOT routine of DAOPHOT package with small aperture, and NSTAR PSF-fitting routine were used. There was a systematic difference (order of 0.01 magnitudes) between aperture and PSF photometry (aperture photometry gave brighter magnitudes). Since the two stars are separated only by 12.6 pixels, V405 And extends into the aperture of the fainter star, so the result of the PSF photometry was accepted. The magnitudes of the faint star are , (15.1 in CI97), and in and passbands, respectively. To test the correctness of these values, we compared PSF-magnitudes of V405 And with magnitudes from aperture photometry. We set an aperture large enough to contain both V405 And and the faint star, then subtracted the intensity of the faint star from the result. These magnitudes from aperture photometry and PSF-photometry match reassuringly within a few hundredths of magnitude.
Differential aperture photometry of V405 And was done using DAOPHOT routine. The aperture was chosen to contain the faint star on all frames, since the two stars were not resolved on most frames. The intensities of this star were subtracted from the light curve after transforming to standard Johnson–Cousins photometric system. The resulting light curve is plotted in Fig. 2.


Interstellar extinction was checked for V405 And using NASA/IPAC Extragalactic Database (NED), giving a value of mag for total extinction. According to CI97, the distance of V405 And is 25–35 pc, so the effect of interstellar extinction would be only a few thousandth magnitude. This value is much smaller than the errors of the photometry (0.01–0.02mag), so it can be neglected.
Altogether 97 high-resolution spectra was retrieved from the ELODIE archive at Observatoire de Haute-Provence (OHP) (Moultaka et al. 2004). In 1994 38 spectra were observed: 27 between October 18–23, and 11 between December 12–16. Another 59 unpublished spectra were obtained between October 25–30, 1998. The spectra from the archive cover the wavelength range of 4000–6800Å with a resolution () of 42000.
3 Analysis
| Star No.∗ | ||||
|---|---|---|---|---|
| 1 (V405 And) | 11.25 | 1.36 | 0.94 | 1.86 |
| 11.10∗∗ | 1.44 | 0.89 | 1.74 | |
| 2 | 12.80 | 0.43 | 0.28 | 0.55 |
| 12.80 | 0.43 | 0.28 | 0.55 | |
| 3 | 13.60 | 0.43 | 0.28 | 0.57 |
| 13.60 | 0.41 | 0.28 | 0.54 | |
| 4 | 11.05 | 0.44 | 0.28 | 0.54 |
| 11.05 | 0.43 | 0.28 | 0.54 | |
| 5 | 12.99 | 0.89 | ||
| 12.96 | 0.94 | |||
| 6 | 11.67 | 0.68 | 0.45 | 0.83 |
| 11.65 | 0.72 | 0.42 | 0.79 | |
| 7 | 10.67 | 0.76 | 0.47 | 0.87 |
∗ The star numbers are the same as in CI97. Star 7 is not in the field of view in CI97.
∗∗ Values in italics are from CI97.
Results in Table 1 show that while the average magnitudes of our measurements agree quite well with those of CI97 in case of Stars 2 to 6, values for V405 And seem to differ significantly. V405 And was 0.15 magnitude fainter during our observations in band than in 1995. This, and the decrease of and indices indicate higher spottedness. In the same time, the bluer show the presence of more faculae. Thus, we conclude that the activity is enhanced compared to the 1995 level.
3.1 Spots: photometric modelling
For finding light curve solution we adopted the method described by Strassmeier et al. (2008). The method uses an iterative modelling for the binarity and spottedness separately. The binary model was computed using PHOEBE (Prša & Zwitter 2005) simultaneously for our four-colour measurements and the radial velocity curve from CI97. The binary model light curve is removed from the observed one using the following equation:
| (1) |
where is the flux of the primary changing due to spottedness, is the observed light curve, is the binary model constructed with PHOEBE, and is the unspotted flux of the system (for model parameters see Table 2). is a light curve which contains only the changes caused by the spottedness, and is free from the effects of binarity (eclipse and changes by the distorted shape of the stars). The true spotted light curve was modelled with SpotModeL (Ribárik et al. 2003), which uses the analytic approach with circular spots of Budding (1977). The circumpolar part of the spotted region accounts for the long-term, overall brightness change, whereas spotted parts outside this region cause the rotational modulation. The latitude of the spots is, at least partly, determined by the ratio of buoyancy and Coriolis-force. On fast rotating stars the Coriolis-force is dominant which moves the spots to high latitudes (Choudhuri & Gilman 1987). While spot models can determine spot longitudes quite reliably, photometric observations have very low information content on spot latitudes (see e.g. Kővári & Bartus 1997). Assuming circular spots on the surface is an approximation with small number of parameters. Sunspots and active nests on the Sun give examples of circular active regions. Note, that as ’spots’ we mean regions with dark spots and bright faculae, the (average) temperature of the region is made up from the cool and hot parts, relative to the photosphere.
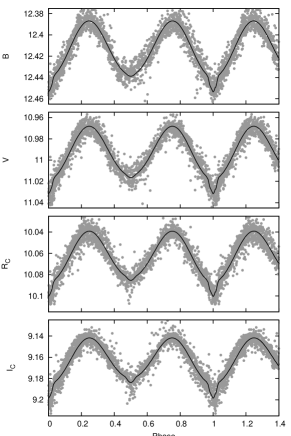
We assumed two spotted regions on V405 And with average 3300K on the high-latitude regions of the primary. Tests of Kővári & Bartus (1997) showed that analytic models using two circular spots describe the observed spotted light curves satisfactorily within the precision of the photometric observations. Spot temperature was chosen by modelling a light curve, and the result was accepted for all passbands. For finding the best fitting spotted light curve, the size and position of the spots were searched. During our observations the star was more than 0.1 magnitudes fainter due to higher spottedness than the faintest observed value in CI97, thus we used the brightest part of the and light curves of CI97 as the (faintest possible) unspotted and magnitudes. Unspotted and magnitudes were calculated from the color indices. The resulting spotted curve was then removed from the observed one, and these steps were repeated until we got a satisfactory fit for the spots and binarity (Fig. 3) separately, and for the observed light curve itself (Fig. 2b).
| = | ∗ | |
|---|---|---|
| a | = | 2.246 ∗∗ |
| = | ||
| = | ||
| = | ||
| = | ||
| = | K | |
| = | K | |
| = | ||
| = | ||
| = | 85 km/s∗ | |
| = |
| = | 12.42 | |
| = | 11.00 | |
| = | 10.07 | |
| = | 9.17 | |
| = | 3300K |
∗ adopted from CI97
∗∗ a adopted from CI97
Using this modelling method it is possible to determine the physical parameters of the binary (see Table 2). For initial values of surface temperatures we used the tables of Flower (1996) and VandenBerg & Clem (2003). The shape of the light curve is not very sensitive to the changes in the temperature, thus the fitting of these values is quite uncertain. Our result for the mass ratio is within from the value that was spectroscopically determined in CI97 ().
The spot configuration is relatively stable throughout the observations, positions and sizes of the spots change only slightly. According to the model, one spot is situated on the northern hemisphere, and another one on the southern hemisphere about 150∘ from each other in longitude. From the modelling results the longitudes of spots (i.e., phases) are accurate within a few degrees, but latitude results are just approximations. Using the supposed we find that about 25% of the stellar surface is covered with active regions. The stability of circular spot models are discussed in details in Kővári & Bartus (1997). With the help of this simple spot model we could satisfactorily separate the light variation originating from binarity and activity.
3.2 Hot regions in the chromosphere and photosphere


The chromospheric activity of V405 And was investigated using H line profiles. Equivalent widths (Fig. 4) were measured by fitting Gaussian profiles using SPLOT task in IRAF, after the continuum was fitted by polynomials and removed. The equivalent widths vary between 1–2Å showing a small rotational modulation. This variation seems to be fairly regular during the observations, except for the time of the flares in October 1994 and 1998 (see Section 3.3). The observed variation indicates permanent plage structure in the stellar atmosphere.
In September 29–30, 2007 an interesting phenomenon was observed (see light curves in Fig. 5). During two consecutive nights, at the beginning of the observations the binary showed excess brightness in all bandpasses which gradually decreased to the unspotted flux. After about one third rotation the brightening started again (the system configuration during the event is plotted on Fig. 6). The excess brightness was stronger during the second night (between the two sets of observations was one full rotation). The ratios of the peak intensities in filters at the beginning of the observations differ from that produced by a usual flare event at or near its peak intensity.
Assuming that the brightening is caused by hot regions on the star we can make a model of the surface using SpotModeL. Results show that two hot areas separated in longitude by 90–120∘ describe the observed changes well. Making use of two passbands, from and indices we get hot spot temperatures of K and K, respectively, which means these regions are at least 1000K hotter than the surrounding area. At maximum of the brightness yields 4300K for the temperature (Flower 1996), meaning that the whole visible stellar surface seemed hotter by 150 K, i.e.; about 10–12% of the visible surface of the star is covered with hot regions.
An explanation of the phenomenon could be a long-lasting (at least 1.5 days, or 3 rotations) flare event on V405 And. During the first night’s observations we see only the decreasing part of a giant flare that might have occurred during daytime, before the observations started. At the beginning of the second night we observe a peak which could then be a post-flare eruption. Two smaller eruptions happened later that night, the first was small, the second was more powerful and started to decrease still before the end of the night.
A similar long-lasting event has been observed on AU Mic. This event was described and modelled in Katsova et al. (1999). The authors, comparing their results with observed solar phenomena, supposed long-lasting giant post-flare loops with a size of 1–2 stellar radii, and energy balance through continuing reconnections.
Transequatorial magnetic loops are common features on the Sun. Harra et al. (2003) studied the energy mechanism of such a solar loop system and found brightenings and flare-like events during 2 days of observations. On V405 And from photometric observations we suggest 1-1 dominant active region in both hemispheres of the primary separated by 150∘ in longitude. We could explain the observed phenomenon on September 29–30, 2007 with a transequatiorial loop system which causes the brightenings and the flare-like events. As the star rotates, the emitting part of the loop system eventually turns in and out of view. This scenario would explain the turn-backs of the light curve seen, e.g., in band at 0.3 phase (Fig. 5), and also the intensity ratios in different filters, which are comparable to the post-flare event of Fig. 7.
3.3 Flares


10
11


12


During the observations, three noteworthy flare events happened. Two of them were observed with the ELODIE spectrograph: on October 18, 1994 and on October 29, 1998. The third one occurred on February 9, 2007, and was detected in photometric bandpasses.
3.3.1 Spectroscopic events
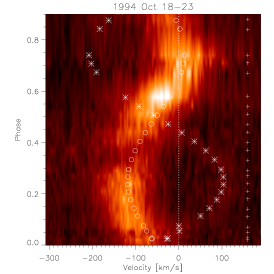
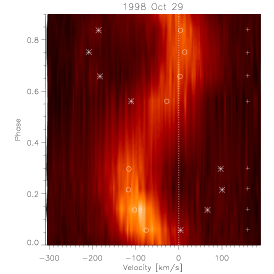
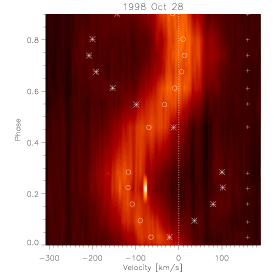
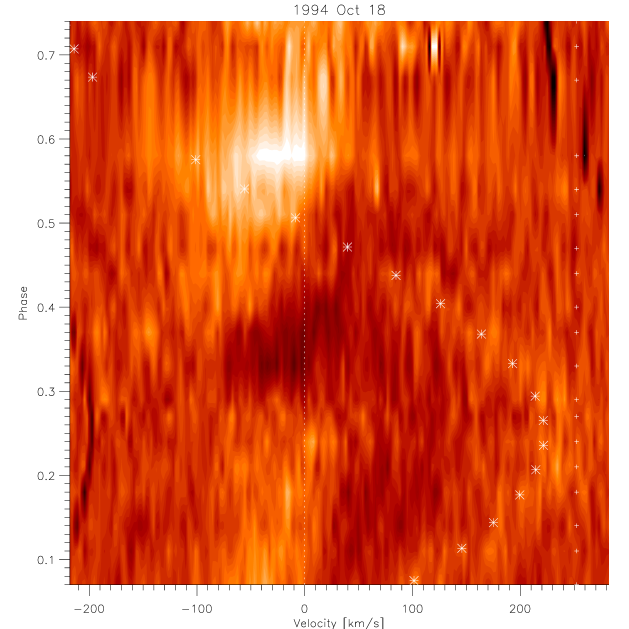
The 1994 flare was visible in H, H and He I D3 lines. During the flare, the H equivalent widths increased (see Fig. 4), indicating stronger activity in the chromosphere. On the dynamic spectrum (Fig. 8, left panel) as well as on the individual spectra (Fig.9, left panel) enhancement in the blue wing of the H line is observed since the beginning of the observations. The flare eruption started at phase 0.51, reached its maximum at phase 0.58 and lasted for more than 2.5 hours, at least until the end of the observations. At the time of the flare H is also increased, and asymmetry is seen in the red wing at all phases (Fig. 9 middle panel). As the indicator of the explosive event He I D3 appears as prominent emission line (Fig. 9, right panel) at phases 0.54–0.58. A very similar event is reported on LO Peg by Eibe et al. (1999).
The weaker flare from October 29, 1998 shows increased H emission, and the H level is also higher, but only a marginal He I D3 emission is seen (see Fig. 11 in the online version). This weaker flare was not accompanied by a (large) prominence, the H line is quite symmetric, except before and during the flare at phases 0.06–0.14 (Fig. 8, middle panel). The H line outside the small flare is the same as in the quiescent H state (Fig. 8, right panel). The H line is again increased in the red wing at all phases.
The increase of the blue wing of the H line is probably the signature of prominence formation, i.e. emerging material in the magnetic loop with an upflow of 40km s-1 (see Fig. 10 in the online version) which forms a prominence. After the flare the H line is again symmetric, since most of the material is heated up and leave the loops during the fast phase of the flare eruption. The red asymmetry of the H line could originate from the downflow of cooling material along the flux loops.
The H line of the secondary star is much better visible on the spectra made at the quiescent state of the binary (Fig. 12 in the online version), which is partly due to the better signal-to-noise ratio of these spectra, but also the less active primary at this time does not wash out the weaker signal of the secondary. During the observations of the quiescent phase, in the beginning, some red asymmetry is seen again in the H line, indicating that chromospheric flows are present on the star in most of the time.
3.3.2 Photometric flare
The light curve of the flare on February 2007 is plotted in Fig. 7. The system at the peak of the flare is 0.6 magnitudes brighter in than the quiescent light, and the flare is well seen also in filter, indicating a very strong outburst. The event could be observed for 3.72 hours, which is about one-third of the rotation. Using photometric data, unfortunately no details can be determined for the position of the flare. It is possible that the flare lasted longer than 4 hours, but the flaring region moved out of view because of the rotation. Since both components are active, the flare could occur in either of the two components.
Assuming that the whole light curve of the flare was observed, we can make an estimation of the flare energies. The energy emitted by the flare in and bands are 1.43e+35, 7.58e+34, 1.34e+35 and 1.31e+35 ergs, assuming that the flare occurred on the primary.
If we suppose that the flare occurred on the much fainter secondary, we need to know its magnitudes for calculating flare energy. According to CI97, the secondary component is at least 3 magnitudes fainter than the primary. If we assume solar metallicity of the system, and a mass of from our results for the secondary, using the tables of VandenBerg & Clem (2003), we get magnitudes as an upper limit of the secondary component’s brightness. Using these values and taking into account the uncertainties in stellar temperatures and radii (see Table 2) the resulting flare energies satisfactorily agree with the values above, that we determined supposing the flare occured on the primary. For the details of flare energy calculating, see e.g. Kővári et al. (2007).
After the peak of the flare, four smaller, post-flare eruptions were observed. These oscillations could be the result of reconnection between the moving footpoints of the expanding magnetic loop causing the flare and the intermittent magnetic field (see Kővári et al. 2007; Attrill et al. 2007) or individual additional flares. However, the quasiperiodicity of the events makes the first scenario more likely (cf. Mitra-Kraev et al. 2005).
4 Discussion

Our measurements show that V405 And is a very active RS CVn binary. Strong flare events were observed both in photometry and spectroscopy (see Section 3.3). Photometric data shows that the stellar surface is covered by large spotted regions, which are quite stable during a timescale of the observations (650 day), i.e., the maximum spot visibility (spotted light curve minima) is near the same phase. The eruption on September 30, 2007 happened at this position, and probably the one on September 29, 2007 near to that. The large flare on October 18, 1994 also appears at the same phase. These evidences point towards the presence of an active nest that has a very long lifetime, more than 10 years. The phase of the eruptive events is near to the secondary minimum, so the feature is probably locked to the binary orbit. Such long-lived active regions have been observed e.g. on WY Cnc by Kozhevnikova et al. (2007).
According to CI97, for V405 And is which fits well the rotation activity relations of James et al. (2000) and Pizzolato et al. (2003)
We compared the masses and radii of V405 And (Table 2) with the existing measured values of dwarf stars with masses below 0.8 M⊙ in Fig. 13. The theoretical curve for 5 Gyr from Baraffe et al. (1998) is also plotted using and . Note that at this part of the theoretical mass-radius diagram there is not much difference between isochrones belonging to different ages; low mass stars evolve slowly. It is well seen that stars less massive than 0.32M⊙, which is suggested as limit of full convection, fit well the isochrones. Among these low-mass stars are the secondary components of the binary from NGC 1647 and of V405 And. However, with increasing mass the correlation gets looser. In Fig. 13 there are three systems in which the masses of the components are very different: T-Lyr1-17236, the binary from NGC 1647 (Hebb et al. 2006) and V405 And. T-Lyr1-17236 rotates rather slowly with a period of , whereas the other two systems are very fast rotators (V405 And: , star from NGC 1647:). The radii of the primary components of the two fast rotating systems are well above the theoretically predicted radius values, especially V405 And is much larger than expected. On the other hand, both components of the slow rotator T-Lyr1-17236 fit rather well the isochrone.
Mullan & MacDonald (2001) found that the radii of low-mass M dwarfs, concerning stellar structure codes, are larger than expected, and that could be due to their strong magnetic fields, which may push the mass limit of full convection towards lower masses. Ribas (2006) compared theory with observation on masses and radii of low-mass stars (both binaries and single stars). From the high precision results of double lined eclipsing binaries he found that theory predicts smaller radii by about 10% (or higher temperatures by about 5%) for stars in the mass range between 0.4–0.8M⊙. Finally, Chabrier et al. (2007) carried out evolutionary calculations on low-mass stars taking into account magnetic activity, and demonstrated that magnetic fields alter the evolution, and that the spot coverage yields larger radii and smaller effective temperature. However, the radius of the primary component of V405 And is even larger comparing to the results of Chabrier et al. (2007). Future modellings with magnetic fields are necessary to map the area of M dwarfs in the mass-radius plane. An interesting question is, what would be the effect of the magnetic interaction between a very active, fully convective star with its close, also active component in a binary system, so that the radius of the more massive component becomes even larger than the recent theory predicts, while at the same time the radius of the fully convective star agrees with the prediction.
At present only two systems are known whose primaries are about 2.5 times more massive than the secondaries, and that one component is above while the other is below the limit of the full convection. The primary of V405 And deviates most from the expected radius of its mass from the known sample. On the other hand, the secondary of V405 And would be fully convective even in the presence of its strong magnetic field according to the calculations of Mullan & MacDonald (2001, Fig. 1). It would be a challenge to model evolution of such binaries whose components are on the two sides of the mass limit of full convection. Of the two known examples, V405 And is the one with its 11 mag. brightness which is well observable showing all the signatures of strong magnetic activity like spots and flares. We recommend this binary to the attention of future investigators.
Acknowledgements.
Our sincere thanks are due to A. Prša for his suggestions in binary modelling. An anonymous referee helped to improve the paper considerably. The financial support of OTKA grant T-068626 is acknowledged. ZsK is a grantee of the Bolyai János Scholarship of the Hungarian Academy of Sciences. This research has made use of the NASA/IPAC Extragalactic Database (NED) which is operated by the Jet Propulsion Laboratory, California Institute of Technology, under contract with the National Aeronautics and Space Administration.References
- Attrill et al. (2007) Attrill, G. D. R., Harra, L. K., van Driel-Gesztelyi, L., & Démoulin, P. 2007, ApJ, 656, L101
- Baraffe et al. (1998) Baraffe, I., Chabrier, G., Allard, F., & Hauschildt, P. H. 1998, A&A, 337, 403
- Becker et al. (2008) Becker, A. C., Agol, E., Silvestri, N. M., et al. 2008, MNRAS, 386, 416
- Blake et al. (2008) Blake, C. H., Torres, G., Bloom, J. S., & Gaudi, B. S. 2008, ApJ, 684, 635
- Budding (1977) Budding, E. 1977, Ap&SS, 48, 207
- Chabrier et al. (2007) Chabrier, G., Gallardo, J., & Baraffe, I. 2007, A&A, 472, L17
- Chevalier & Ilovaisky (1997) Chevalier, C. & Ilovaisky, S. A. 1997, A&A, 326, 228
- Choudhuri & Gilman (1987) Choudhuri, A. R. & Gilman, P. A. 1987, ApJ, 316, 788
- Devor et al. (2008) Devor, J., Charbonneau, D., Torres, G., et al. 2008, ApJ, 687, 1253
- Eibe et al. (1999) Eibe, M. T., Byrne, P. B., Jeffries, R. D., & Gunn, A. G. 1999, A&A, 341, 527
- Flower (1996) Flower, P. J. 1996, ApJ, 469, 355
- Harra et al. (2003) Harra, L. K., Matthews, S. A., & van Driel-Gesztelyi, L. 2003, ApJ, 598, L59
- Hebb et al. (2006) Hebb, L., Wyse, R. F. G., Gilmore, G., & Holtzman, J. 2006, AJ, 131, 555
- James et al. (2000) James, D. J., Jardine, M. M., Jeffries, R. D., et al. 2000, MNRAS, 318, 1217
- Katsova et al. (1999) Katsova, M. M., Drake, J. J., & Livshits, M. A. 1999, ApJ, 510, 986
- Kazarovets et al. (2000) Kazarovets, E. V., Samus, N. N., & Durlevich, O. V. 2000, Information Bulletin on Variable Stars, 4870, 1
- Kővári & Bartus (1997) Kővári, Z. & Bartus, J. 1997, A&A, 323, 801
- Kővári et al. (2007) Kővári, Z., Vilardell, F., Ribas, I., et al. 2007, Astronomische Nachrichten, 328, 904
- Kozhevnikova et al. (2007) Kozhevnikova, A. V., Alekseev, I. Y., Heckert, P. A., & Kozhevnikov, V. P. 2007, Astronomy Reports, 51, 932
- López-Morales (2007) López-Morales, M. 2007, ApJ, 660, 732
- López-Morales et al. (2006) López-Morales, M., Orosz, J. A., Shaw, J. S., et al. 2006, ArXiv Astrophysics e-prints
- Mitra-Kraev et al. (2005) Mitra-Kraev, U., Harra, L. K., Williams, D. R., & Kraev, E. 2005, A&A, 436, 1041
- Moultaka et al. (2004) Moultaka, J., Ilovaisky, S. A., Prugniel, P., & Soubiran, C. 2004, PASP, 116, 693
- Mullan & MacDonald (2001) Mullan, D. J. & MacDonald, J. 2001, ApJ, 559, 353
- Pizzolato et al. (2003) Pizzolato, N., Maggio, A., Micela, G., Sciortino, S., & Ventura, P. 2003, A&A, 397, 147
- Prša & Zwitter (2005) Prša, A. & Zwitter, T. 2005, ApJ, 628, 426
- Ribárik et al. (2003) Ribárik, G., Oláh, K., & Strassmeier, K. G. 2003, Astronomische Nachrichten, 324, 202
- Ribas (2006) Ribas, I. 2006, Ap&SS, 304, 89
- Samus et al. (2009) Samus, N. N., Durlevich, O. V., & et al. 2009, VizieR Online Data Catalog, 1, 2025
- Strassmeier et al. (2008) Strassmeier, K. G., Bartus, J., Fekel, F. C., & Henry, G. W. 2008, A&A, 485, 233
- VandenBerg & Clem (2003) VandenBerg, D. A. & Clem, J. L. 2003, AJ, 126, 778
- Voges et al. (1996) Voges, W., Gruber, R., Haberl, F., et al. 1996, VizieR Online Data Catalog, 9011, 0