The MAGIC highlights of the gamma ray binary LS I +61 303
Abstract
The discovery of emission of TeV gamma rays from X-ray binaries has triggered an intense effort to better understand the particle acceleration, absorption, and emission mechanisms in compact binary systems. Here we present the pioneering effort of the MAGIC collaboration to understand the very high energy emission of the prototype system LS I +61 303. We report on the variable nature of the emission from LS I +61 303 and show that this emission is indeed periodic. The system shows regular outburst at TeV energies in phase and detect no signal at periastron (). Furthermore we find no indication of spectral variation along the orbit of the compact object and the spectral energy distribution is compatible with a simple power law with index . To answer some of the open questions concerning the emission process of the TeV radiation we conducted a multiwavelength campaign with the MAGIC telescope, XMM-Newton, and Swift in September 2007. We detect a simultaneous outburst at X-ray and TeV energies, with the peak at phase 0.62 and a similar shape at both wavelengths. A linear fit to the strictly simultaneous X-ray/TeV flux pairs provides . Here we present the observations and discuss the implications of the obtained results to the emission processes in the system.
gamma rays: observations — gamma rays: individual (LS I +61 303) — gamma rays: binaries
1 Introduction
LS I +61 303 is a high mass X-ray binary system located at
2.00.2 kpc from us [1]. The system
contains a rapidly rotating early type B0 Ve star with a stable
equatorial decretion disk and mass loss, and a compact object with
a mass between 1 and 4 M⊙ orbiting it every 26.5 d
(see [2],
[3],
[4], and references
therein). Although LS I +61 303 has been classified as a microquasar
[5], VLBA
images obtained during a full orbital cycle show an elongated
morphology that rotates as a function of the orbital phase
[6]. Later VLBA images show repeating
morphologies at the same orbital phases, suggesting that the
milliarcsecond morphology depends only on the orbital phase
[7]. This may be consistent with a model
based on the interaction between the relativistic wind of a young
non-accreting pulsar and the wind/decretion disk of the stellar
companion [8]
LS I +61 303 shows periodic non-thermal radio outbursts on average every
=26.49600.0028 d, with the peak of the radio
emission shifting between phase 0.45 and 0.95, using
=JD 2,443,366.775, in a superorbital period of 16678 d
[9]. According to the
most precise orbital parameters periastron takes place at phase
0.275 and the eccentricity of the orbit is
[4].
LS I +61 303 has been observed several times in the X-ray domain (see
[10] and references therein). It generally
displays
X-ray outbursts, between orbital phase 0.4 and 0.8.
At very high energy (VHE) gamma rays LS I +61 303 has been extensively
studied by MAGIC [11, 12] and
VERITAS [13]. The lack of a systematic
behavior from cycle to cycle at X-ray energies, and the occurrence
of short-term variability, prevents to establish a X-ray/TeV
correlation from the comparison of non-simultaneous data [14].
Here we report about the highlights of the MAGIC VHE gamma ray
observation and present our strictly simultaneous TeV and X-ray
observations of LS I +61 303.
2 VHE Gamma Ray observations and data analysis
The MAGIC telescope located on the Canary Island of La Palma (N, W, 2225 m a.s.l.). Its essential parameters are a 17 m diameter segmented mirror of parabolic shape, an of 1.05 and an hexagonally shaped camera of 576 hemispherical photo multiplier tubes with a field of view of diameter. MAGIC can detect gamma rays from 60 GeV to several TeV. Its energy resolution is % above energies of 200 GeV. The current sensitivity is 1.6% of the Crab Nebula flux for a detection in 50 h of observation time. The improvement compared to previous sensitivity was achieved by installing new 2 GHz FADCs [15].
The data analysis was carried out using the standard MAGIC analysis and reconstruction software [16] and is in detail described in [11, 12, 17].
The TeV observations were performed in three distinct observational campaigns (OC hereafter). OC I, which lead to the discovery of LS I +61 303 as a -ray emitter, was performed from September 2005 to March 2006 and covered 6 orbital periods of LS I +61 303 with a total effective observation time of 54 h. OC II covered only 4 orbital periods but with a much denser sampling compared to OC I and resulted in an effective observation time of 112 h taken in September 2006 to December 2006. Finally OC III data were taken from 4th - 21st September 2007 with an effective observation time of 54 h. The range of zenith angles for all observations was , although most of the data had zenith angle below . More details about these observations can be found in [11, 12, 17].
3 The VHE gamma ray temporal behavior
The light curve in OC I and OC II is derived above and for OC III above due to the
improved sensitivity.
The most pronounced feature in the light curve is the high flux
level in the phase range 0.6-0.7. In this phase range is
almost every time the
highest flux (during one orbital cycle) measured.
Since the real value of the periastron passage is yet debated the
averaged flux value between the phase bin 0.2–0.3 can be used as
an upper limit to the emission at periastron. Thus the flux must
be less than at the confidence level.
Additional significant fluxes are measured during phase 0.5-0.6 in
OC II and OC I. In OC II and in OC III additional high fluxes are
evident in the phase range 0.8-1.0. In OC II only a single
significant measurement occurs at , while the emission
spreads over more nights in OC III yielding an averaged
significant () signal in the phase range 0.8-1.0 at
the level of cm-2 s-1. This
flux level is compatible with the 2- upper limit we obtain
for the OC II [12]. The higher
sensitivity both due to improved hardware and longer observation
times can sufficiently
explain the non detection in OC II.
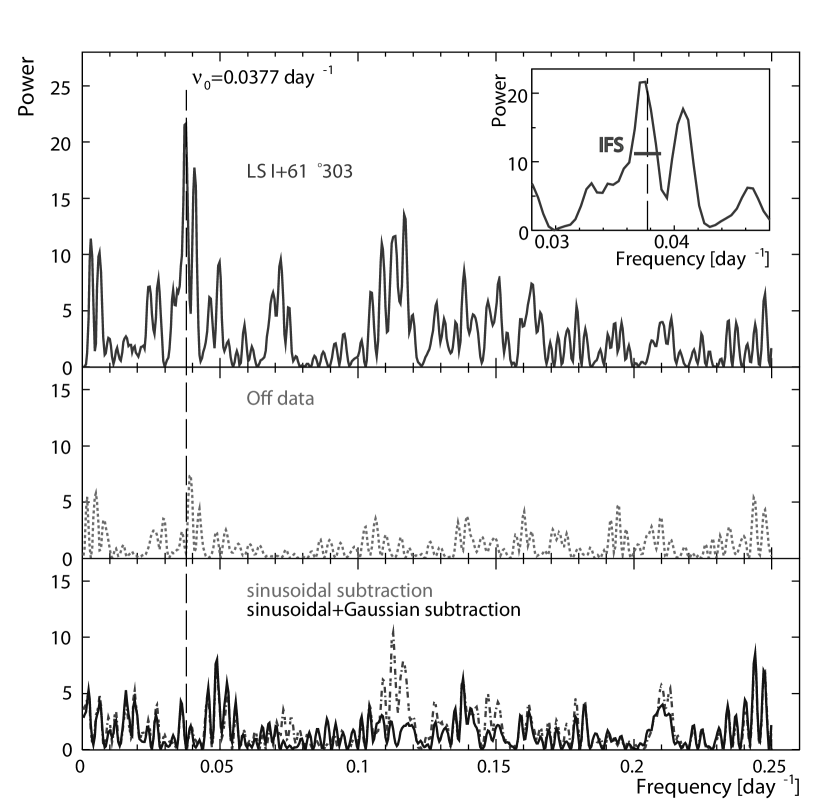
We performed a test for periodicity applying the Lomb-Scargle [18] method. The data from OC I and OC II
are used and the light curve is binned in intervals of to assure that each measurement has the same
error and thus can be treated equal. To evaluate the complementary
cumulative probability function we performed a monte carlo
simulation by generating random generated light curves
(from gaussian white noise) with the same sampling as the LS I +61 303 data. For each of the light curves the Lomb-Scargle periodogram
is calculated and from the maximum peak distribution of all
periodograms the complementary cumulative probability density
function (cCPF) is computed. The periodogram obtained from the
LS I +61 303 light curve is shown together with the background event
periodogram in Fig.1. A highly significant peak is
found at a period of with a false alarm
probability of in very good agreement with the
orbital period of the system. Our test proves that the VHE
emission from LS I +61 303 is periodic modulated with the orbital period.
A very detailed description of our periodicity analysis and the
treatment of possible systematic effects of the method can be
found in [12].
4 The VHE spectral behavior
The flux measured from LS I +61 303 in individual nights is usually not high enough to obtain significant spectra. The only exception is the main emission peak in phase 0.6-0.7. We obtained several spectra for individual phase bins in each OC. All spectral energy distributions are compatible with simple power laws. Within the errors all obtained fit parameters are compatible with each other and with the most significant measured spectrum . So no significant spectral variation could be found. We investigated the less significant flux measurements by calculating a hardness ration (), which we define as the ratio of the integral flux between 400 GeV and 900 GeV and above 900 GeV. We do not find any correlation between the and the flux level.
5 Multiwavelength campaign
Multiwavelength observations during OC II (see [7]) yielded no correlation between the radio and the TeV emission of LS I +61 303. Hints of correlated X-ray/TeV emission have been found based on non-simultaneous data taken more than six hours [12] and one day apart in these observations. Here we report only on the strictly simultaneous data taken in 2007.
5.1 X Ray observations
We observed LS I +61 303 with XMM-Newton during seven runs from 2007 September
4 to 11, amounting to a total observation time of 104.3 ks. The
data were processed using the version 8.0.0 of the XMM-Newton Science
Analysis Software (SAS). Known hot or flickering pixels were
removed using the standard SAS tasks. Further cleaning to remove
from the dataset periods of high background reduced the net total
good exposure times to 67.0 and
92.6 ks for the pn and MOS detectors, respectively.
Source spectra were extracted from a radius circle
centered on the source (PSF of ) while background spectra
were taken from a number of source-free circles with
radius. The extracted spectra were analyzed with XSpec v12.3.1
[19]. An absorbed power-law function
yielded satisfactory fits for all
observations. Unabsorbed fluxes in the
0.3–10 keV range were computed from the spectral fits.
Additional observations of 2–5 ks each (total 28.5 ks) were
obtained with the Swift/XRT from 2007 September 11 to 22. The
total observation time was 28.5 ks. The Swift data were
processed using the FTOOLS task xrtpipeline. The spectral
analysis procedures were the same as those used for the XMM-Newton data, but fixing the hydrogen column density to
cm-2, a typical value for LS I +61 303 also found
in the XMM-Newton fits.
To look for short-term X-ray variability we also extracted
0.3–10 keV background-subtracted lightcurves for each
observation. In addition we computed hardness ratios as the
fraction between the count rates above and below 2 keV. More
information about the X-ray analysis can be found
in [17].
5.2 X-ray results & X-ray/TeV Correlation
There is no significant hardness ratio change within each of our observations. Thus the unabsorbed flux obtained from the spectral fit is a good estimate of the unabsorbed flux during the observation. Still moderate () count-rate variability is present in most observations. We converted this count-rate variability into flux variability and added this flux variability (as an estimate of additional flux uncertainty) in quadrature to the spectral fits flux errors. This procedure provides more realistic total flux uncertainties.
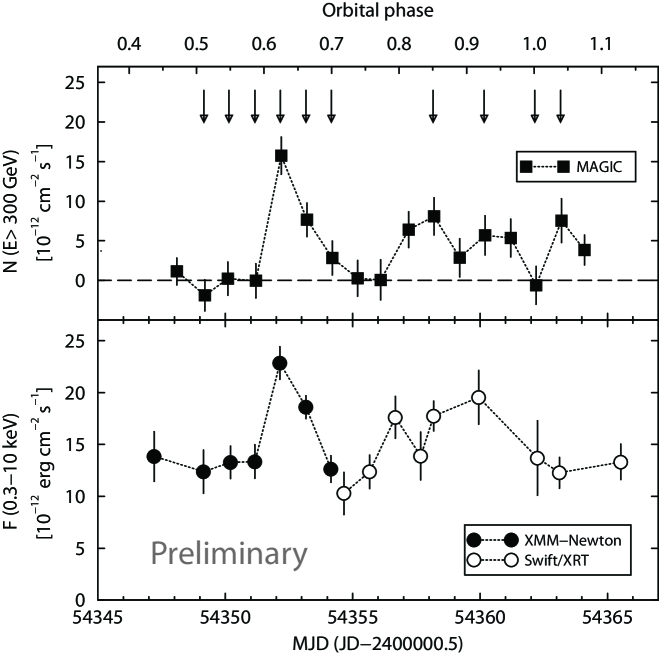
We show in Fig. 2-bottom the 0.3–10 keV lightcurve of LS I +61 303 together with the VHE lightcurve obtained with MAGIC.
A clear correlation between the X-ray and TeV emissions is
observed with a simultaneous peak at phase 0.62 (see
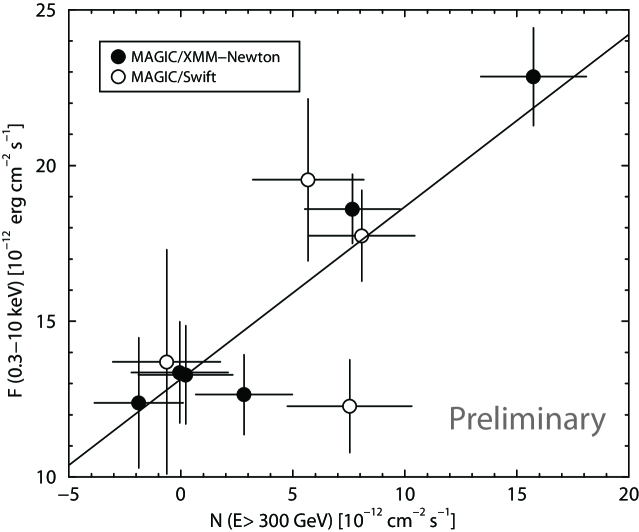
Fig. 2). We plot in Fig. 3 the X-ray
fluxes against the TeV fluxes for strictly simultaneous taken
data, amounting to 10 data points (marked with arrows in
Fig. 2). A linear fit to the six MAGIC/XMM-Newton pairs that
trace the outburst yields a correlation coefficient of . A
linear fit to all ten simultaneous pairs provides a high
correlation coefficient of (which has a
probability of about to be produced from
independent X-ray and TeV fluxes).
Contemporaneous radio data obtained with RATAN, VLBA and H spectroscopy, are consistent with previous result (details will be reported elsewhere). Therefore, the X-ray/TeV correlation occurred when the source was showing a standard behavior in both its outflow (radio) and decretion disk (H line).
6 Conclusion
We find that LS I +61 303 is a periodic -ray binary with an
orbital period of 26.80.2 days (chance probability ), compatible with the optical, radio and X-ray period.
This result implies that the flux modulation is tied to the
orbital period.
We produce energy spectra for several phase bins and the spectral
photon index does not show a significant dependence on the orbital
phase.
We put constraints to the emission at the periastron passage and
conclude that the system is detected in -rays only in the
phases . Since significant emission is only detected in
an orbital sector off the phases at which the maximum gamma ray
flux should occur under photon-photon absorption, the latter can
hardly be the only source of variability in the emission.
In addition we have discovered an X-ray/TeV correlation in LS I +61 303 based on simultaneous multiwavelength data obtained with MAGIC, XMM-Newton, and Swift. The quoted X-ray fluxes are already unabsorbed and the TeV spectra show no absorption indication nor is significant absorption predicted for the explored phase range. Therefore, the X-ray/TeV correlation we have found for LS I +61 303 indicates that the emission processes at both wavelengths occur at the same time and are probably the result of a single physical mechanism.
Since the VHE flux is about a factor of 2 lower than the X-ray flux measured the X-ray/TeV correlation favor leptonic models if the radiation mechanisms are dominated by a single particle population. In addition, the IC cooling channel is less efficient than the synchrotron channel to produce the detected X-ray emission for reasonable values of the magnetic field. This suggests that the X-rays are the result of synchrotron radiation of the same VHE electrons that produce TeV emission as a result of inverse Compton scattering of optical/ultraviolet stellar photons.
acknowledgments
We thank N. Gehrels for his help in arranging the Swift observations. We would like to thank the Instituto de Astrofisica de Canarias for the excellent working conditions at the Observatorio del Roque de los Muchachos in La Palma. The support of the German BMBF and MPG, the Italian INFN and Spanish MICINN is gratefully acknowledged. This work was also supported by ETH Research Grant TH 34/043, by the Polish MNiSzW Grant N N203 390834, and by the YIP of the Helmholtz Gemeinschaft.
References
- [1] D. A. Frail and R. M. Hjellming, “Distance and total column density to the periodic radio star LSI + 61∘ 303,” The Astrophysical Journal, vol. 101, pp. 2126–2130, Jun. 1991.
- [2] J. Casares et al., “Orbital parameters of the microquasar lsi +61 303,” Mon. Not. Roy. Astron. Soc., vol. 360, pp. 1091–1104, 2005.
- [3] E. D. Grundstrom et al., “Joint H and X-Ray Observations of Massive X-Ray Binaries. II. The Be X-Ray Binary and Microquasar LS I +61 303,” The Astrophysical Journal, vol. 656, pp. 437–443, Feb. 2007.
- [4] C. Aragona et al., “Optical Spectroscopy of Gamma-ray Binaries,” in American Astronomical Society Meeting Abstracts, ser. American Astronomical Society Meeting Abstracts, vol. 213, Jan. 2009, pp. 410.08–+.
- [5] M. Massi et al., “Hints for a fast precessing relativistic radio jet in LS I +61∘303,” Astronomy & Astrophysics, vol. 414, pp. L1–L4, Jan. 2004.
- [6] V. Dhawan, A. Mioduszewski, and M. Rupen, “LS I +61 303 is a Be-Pulsar binary, not a Microquasar,” in Proceedings of the VI Microquasar Workshop: Microquasars and Beyond. September 18-22, 2006, Como, Italy., p.52.1, 2006.
- [7] J. Albert et al., “Multiwavelength (Radio, X-Ray, and -Ray) Observations of the -Ray Binary LS I +61 303,” The Astrophysical Journal, vol. 684, pp. 1351–1358, Sep. 2008.
- [8] G. Dubus, “Gamma-ray absorption in massive X-ray binaries,” Astronomy & Astrophysics, vol. 451, pp. 9–18, May 2006.
- [9] P. C. Gregory, “Bayesian Analysis of Radio Observations of the Be X-Ray Binary LS I +61∘303,” The Astrophysical Journal, vol. 575, pp. 427–434, Aug. 2002.
- [10] A. Smith et al., “Long-Term X-Ray Monitoring of the TeV Binary LS I +61 303 With the Rossi X-Ray Timing Explorer,” The Astrophysical Journal, vol. 693, pp. 1621–1627, Mar. 2009.
- [11] J. Albert et al., “Variable very high energy gamma-ray emission from the microquasar LS I +61 303,” Science, vol. 312, pp. 1771–1773, 2006.
- [12] J. Albert et al., “Periodic Very High Energy -Ray Emission from LS I +61∘ 303 Observed with the MAGIC Telescope,” The Astrophysical Journal, vol. 693, pp. 303–310, Mar. 2009.
- [13] V. A. Acciari et al., “VERITAS Observations of the -Ray Binary LS I +61 303,” The Astrophysical Journal, vol. 679, pp. 1427–1432, Jun. 2008.
- [14] V. A. Acciari et al., “Multiwavelength Observations of LS I +61 303 with VERITAS, Swift and RXTE,” ArXiv e-prints, Apr. 2009.
- [15] E. Aliu et al., “Improving the performance of the single-dish Cherenkov telescope MAGIC through the use of signal timing,” Astroparticle Physics, vol. 30, pp. 293–305, Jan. 2009.
- [16] J. Albert et al., “VHE -Ray Observation of the Crab Nebula and its Pulsar with the MAGIC Telescope,” The Astrophysical Journal, vol. 674, pp. 1037–1055, Feb. 2008.
- [17] ——, “in preparation.”
- [18] J. D. Scargle, “Studies in astronomical time series analysis. II - Statistical aspects of spectral analysis of unevenly spaced data,” The Astrophysical Journal, vol. 263, pp. 835–853, Dec. 1982.
- [19] K. A. Arnaud, “XSPEC: The First Ten Years,” in Astronomical Data Analysis Software and Systems V, ser. Astronomical Society of the Pacific Conference Series, G. H. Jacoby and J. Barnes, Eds., vol. 101, 1996, pp. 17–+.