Modelling the Spoon IRS diagnostic diagram
Abstract
We explore whether our models for starbursts, quiescent star-forming galaxies and for AGN dust tori are able to model the full range of IRS spectra measured with Spitzer. The diagnostic plot of 9.7 m silicate optical depth versus 6.2 m PAH equivalent width, introduced by Spoon and coworkers in 2007, gives a good indication of the age and optical depth of a starburst, and of the contribution of an AGN dust torus. However there is aliasing between age and optical depth at later times in the evolution of a starburst, and between age and the presence of an AGN dust torus.
Modeling the full IRS spectra and using broad-band 25-850 m fluxes can help to resolve these aliases. The observed spectral energy distributions require starbursts of a range of ages with initial dust optical depth ranging from 50-200, optically thin dust emission (’cirrus’) illuminated by a range of surface brightnesses of the interstellar radiation field, and AGN dust tori with a range of viewing angles.
keywords:
infrared: galaxies - galaxies: evolution - star:formation - galaxies: starburst - cosmology: observations1 Introduction
The wealth of mid and far infrared spectroscopy of galaxies from ISO and Spitzer have provided a challenge for models of their spectral energy distributions (SEDs), which has been tackled by several groups. Over the past twenty years we have developed increasingly sophisticated radiative transfer models for different types of infrared galaxy, for example for starburst galaxies (Rowan-Robinson & Crawford 1989, Rowan-Robinson & Efstathiou 1993, Efstathiou et al 2000), AGN dust tori (Rowan-Robinson & Crawford 1989, Efstathiou & Rowan-Robinson 1995, Rowan-Robinson 1995), and quiescent (’cirrus’) galaxies (Rowan-Robinson 1992, Efstathiou &Rowan-Robinson 2003, Efstathiou & Siebenmorgen 2009). Each of these model types involves at least two significant model parameters so there are a great wealth of possible models, particularly as a galaxy SED may be a mixture of all three types. Starburst models have also been developed by Silva et al. (1998), Takagi et al. (2003), Dopita et al. (2005), Siebenmorgen & Krugel (2007). Other work on radiative transfer modeling of the torus in AGN has been presented by Pier & Krolik (1992), Granato & Danese (1994), Nenkova et al. (2002, 2008), Dullemond & van Bemmel (2005), Hönig et al. (2006) and Schartmann et al. (2008). Other work on radiative transfer modeling of cirrus galaxies has been presented by Silva et al (1998), Dale et al (2001) and Piovan et al (2006).
Often, however, we have only limited broad-band data available and in this situation it is more illuminating to use a small number of infrared templates to match the observed infrared colours (eg Rowan-Robinson and Crawford 1989, Rowan-Robinson 1992, 2001, Rowan-Robinson and Efstathiou 1993, Rowan-Robinson et al 2004, 2005, 2008). These templates have proved remarkably successful in matching observed Spitzer SEDs, including cases where IRS data are available (Rowan-Robinson et al 2006, Farrah et al 2008, Hernan-Caballero et al 2009).
Spoon et al (2007) have published a very interesting diagnostic diagram for starburst and active galaxies, which plots the strength of the silicate 9.7 feature against the equivalent width (EW) of the 6.2 m PAH feature for 180 galaxies with Spitzer IRS spectra. In this paper we explore how well our models fit the distribution of galaxies in this diagram.
2 Description of the models
2.1 AGN torus models
The most important constraint on early models for the torus in AGN (Pier & Krolik 1992, Granato & Danese 1994, Efstathiou & Rowan-Robinson 1995) was provided by mid-infrared spectroscopic observations from the ground in the window by Roche, Aitken and collaborators (Roche et al 1991). The observations showed moderate absorption features in type 2 AGN and featureless spectra in type 1 AGN. By comparison the flared discs (whose thickness increases linearly with distance from the central source) of Efstathiou & Rowan-Robinson (1990, 1995) and Granato & Danese (1994) showed strong silicate emission features when observed face-on. The cylindrical geometry and high optical depth of the Pier & Krolik models eliminated the emission features but the overall spectra were rather narrow. Granato & Danese suggested that the silicate grains are destroyed by shocks in the inner part of the torus. Efstathiou & Rowan-Robinson proposed that tapered discs (whose thickness increases with distance from the central source in the inner part of the disc but tapers off to a constant value in the outer disc) with a density distribution that followed could give flat spectra in the mid-infrared for an opening angle of around and an equatorial optical depth at 1000 of 1000. Models with a smaller opening angle predicted face-on spectra with shallow silicate absorption features whereas models with a larger opening angle showed weak emission features. Recent Spitzer observations showed weak emission features in quasars and weak absorption features in Seyfert 1 galaxies (e.g. Hao et al 2005, 2007, Siebenmorgen et al 2005, Spoon et al 2007). The tapered discs of Efstathiou & Rowan-Robinson, in combination with the starburst models of Efstathiou, Rowan-Robinson & Siebenmorgen (2000), which are described below, have been very successful in fitting the spectral energy distributions of a number of AGN (e.g. Alexander et al 1999, Ruiz et al 2001, Farrah et al 2003, Efstathiou & Siebenmorgen 2005) More recently there has been interest in clumpy torus models (Nenkova et al 2002, 2008, Dullemond & van Bemmel 2005, Hönig et al 2006) which as suggested by Rowan-Robinson (1995) also display weaker silicate features.
In this paper we will use the tapered disc models of Efstathiou & Rowan-Robinson (1995). The models assume that the dust is smoothly distributed in the disc. However, this distribution may be considered a reasonable approximation to a clumpy dust distribution if the mean distance between clouds is comparable to their size. For this paper we have explored a model in which we fix the equatorial 1000 optical depth at 1000, the opening angle of the torus at 600, and the ratio of inner to outer cloud radii () at 0.01. The opening angle as discussed above controls the behaviour of the silicate feature in the face-on case. The ratio of inner to outer disc radii controls the width of the spectral energy distribution but also the silicate feature strength because, for the same equatorial optical depth, a more extended disc is more optically thin in lines of sight perpendicular to the plane of the disc than a more compact disc. The reason for choosing this particular model is that it gives the strongest silicate emission feature when the torus is viewed face-on and can therefore match the silicate strength of the quasars in the sample. The spectral energy distribution of the torus is computed for 74 inclinations which are equally spaced in the interval 0 to 90o.
2.2 Starburst models
Efstathiou, Rowan-Robinson & Siebenmorgen (2000; hereafter ERRS00) developed a starburst model that has three main features. The first feature of the model is that it incorporates the stellar population synthesis model of Bruzual & Charlot (1993) that gives the spectrum of the stars as a function of their age. We use the table that assumes a Salpeter IMF and stellar masses in the range 0.1-125 . The second important feature of the model is that we carry out detailed radiative transfer that takes into account multiple scattering from grains and incorporates a dust model that includes small transiently heated grains and PAH molecules as well as large classical grains. The calculation of the emission of the small grains and PAHs is according to the method of Siebenmorgen & Krügel (1992). The third feature of the model is that it incorporates a simple model for the evolution of the giant molecular clouds that constitute the starburst once a stellar cluster forms instantaneously at the center of the cloud. The most important characteristic of this evolutionary scheme is that by about 10 Myrs after star formation, the expansion of the HII region leads to the formation of a cold narrow shell of gas and dust. This naturally explains why the mid-infrared spectra of starburst galaxies are dominated by the PAH emission and not by the emission of hot dust. The predicted spectra of the molecular clouds therefore shift to longer wavelengths with age and show stronger PAH equivalent widths. Another effect of ageing is that the clouds get more otically thin and therefore the silicate features get shallower. The sequence of molecular clouds at different ages can be convolved with a star formation history to give the spectrum of a starburst at different ages.
ERRS00 showed that the IRAS colours of starburst galaxies can be modeled with starbursts whose star formation rate decays exponentially with an e-folding time of 20Myrs. The choice of the other model parameters assumed by ERRS00 (average density , star formation efficiency and giant molecular cloud mass ), was discussed by ERRS00 (section 3) and was found to be in agreement with other indicators for the starburst galaxy M82. This choice of parameters gave rise to an initial optical depth of the molecular clouds in the V band of 50. Rowan-Robinson & Efstathiou (1993) showed that ultraluminous infrared galaxies such as Arp220 are up to a factor of four more optically thick than starbursts like M82 and NGC1068. Rather than computing a four-parameter grid of models, which would be impractical, we fixed at 20Myrs and varied , and to give four discrete values of (50, 100, 150 and 200) that span the range suggested by observations. In other words we treat as an effective free parameter of the model. The spectra are computed for 11 different ages ranging from 0 to 72Myrs. This sequence of models, in combination with the AGN torus models discussed above, has been shown by Farrah et al (2003) to be in good agreement with the spectral energy distributions of 41 ultraluminous infrared galaxies.
2.3 Cirrus models
Efstathiou & Rowan-Robinson (2003; hereafter ERR03) presented an extension of the ERRS00 model that allowed the calculation of cirrus models as well as a combination of starburst and cirrus. This model is much simpler than the GRASIL model developed by Silva et al (1998) or the model of Piovan et al (2006) but as it has been shown by ERRO3 the calculated spectra are in good agreement with the spectral energy distributions of local galaxies dominated by cirrus. The first step in this model involves the specification of the spectrum of starlight for which we have two options. We either use the Bruzual & Charlot table and an assumed star formation history or we use the spectrum of the interstellar radiation field in the solar neighbourhood (ISRF; Mathis et al 1983). In the first option we assume (as in the case of the starburst model) that the star formation rate declines exponentially with an e-folding time . For the emission of stars that formed in the last years we use the spectrum computed by the starburst code. We then scale the spectrum of starlight by varying the parameter which is the ratio of the bolometric intensity of starlight to the bolometric intensity of the local ISRF. Finally we illuminate the dust with the starlight and calculate its infrared spectrum. The code also provides the option to attenuate the starlight, by assuming a visual extinction , and calculate the spectrum from the UV to the millimeter by self-consistently reprocessing the energy absorbed in the optical/UV to the infrared.
3 The Spoon diagram
We now test whether our suite of models, tuned to fit the broad-band SEDs from 1 m to 1 mm, can explain the distribution of galaxies in the diagnostic diagram developed by Spoon et al (2007), strenght of 9.7 m silicate feature versus equivalent width of 6.2 m PAH feature. A difficulty in defining the strengths of features in the mid infrared is defining the underlying continuum. The spectra are almost always very strongly modified both by the broad PAH emission features and by the broad silicate (generally absorption) features. Spoon et al (2007) used several approaches to define the continuum, usually employing spline fits to the emission at three selected wavelengths. The resulting continua are plausible but somewhat arbitrary. Here we adopt a more uniform approach, although it is no less vulnerable to contributions from unaccounted for absorption or emission features. In the region of the 6.2 m feature we use a log-log interpolation between 5.85 and 6.6 m and in the region of the 9.7 m feature we use log-log interpolation between 8.2 and 12.0 m, to define the underlying continuum. We are therefore assuming the latter has a power-law form between these selected end-points.
Figure 1 shows the Spoon diagram for a selection of our starburst models (Efstathiou et al 2000), compared with the Spoon et al (2007) data for 180 starburst galaxies or AGN, showing the variation of just two model parameters, the age of the starburst, and the initial optical depth to the centre of a GMC.
For AGN dust tori we indicate in Fig 1 the range of 9.7 m feature strengths as a function of viewing angle for one of these AGN dust torus models, a tapered disk with opening angle 60o (see above for other parameters). The 6.2 m EW is zero for these dust torus models, since we assume that in AGN environments the intensity of UV radiation is too high for the survival of very small grains or large molecules.
Mixture lines are shown between a type 1 AGN dust torus (face-on viewing) and two of our starburst models, those which have been used by Rowan-Robinson (2001) and Rowan-Robinson et al (2005,2008) to approximate to an M82 starburst and an Arp 220 (higher optical depth) starburst, to a young starburst (t = 0, = 150), and to an old starburst (t = 72 Myrs, = 50).
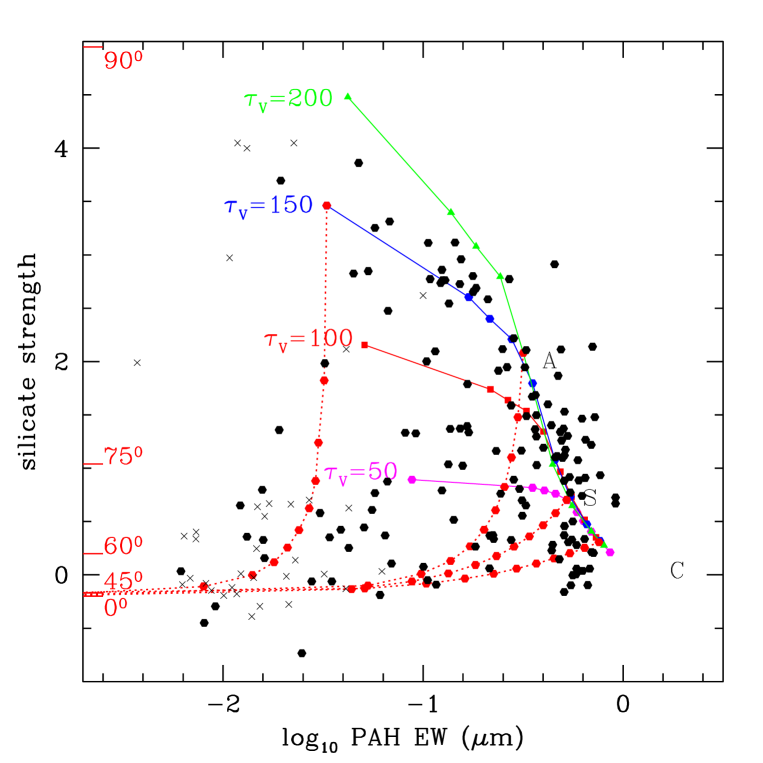
The models bracket the observed distribution remarkably well. Young starbursts are well differentiated by the 9.7 m feature strength for different but at later times the sequences for different converge, ie there is aliasing between starburst age and the optical depth. There is also aliasing between starbursts of young age and mixtures between AGN dust tori and older starbursts. This diagram on its own is not capable of resolving these aliases. The full IRS spectrum does offer a stronger handle on model parameters, especially when combined with photometry at longer wavelenths.
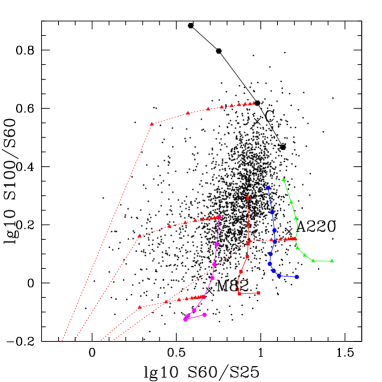
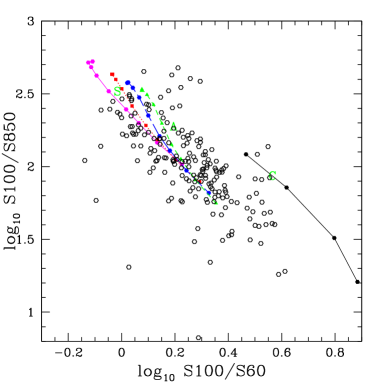
To illustrate the latter we also show, in Fig 2, the 100-60-25 (LH) and 850-100-60 (RH) m colour-colour diagrams, for our starburst model sequences and for a series of cirrus models in which optically thin dust is illuminated by light with the spectrum of the local interstellar radiation field, with intensity = 1, 2, 5, 10, where denotes the ratio of the intensity of the radiation field to that in the solar neighbourhood. The 100-60-25 m data are from the Imperial IRAS FSC redshift (IIFSCz) catalogue of Wang and Rowan-Robinson (2009), with the restriction z0.3. The 850-100-60 m data are from Dunne et al (2000), Rigopoulou et al (1996), Fox (2002), Clements et al (2009, in preparation) and from a literature compilation by Chanial (2009, in preparation), with the restriction that z 0.2. The 100-60-25 m diagram is sensitive to both the age of the starburst and the optical depth. Objects with higher values of S100/S60 require a quiescent (’cirrus’) contribution. A complication of these far infrared colour-colour diagrams as diagnostics is the effect of redshift and there is a strong benefit in using rest-frame features as in Fig 1.
While the main ridge of objects in the Spoon diagram (Fig 1) could be modeled as a single sequence of starbursts of different ages, with , It is clear from the 100-60-25 m diagram (Fig 2L) that the full range of from 50 to 200 is needed. The broad-band colour-colour diagrams (Figs 2L and 2R) both require that the starbursts models be mixed with an optically thin ’cirrus’ contribution, with in the range 2-10. Some of the outliers in the 850-100-60 m colour-colour diagram (Fig 2R) may be due to inaccurate 850 m integrated fluxes, but there is a hint that some galaxies may contain more cold dust than predicted in these models. Finally both the Spoon diagram, the 100-60-25 m diagram (Fig 2L), and individual SEDs demonstrate the need in many cases for an additional component due to an AGN dust torus. Thus the broad set of components (starbursts, cirrus, AGN dust torus) originally introduced by Rowan-Robinson and Crawford (1989) to account for the IRAS 12-100 m colours still hold, and encompass what we see in infrared galaxy SEDs, albeit with considerable refinement.
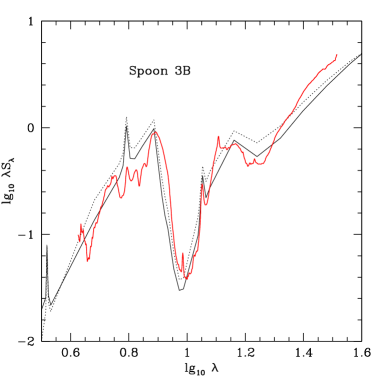
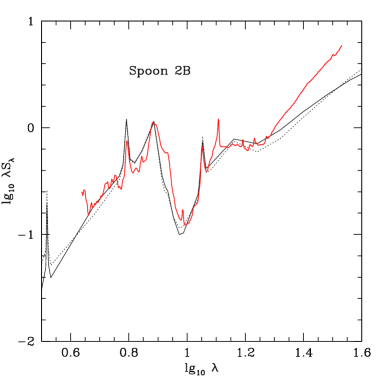
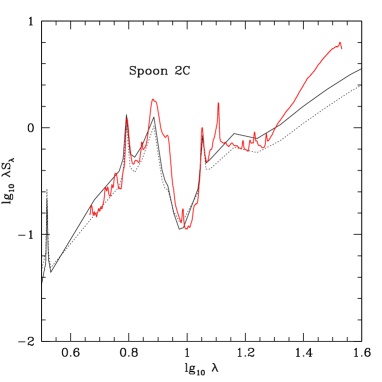
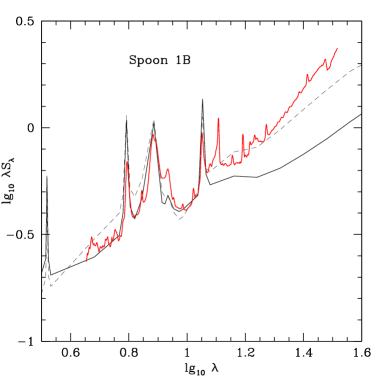
4 Detailed fits to SEDs of average spectral classes from Spoon et al 2007
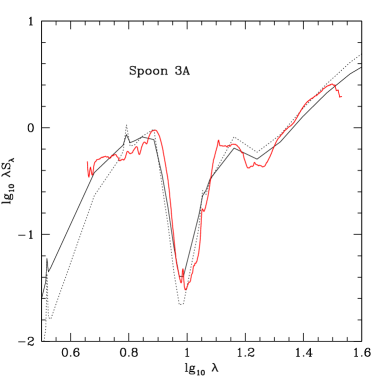
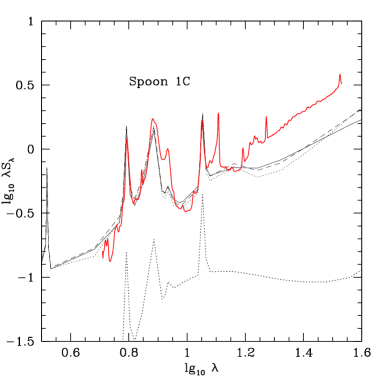
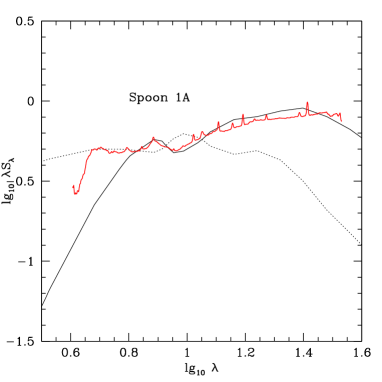
Spoon et al (2007) divide their diagnostic diagram into 8 regions and generate a mean IRS spectrum for the galaxies in each region. In Figs 3-6 we show some of our model fits for these mean IRS spectra. Note that our models do not incorporate the 12.8 mu NeII line. Fits could probably be improved with a finer grid of models. In Figure 5R we have included a cirrus model to show how similar this is to an old starburst at 5-40 m.
Such average SEDs give us some idea of the minimal set of templates needed to characterize infrared galaxy spectra. But because of the strong evolution of individual SEDs as a starburst ages and the possible aliasing between starburst age, initial optical depth, and possible presence of an AGN dust torus, galaxies at very different stages of their evolution may be being combined together in these averages. The 1A average spectrum (Fig 6) certainly looks like an average together of AGN dust tori viewed at very different inclinations. In future work we plan to model a substantial sample of individual galaxy SEDs where IRS data are available.
5 Discussion and conclusions
Our models for starbursts, quiescent star-forming galaxies and for AGN dust tori are able to model the full range of IRS spectra measured with Spitzer. The Spoon et al (2007) diagnostic diagram gives a good indication of the age and optical depth of a starburst, and of the contribution of an AGN dust torus. There are good possibilites of determining the age of a starburst from its spectrum and this has important implications for understanding the evolution of starburst and quasar activity in galaxies. However there is aliasing between age and optical depth at later times in the evolution of a starburst, and between age and the presence of an AGN dust torus.
The use of a small number of templates to model far infrared and submillimetre SEDs (Rowan-Robinson 2000) has obvious limitations, given the large number of potential model parameters. A significant improvement to future analyses of this type might be to add an additional template corresponding to a young starburst, as in the mixture lines shown in Fig 1. Although these represent a small fraction of the infrared galaxy population () they are of great interest for evolutionary studies. An old starburst, which might also be desirable to bracket the full range of observed starburst, differs only slightly from a quiescent (cirrus) galaxy, at least in the mid infrared (see Fig 5R).
6 Acknowledgements
We thank Henrik Spoon for supplying the data for the Spoon et al (2007) diagnostic diagram and the mean IRS spectra for their spectral classes.
References
- [1] Alexander, D.M., Efstathiou, A., Hough, J.H., Aitken, D.K., Lutz, D., Roche, P.F., Sturm, E. 1999, MNRAS, 310, 78
- [2] Bruzual, A.G., & Charlot, S., 1993, ApJ, 405, 538
- [3] Clements D. et al, 2008, MNRAS, 387, 247
- [4] Dale, D.A., Helou, G., Contursi, A., Silbermann, N.A., Kolhatkar, S., 2001, ApJ, 549, 215.
- [5] Dopita M.A., Groves B.A., Fischera J., Sutherland R.S., Tuffs R.J., Popescu C.C., Kewley L.J., Reuland M., Leitherer C., 2005, 619, 755.
- [6] Dullemond, C.P., van Bemmel, I.M. 2005, A&A, 436, 47
- [7] Dunne L., Eales S., Edmunds M., Ivison R., Alexander P., Clements D.L., 2000, MNRAS 315, 115
- [8] Efstathiou, A., & Siebenmorgen, R. 2005, AA, 439, 85
- [9] Efstathiou, A., & Siebenmorgen, R. 2009, AA, in press
- [10] Efstathiou, A., & Rowan-Robinson, M., 1990, in ’Dusty Objects in the Universe”, eds E.Bussoletti and A.A.Vittone (Kluwer), p.197
- [11] Efstathiou A., Rowan-Robinson M., 1995, MNRAS 273, 649
- [12] Efstathiou A., Rowan-Robinson M., 2003, MNRAS 343, 322
- [13] Efstathiou A., Rowan-Robinson M., Siebenmorgen R., 2000, MNRAS 313, 734
- [14] Farrah D., Lonsdale C.J., Weedman D.W., Spoon H.W.W., Rowan-Robinson M., Polletta M., Oliver S., Houck J.R., Smith H.E., 2008, ApJ 677, 957
- [15] Farrah D., Afonso J., Efstathiou A., Rowan-Robinson M., Fox M., Clements D., 2003, MNRAS, 343, 585.
- [16] Fox M., 2002, PhD thesis, University of London
- [17] Granato G.L. and Danese L., 1994, MNRAS 268, 235
- [18] Hoenig S.F., Beckert T., Ohnaka K., Weigelt G., 2006, AA 452, 459
- [19] Mathis J.S., Mezger P.G., Panagia N., 1983, AA 128, 212
- [20] Nenkova M., Ivezic Z., Elitzur M., 2002, ApJ, 570, L9.
- [21] Nenkova et al, 2008, ApJ 685, 147
- [22] Pier G.L. and Krolik J., 1992, ApJ 401, 99
- [23] Piovan, L., Tantalo, R., Chiosi, C., 2006, MNRAS, 366, 923.
- [24] Rigopoulou D., Lawrence A. and Rowan-Robinson M., 1996, MNRAS 278, 1049
- [25] Roche P.F., Aitken D.K., Smith C.H., Ward M.J., 1991, MNRAS, 248, 606.
- [26] Rowan-Robinson M., Crawford J., 1989, MNRAS
- [27] Rowan-Robinson M., 1992, MNRAS 258, 787
- [28] Rowan-Robinson M., Efstathiou A., 1993, MNRAS 263, 675
- [29] Rowan-Robinson M., 1995, MNRAS 272, 737
- [30] Rowan-Robinson M. et al, 2005, AJ 129, 1183
- [31] Rowan-Robinson M. et al, 2006, in Spitzer Conference ’Understanding Galaxy Populations’, eds ,astro-ph/0603737
- [32] Rowan-Robinson M. et al, 2008, MNRAS 386, 697
- [33] Ruiz, M., Efstathiou, A., Alexander, D.M., Hough, J. 2001, MNRAS, 325, 995
- [34] Schartmann M., Meisenheimer K., Camenzind M., Wolf S., Tristram K.R.W., Henning T., 2008, A&A, 482, 67.
- [35] Siebenmorgen R., Krugel E., 2007, AA 461, 445
- [36] Silva, L., Granato, G. L., Bressan, A., Danese, L., 1998, ApJ, 509, 103.
- [37] Spoon H. et al, 2007, ApJL 654, L49
- [38] Takagi T., Arimoto N., Hanami H., 2003, MNRAS, 340, 813