address=Tartu Observatory, EE-61602 Tõravere, Estonia
Large scale structure of the Universe
Abstract
A short overview is given on the development of our present paradigm of the large scale structure of the Universe with emphasis on the role of Ya. B. Zeldovich. Next we use the Sloan Digital Sky Survey data and show that the distribution of phases of density waves of various scale in the present-day Universe are correlated. Using numerical simulations of structure evolution we show that the skeleton of the cosmic web was present already in an early stage of the evolution of structure. The positions of maxima and minima of density waves (their phases) are the more stable, the larger is the wavelength. The birth of the first generation of stars occured most probably in the central regions of rich proto-superclusters where the density was highest in the early Universe.
Keywords:
galaxies, clusters of galaxies, large-scale structure of the Universe:
98.65.-r1 Introduction: Ya. B. Zeldovich and the development of our understanding of the large-scale structure of the Universe
This conference is devoted to Ya. B. Zeldovich, to celebrate his 95th birthday, so let me start with an overview of our contacts with Ya. B. Zeldovich and his group, in particular of his role in the development of the modern view of the large scale structure and the evolution of the Universe. Thereafter I will analyse the luminosity density field of galaxies of the Sloan Digital Sky Survey (SDSS). Finally I will use numerical simulations of evolution of structure to follow the changes of phases (positions of maxima and minima) of density waves of various scales, using wavelet techniques.
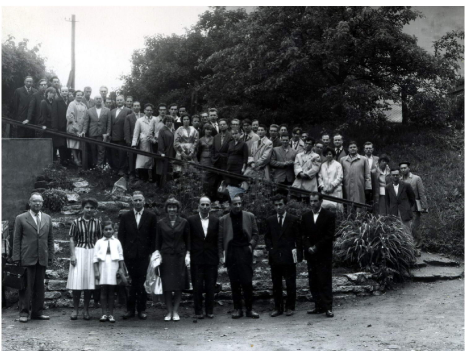
Tartu astronomers met Ya. B. Zeldovich for the first time in 1962. The main building of the new observatory in Tõravere was not yet completed, but under the initiative of Ya. B. Zeldovich a summer school on cosmology was held there, one of the first of similar summer and winter schools. Fig. 1 shows participants of the school visiting the old Tartu Observatory. In 1960s Tartu astronomers participated in Astrophysics Seminars in Sternberg Institute, organized by Ya. B. Zeldovich, during their visits to Moscow. Here astronomers from all Moscow astronomical institutes gathered to discuss actual problems of astrophysics.
My own first report in this seminar was in 1971, when I made a summary of my doctoral thesis on galactic modeling. This report was a starting point of our collaboration with Zeldovich and his group. Next year members of our cosmology group were invited to participate in the Archõz Winter School on astrophysics, where I made a more detailed report of new galactic models. In January 1974 the School was held near the Elbrus mountain in a winter resort. I reported our very fresh results on the study of the dynamics of satellite galaxies. Our data suggested that all giant galaxies have massive invisible coronas, which exceed masses of known stellar populations at least tenfold. Thus dark matter must be the dominating component in the whole universe. In the discussion after the talk two questions dominated: What is the physical nature of the dark matter? and What is its role in the evolution of the Universe?
The importance of dark matter for cosmological studies was evident, thus Tartu astronomers organized in January 1975 a conference in Tallinn devoted solely to dark matter (Doroshkevich et al. (1975)). Historically this was the first conference on dark matter. In addition to dynamical and morphological properties of galaxy systems (Einasto et al. (1974a, b)) the nature of galactic coronas was discussed. Here are titles of some talks held at this conference: Zeldovich (1975): “Deuterium nucleosynthesis in the hot Universe and the density of matter”; Komberg & Novikov (1975): “Physical nature of galactic coronas”; and Jaaniste & Saar (1975): “Properties of stellar halos”. These studies reported at the conference demonstrated that both the stellar as well as gaseous models for coronas have difficulties. It is very difficult to explain physical properties of the stellar corona, since all old spheroidal populations have a low mass-to-luminosity ratio whereas this ratio for the corona is very high. Also, no fast-moving stars as possible candidates for stellar coronas were found. Gaseous corona cannot consist of neutral gas (intergalactic hot gas would ionize the coronal gas), but a corona consisting of ionized gas would be observable. Actually, at least part of the corona must be gaseous, as demonstrated by the morphology of satellite galaxies: elliptical (non–gaseous) companions lie close to the primary galaxy whereas spiral and irregular (gaseous) companions of the same luminosity have larger distances from the primary galaxy, as shown by Einasto et al. (1974b). The amount of the hot gas is, however, insufficient to explain flat rotation curves of galaxies.
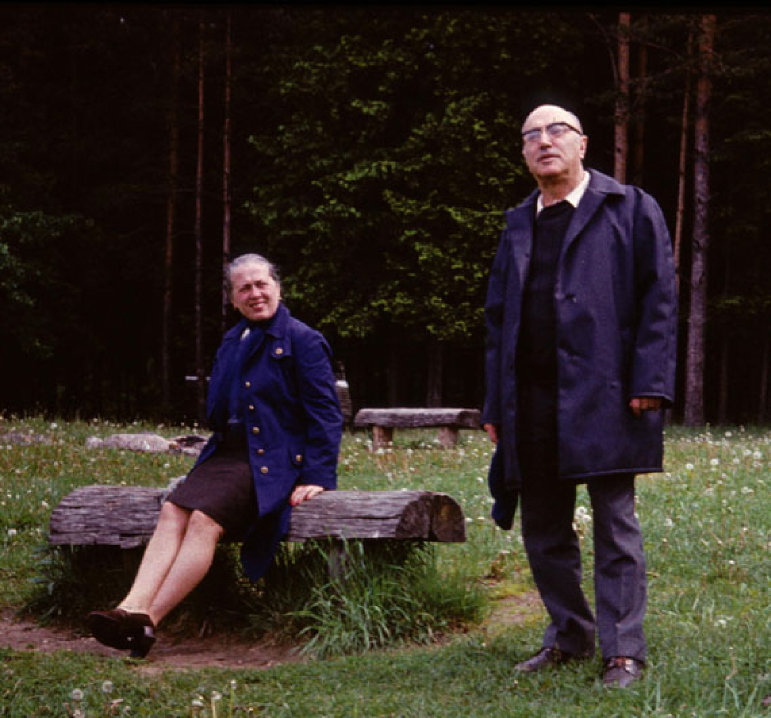
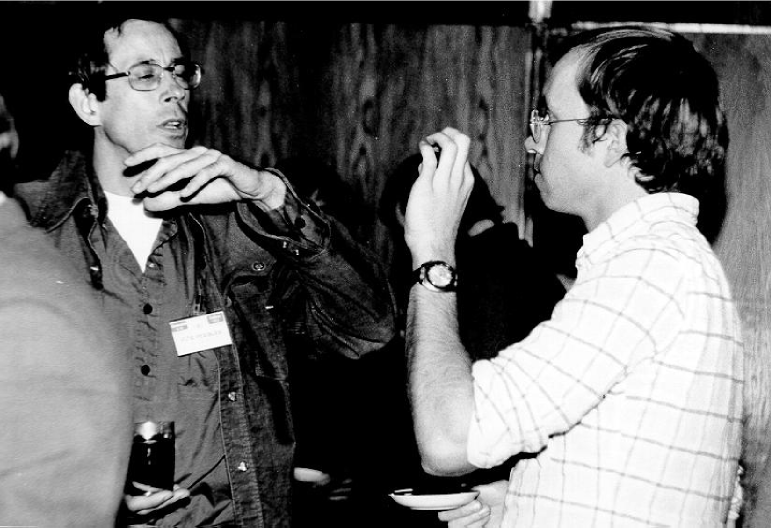
Whatever the nature of galactic coronas, it was evident that dark matter as the dominant population of the universe determines details of physical processes of the formation and evolution of galaxies. Zeldovich asked Tartu astronomers for help in solving the question: Can we find observational evidence that can be used to discriminate between various theories of galaxy formation? At this time there were two basic rivaling theories of structure formation: the pancake theory by Zeldovich (1970), and the hierarchical clustering theory by Peebles (1971) (see Figures 2 and 3). According to the Zeldovich scenario the structure forms top-down: first matter collects into pancakes and then fragments to form smaller units. In the hierarchical clustering scenario the order of the formation of systems is opposite: first small-scale systems (star-cluster sized objects) form, and by clustering systems of larger size (galaxies, clusters of galaxies) form; this was called the bottom-up scenario.
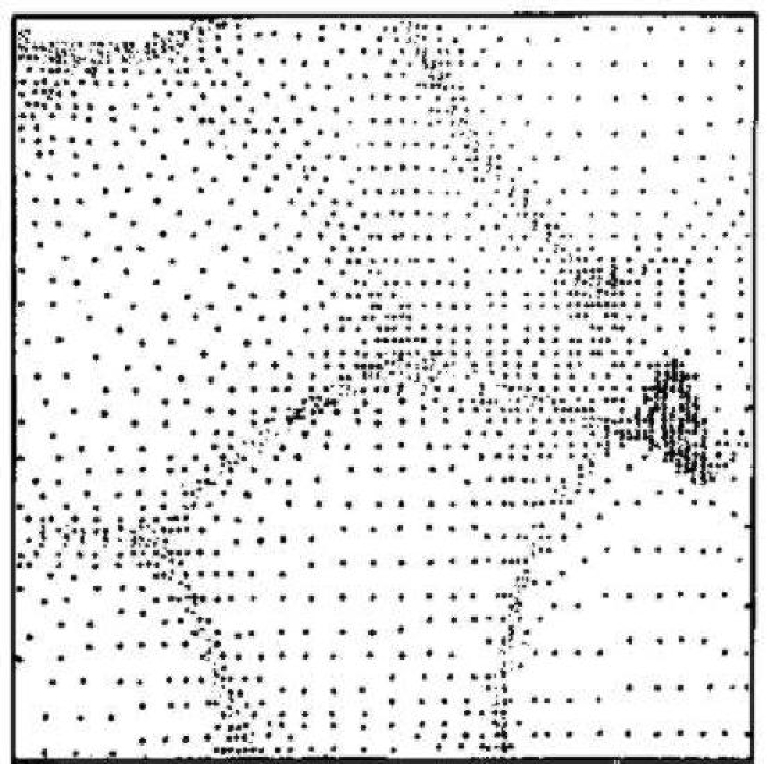
When solving the Zeldovich question we recalled our previous experience in the study of galactic populations: structural properties of populations hold the memory of their previous evolution and formation. Random velocities of galaxies are of the order of several hundred km/s, thus during the whole lifetime of the Universe galaxies have moved from their place of origin only by about 1 Mpc (we use in this paper the Hubble constant in the units of km s-1 Mpc-1). In other words – if there exist some regularities in the distribution of galaxies, then these regularities must reflect the conditions in the Universe during the formation of galaxies. What is expected in the pancake model is shown in Fig. 4. This simulation of structure formation was made in mid-1970s in the Institute of Applied Mathematics with the largest available computer at this time by the Zeldovich group. In the simulation a network of high- and low-density regions was seen: high-density regions form cells which surround large under-dense regions.
When we started this study, first all-sky complete redshift surveys of galaxies were just available: the Shapley-Adams revised catalogue (Sandage & Tammann (1981)), complete up to the magnitude 13.5, and the Second Revised Catalogue of Galaxies (de Vaucouleurs et al. (1976)), containing data on even fainter galaxies. The three-dimensional distribution of galaxies, groups and clusters of galaxies can be visualised using wedge diagrams. In these diagrams, where galaxies as well as groups and clusters of galaxies were plotted – see Fig. 5, regularity was clearly seen: galaxies and clusters are concentrated to identical essentially one-dimensional systems, and the space between these systems is practically empty.
The distribution was quite similar to the distribution of simulation particles in a numerical simulation of the evolution of the structure of the Universe prepared by the Zeldovich group, Fig. 4. We had the impression that observed high-density regions – superclusters of galaxies – could be identified with Zeldovich pancakes.
We reported our results (Jõeveer & Einasto (1978)) at the IAU symposium on Large-Scale Structure of the Universe in Tallinn 1977, the first conference on this topic. The main results were: (1) galaxies, groups and clusters of galaxies are not randomly distributed but form chains, converging in superclusters; (2) the space between galaxy chains contains almost no galaxies and forms holes (voids) of diameters of Mpc, as seen from the wedge diagrams in Fig. 5. The presence of holes (voids) in the distribution of galaxies was reported also by other groups: Tully & Fisher (1978), Tifft & Gregory (1978) and Tarenghi et al. (1978) in the Local, Coma and Hercules superclusters, respectively. Theoretical interpretation of the cellular structure was discussed by Zeldovich (1978).
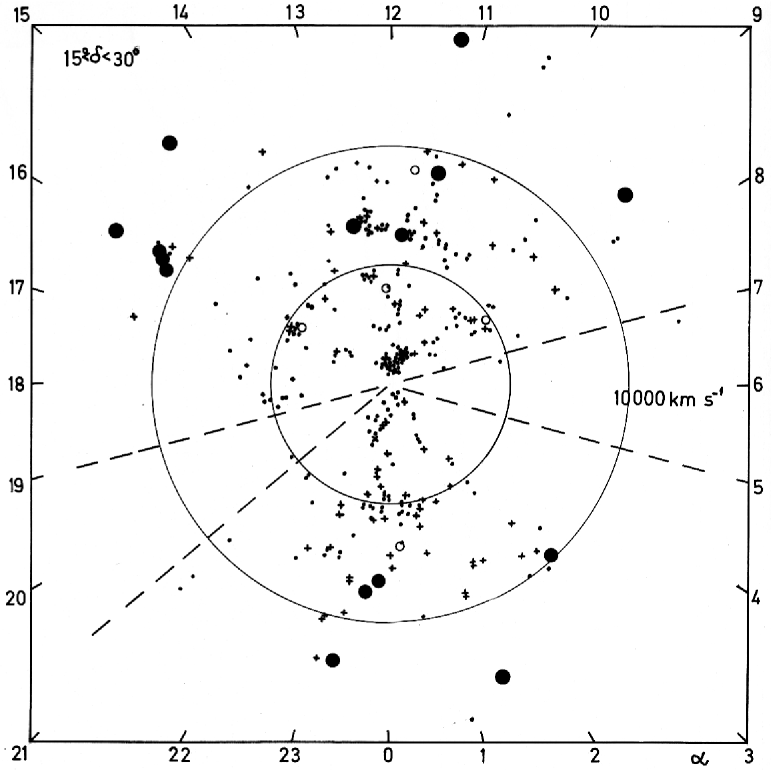
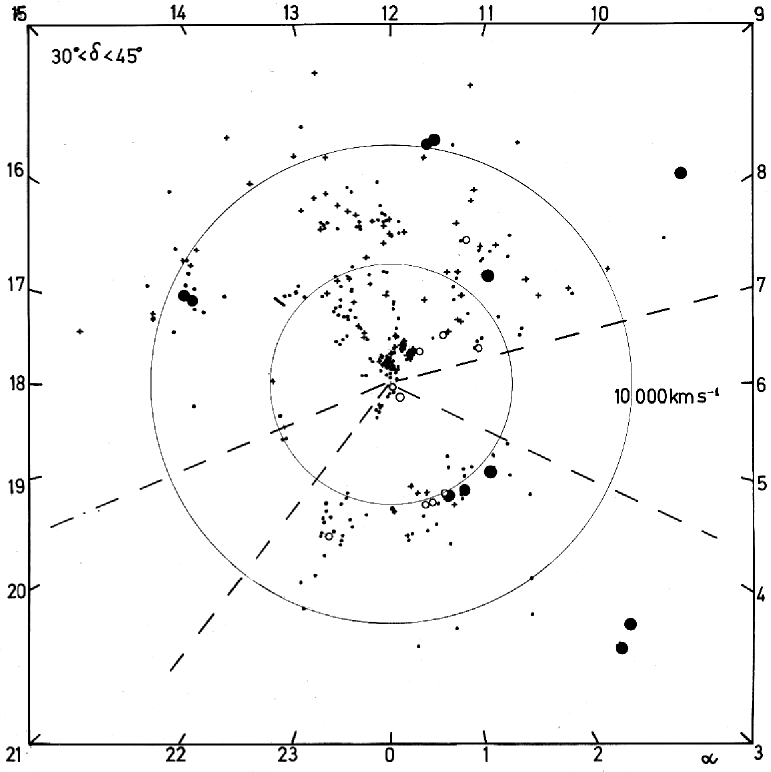
The most important aspect of the structure of superclusters is the fine structure of chains: clusters and groups within a chain are elongated along the chain, as seen in the long chain of clusters, groups and galaxies of the Perseus-Pisces supercluster. This chain is located almost perpendicular to the line of sight, and the scatters of positions of clusters/groups along the chain in radial (redshift) and tangential directions are practically identical. This demonstrates that the chain is essentially an one-dimensional structure. A direct consequence of this observation is that galaxies and groups/clusters of the chain are already formed within the chain. A later inflow from random locations to the chain is excluded, since in this case it would be impossible to stop galaxies and clusters in the chain after the inflow. This is possible only in a gaseous dissipative medium before the formation of galaxies.
New data gave strong support to the Zeldovich pancake scenario. However, some important differences between the model and observations were evident. First of all, there exists a rarefied population of simulation particles in voids, absent in real data. This was the first indication for the presence of physical biasing in galaxy formation – there must be primordial gas and dark matter in voids (because gravity cannot evacuate voids completely), but due to low matter density no galaxy formation takes place here.
The second difference lies in the structure of galaxy systems in high-density regions: in the original pancake model large-scale structures (superclusters) have rather diffuse forms, real superclusters consist of multiple intertwined filaments (Jõeveer & Einasto (1978); Zeldovich et al. (1982); Oort (1983)). The reason of this discrepancy was clarified several years later.
Let me recall one more historical moment in our search for understanding the cosmic evolution in late 1970s. At the Tallinn symposium Parijskij (1978) made a report on his search for primordial perturbations in the Universe with RATAN-600, the largest and most sensitive radio telescope at this time. No temperature fluctuations were found, the upper limit was about of the mean temperature. After the talk Zeldovich discussed these results with Parijskij and expressed his doubts that something must be wrong in his observations. Theoretical calculations show that at the epoch of recombination the density (and temperature) fluctuations must have an amplitude of the order of , otherwise the structure cannot form, since gravitational instability that is responsible for the growth of the amplitude of fluctuations, works very slowly in an expanding Universe.
The above arguments concern fluctuations of the baryonic gas density. Then astronomers recalled the possible existence of non-baryonic particles, such as heavy neutrinos. This suggestion was made independently by several astronomers (Cowsik & McClelland (1973); Szalay & Marx (1976); Tremaine & Gunn (1979); Doroshkevich et al. (1980); Chernin (1981); Bond et al. (1983)) and others. They found that if dark matter consists of heavy neutrinos, then this helps to explain the paradox of small temperature fluctuations of the cosmic microwave background radiation. This problem was discussed at a conference in Tallinn in April 1981. Recent experiments by a Moscow physicist Lyubimov were announced, which suggested that neutrinos have masses. If so, then the growth of perturbations in a neutrino-dominated medium can start much earlier than in a baryonic medium, and at the time of recombination perturbations may have amplitudes large enough for structure formation. At the conference banquet Zeldovich gave an enthusiastic speech: “Observers work hard in sleepless nights to collect data; theorists interpret observations, are often in error, correct their errors and try again; and there are only very rare moments of clarification. Today it is one of such rare moments when we have a holy feeling of understanding the secrets of Nature.” Non-baryonic dark matter is needed to start structure formation early enough.
However, in the neutrino-dominated dark matter small-scale perturbations are damped. This prevents the formation of fine structure, such as galaxy-sized halos and filaments. Motivated by the observational problems with neutrino dark matter, a new dark matter scenario was suggested by Blumenthal et al. (1982); Bond et al. (1982); Pagels & Primack (1982); Peebles (1982); Bond & Szalay (1983); Doroshkevich & Khlopov (1984) with hypothetical particles as axions, gravitinos, photinos or unstable neutrinos playing the role of dark matter. This model was called the Cold Dark Matter (CDM) model, in contrast to the neutrino-based Hot Dark Matter model.
Numerical simulations of the evolution of structure for the hot and cold dark matter were compared by Melott et al. (1983), and by White et al. (1983, 1987) (the standard model with the density parameter , SCDM). In contrast to the HDM model, in the SCDM scenario formation of structure starts early and superclusters consist of a network of small galaxy filaments, similar to the observed distribution of galaxies. Thus SCDM simulations reproduce quite well the observed structure with clusters, filaments and voids, including its quantitative characteristics (percolation or connectivity, the multiplicity distribution of systems of galaxies).
As a further step to improve the model, the cosmological constant, , was incorporated into the scheme. Arguments favouring a model with the cosmological constant were suggested already by Gunn & Tinsley (1975); Turner et al. (1984); Kofman & Starobinskii (1985): combined constraints on the density of the Universe, ages of galaxies, and baryon nucleosynthesis. Numerical models with the cosmological term were developed by Gramann (1988), a post-graduate student of Enn Saar. Comparison of the SCDM and CDM models shows that the structure of the cosmic web is similar in both models. However, in order to get a correct amplitude of density fluctuations, the evolution of the SCDM model has to be stopped at an earlier epoch, thus the CDM model is superior of the SCDM model. The CDM model combines essential aspects of both original structure formation models, the pancake and the hierarchical clustering scenario.
One difficulty of the original pancake scenario by Zeldovich is the shape of objects formed during the collapse. It was assumed that forming systems are flat pancake-like objects, whereas dominant features of the cosmic web are filaments. This discrepancy has found an explanation by Bond et al. (1996). They showed that in most cases just essentially one-dimensional structures, i.e. filaments form. Two coauthors of this study, Kofman and Pogosyan, are graduates of the Tartu University and former members of our cosmology group.
2 Distribution of galaxies in the Sloan survey
Presently the largest project to map the Universe is the Sloan Digital Sky Survey (SDSS) (York et al. (2000); Stoughton et al. (2002); Zehavi et al. (2002)). The goal is to map a quarter of the entire sky: to determine the positions and photometric data in 5 spectral bands for galaxies and quasars (about 100 million objects) down to the red magnitude r = 23, and the redshifts of all galaxies down to r = 17.7 (about 1 million galaxies). All seven data releases have been made public. This has allowed to map the largest volume of the Universe so far.
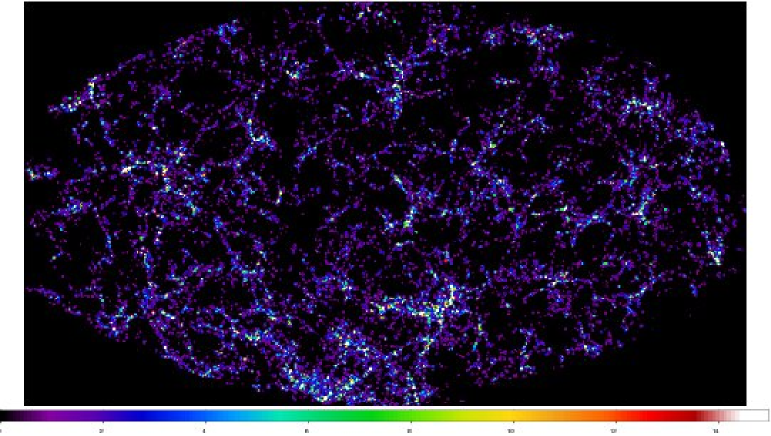
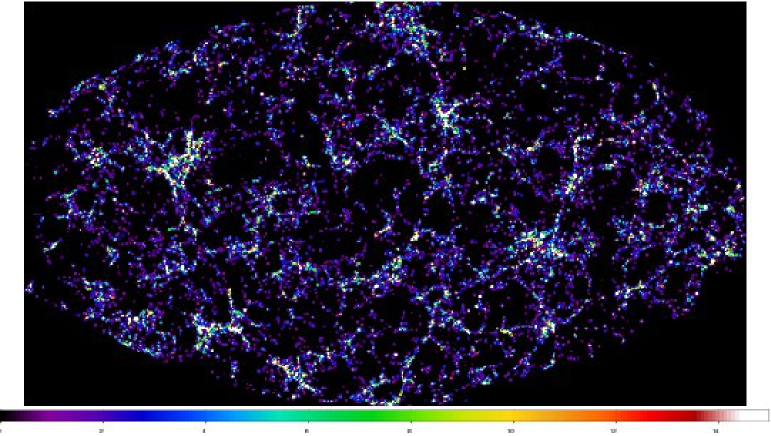
The luminosity density fields of two spherical shells of the full Sloan Survey in the Northern hemisphere are shown in Fig. 6. The luminosity densities were corrected for the incompleteness due to the distance dependent lower luminosity limit of the flux-limited survey. The cosmic web with filamentary superclusters and voids is very well seen. Faint filaments crossing large voids can be seen also. The web has a characteristic cellular pattern, the diameter of one cell – a void surrounded by superclusters – is fairly constant, about 100 Mpc. Since shells are located at different distances from us, the angular diameters of faraway cells are smaller. The great variability of supercluster richness can be easily seen.
The variability of supercluster richness is due to joint action of density perturbations of different scales. To understand better the role of perturbations of various scale we have decomposed the density field into components of various scale using a wavelet technique.
As a first step we analysed a thin, almost 2-dimensional wedge of the Sloan survey equatorial slice, 2.5 degrees thick, centered on the rich supercluster SCL126 in the catalog by Einasto et al. (2001) (the Sloan Great Wall). The high-resolution luminosity density field, reduced to a constant thickness by dividing the local density by the relative thickness of the wedge at a particular distance, is shown in the upper left panel of Fig. 7.
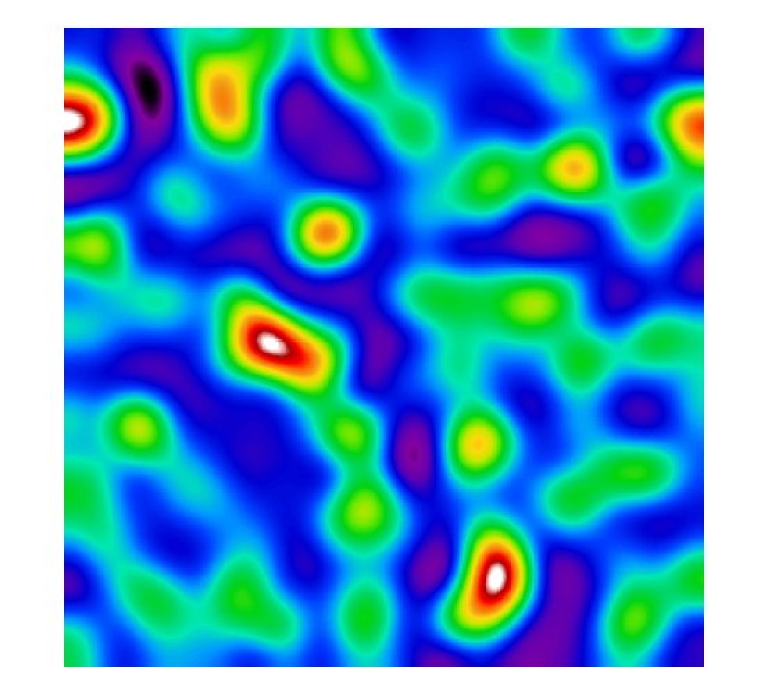
The importance of phase information in the formation of the supercluster-void network has been understood long ago, as demonstrated by Szalay (personal communication) by randomizing phases of a Voronoi simulated picture of a cellular network. To study the role of phase information in more detail we Fourier transformed the density field and randomized phases of all Fourier components and thereafter Fourier transformed it back to see the resulting density field which has for all waves the same amplitudes (power spectrum) as the original field; see the upper right panel of Fig. 7. We see that the whole structure of superclusters, filaments and voids has gone, the field is fully covered by tiny randomly spaced density enhancements – groups of galaxies, there are even no rich clusters of galaxies in this picture that were comparable in luminosity to the real clusters.
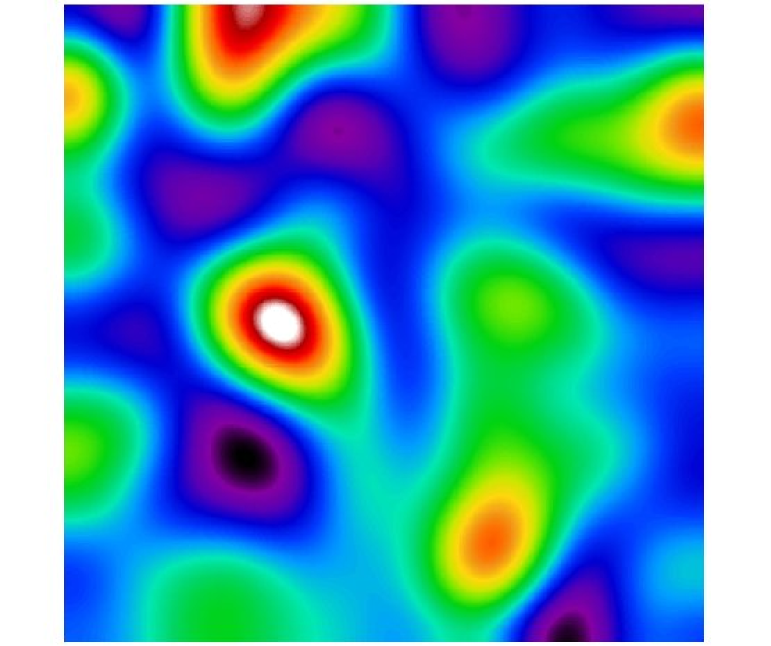
Next we used wavelet analysis to investigate the role of density waves of different scale (for details of the wavelet analysis see Martínez & Saar (2002)). The full field was divided into 8 components, so that the component with the largest waves represents waves of the length about 512 Mpc (the size of the box), and each of the following components represents waves of twice smaller scale. Actually, each component contains waves of scale interval from times lower to times higher than the mean wavelength, so that by combining waves of all components we restore accurately the initial density field. Fig. 7 shows components 4 to 7; they characterize waves of length from about 32 to 256 Mpc.
Let us discuss the distribution of waves in more detail. The middle left panel of Fig. 7 shows the waves of length about 256 Mpc. The regions of highest density of this component are three very rich superclusters: located in the upper left part of the Figure, near the center, and in the lower right part of the panel, the superclusters SCL155, SCL126 and SCL82 in the list by Einasto et al. (2001), respectively. The middle right panel shows waves of scale of about 128 Mpc. Here the most prominent features are the superclusters SCL126 and SCL82 as in the previous panel, but we see several new superclusters: N15 and N04 in the list by Einasto et al. (2003). The supercluster N15 lies between SCL126 and SCL155 near the minimum of the density wave of 256 Mpc scale.
The lower left panel plots waves of scale about 64 Mpc. Here all superclusters that are seen at larger scales are also visible. A large fraction of density enhancements are either situated just in the middle of the low-density regions of the previous panel, or they divide massive superclusters into smaller subunits. The highest peaks are substructures of massive superclusters, and there are numerous smaller density enhancements between the peaks of the previous panel.
This analysis allows to make several conclusions. First of all, our results show that in all cases superclusters form only in regions where large density waves combine in similar phases of high-density regions to generate high density peaks. Very rich superclusters are objects where density waves of all large scales (up to the wavelength Mpc) have similar phases of density maxima. The smaller the maximum wavelength of such phase synchronization, the lower is the richness of superclusters. Similarly, large voids are caused by large-scale density perturbations of wavelength Mpc, here large-wavelength modes combine in similar phases of minima of density waves to generate under-densities.
The second conclusion that can be made from the wavelet analysis concerns the relation of waves of different scale. Density perturbations which have random phases and wavelengths in respect to the principal perturbations (responsible to the formation of rich and very rich superclusters) cancel partly each other out. An exception are the perturbations which have similar phases and wavenumbers that are integer multiples of the wavenumber of the principal perturbation. These are the harmonics (overtones) of the principal perturbation. The first overtone has a wavenumber twice of the principal one; it forms a density peak just in the middle of the void between two rich superclusters, forming two sub-voids of approximately equal diameter within the large under-dense region. This behavior is well seen in the wavelet decomposition of the density field in Fig. 7.
The phase synchronization that generates rich superclusters is not surprising, if considered from the point of view of the density field. A high peak in the field is possible only in the case if density waves of various scale up to a certain limiting wavelength have maxima at the same location. The acoustic behavior of density waves – the domination of overtones – deserves more attention. Presently it is not clear how to explain this behavior.
3 The evolution of superclusters on simulations
To investigate the role of density perturbations of different wavelength we used N-body simulations with particles and with box sizes Mpc. Most models were calculated by Ivan Suhhonenko in Tartu, the Mpc model was obtained by Volker Müller in Potsdam; we denote this model as M100. In the present review I shall analyse only the model M100, other models yield similar results. In model M100 the following cosmological parameters were used: the matter density , the baryonic matter density , the dark energy density ; the initial amplitude parameter , and the dimensionless Hubble parameter . Calculations started at an early epoch, , the early evolution was calculated using the Zeldovich approximation. Particle positions and velocities were extracted for the redshifts . For every particle we calculated also the local density in units of the mean density, using positions of 27 nearby particles.
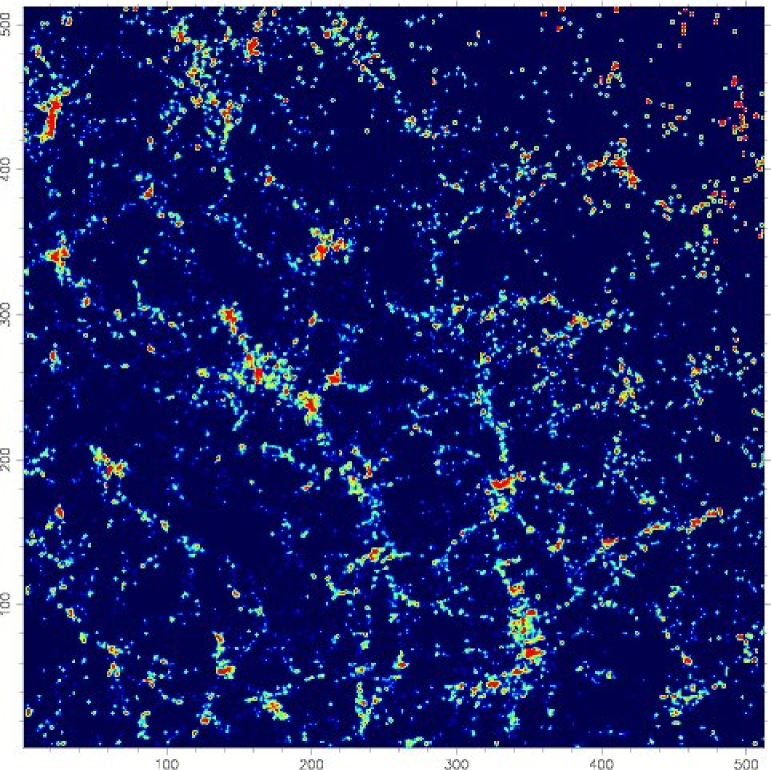
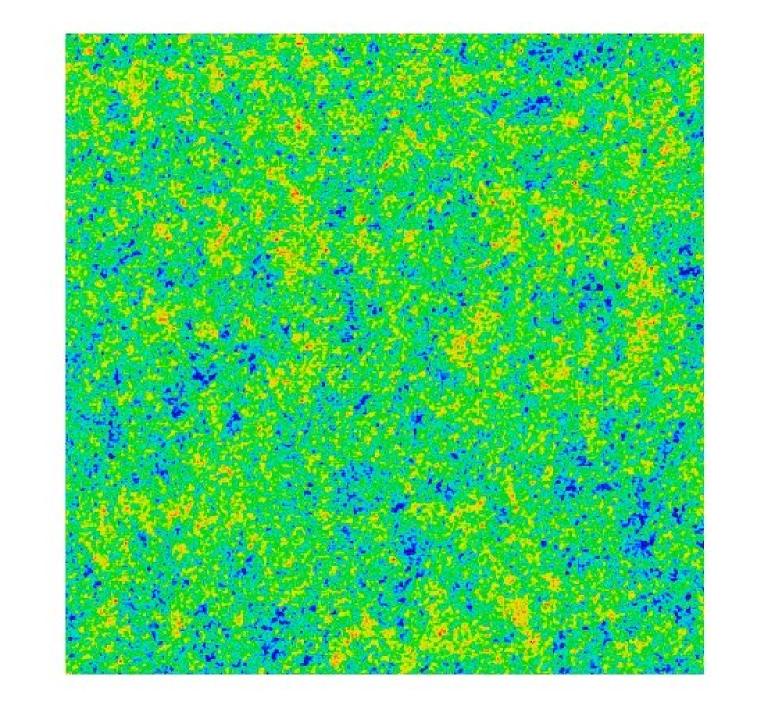
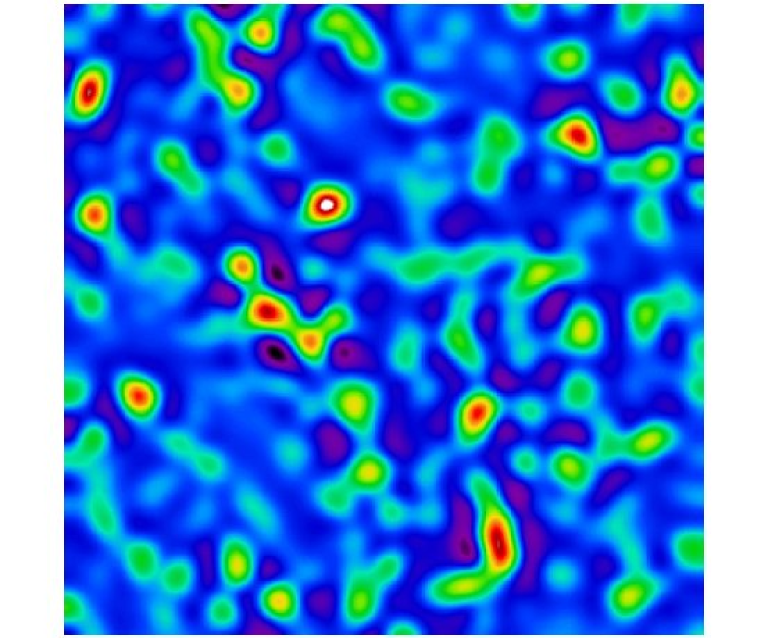
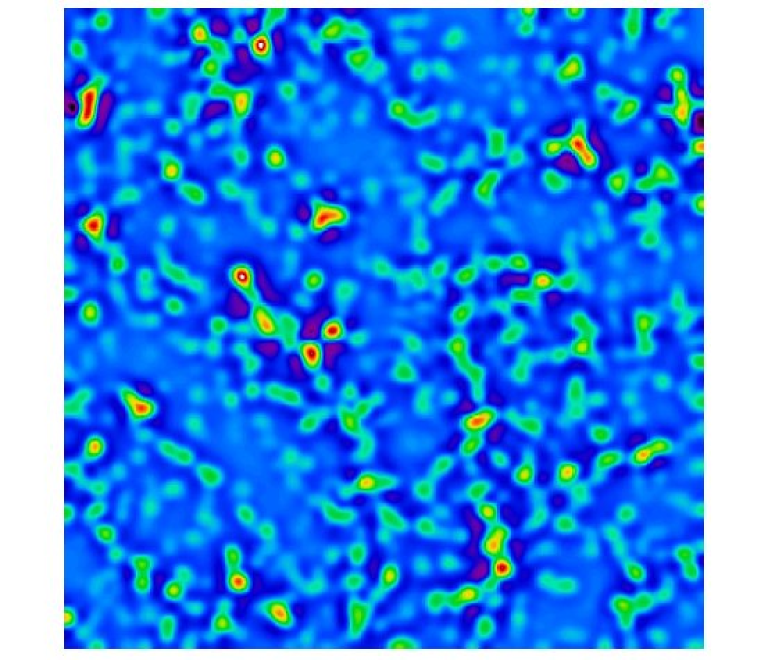
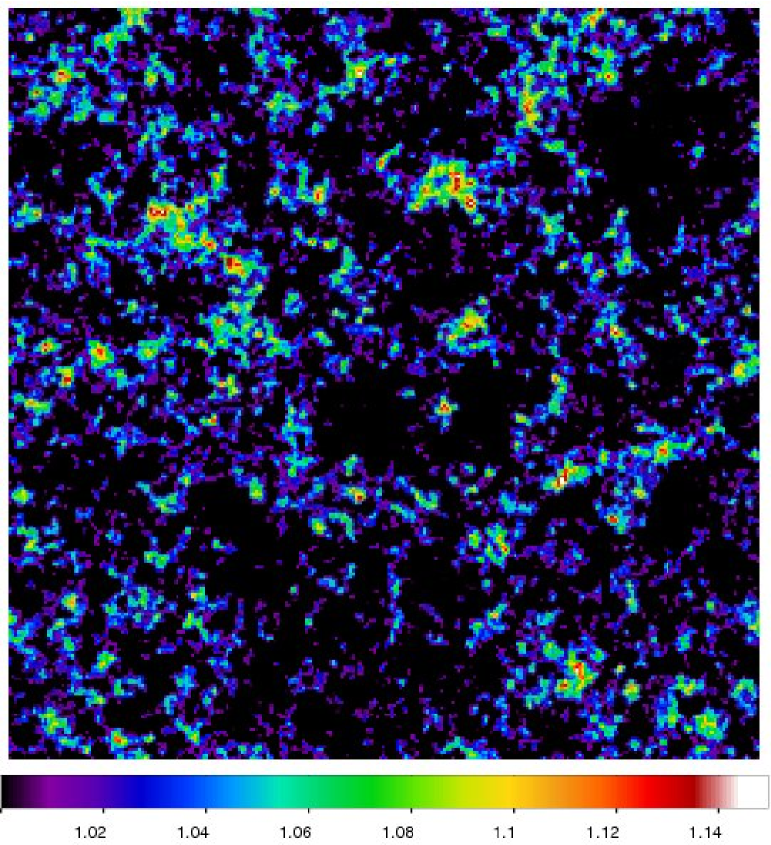
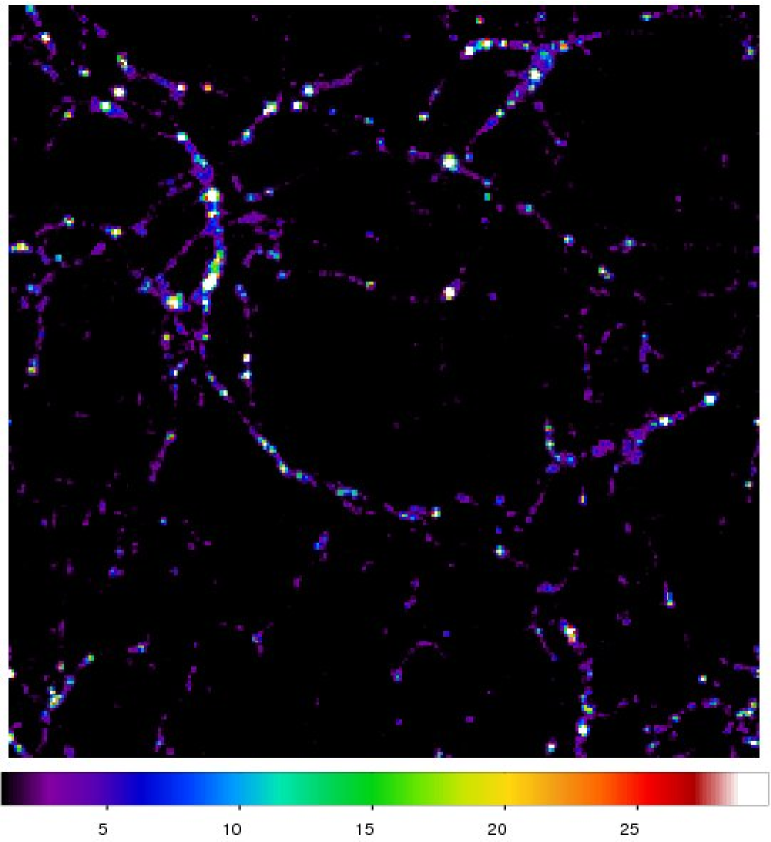
For all models and epochs we calculated the high-resolution density field using the B3 spline smoothing with the step width equal to the spatial resolution of the simulation (for details of smoothing with the B3 spline see Einasto et al. (2008)). The high-resolution density field of the M100 model at the epochs and is presented in Fig. 8. Here we have selected from the full simulation box a sheet that passes through a large void surrounded by superclusters and filaments. At the high-redshift epoch the density contrast is much smaller as expected, but main features of the filament system around the void are clearly seen. The basic high-density knots (protohalos of present-day rich clusters) are very well seen already at the early epoch, and their positions have changed only very little.
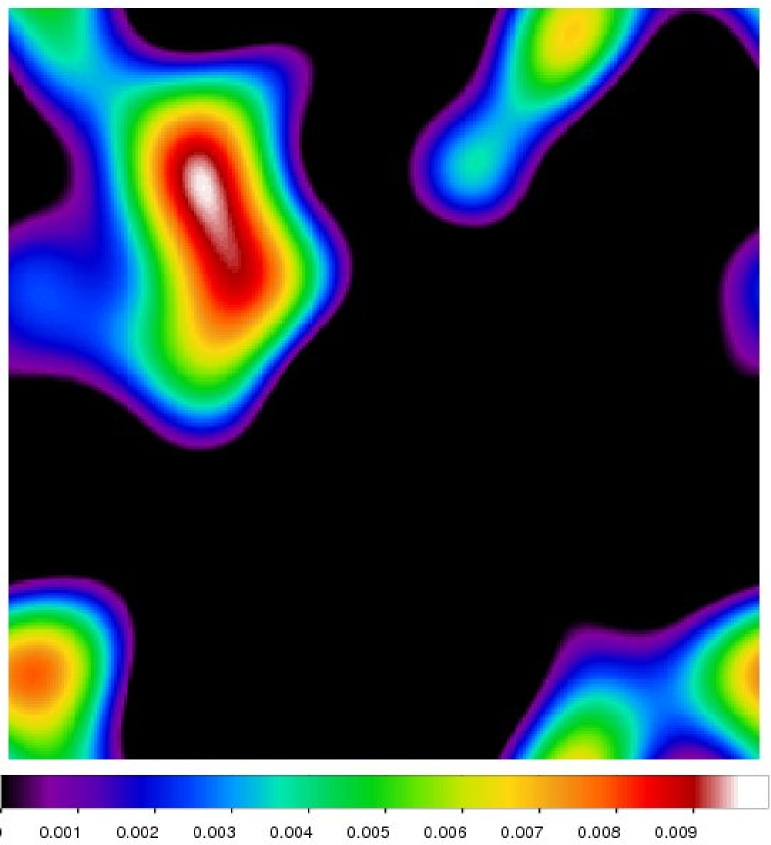
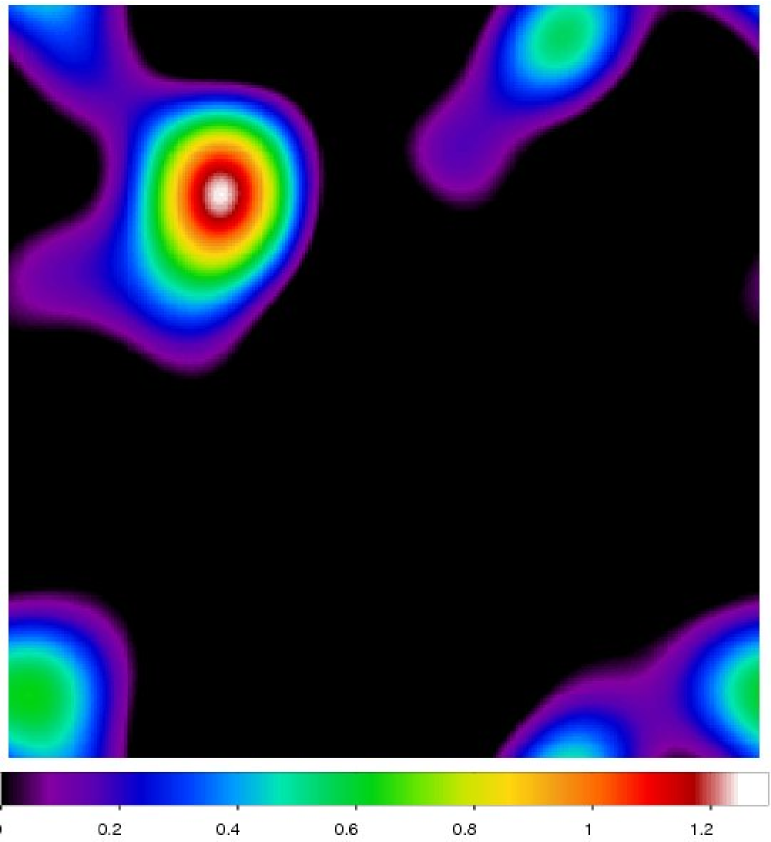
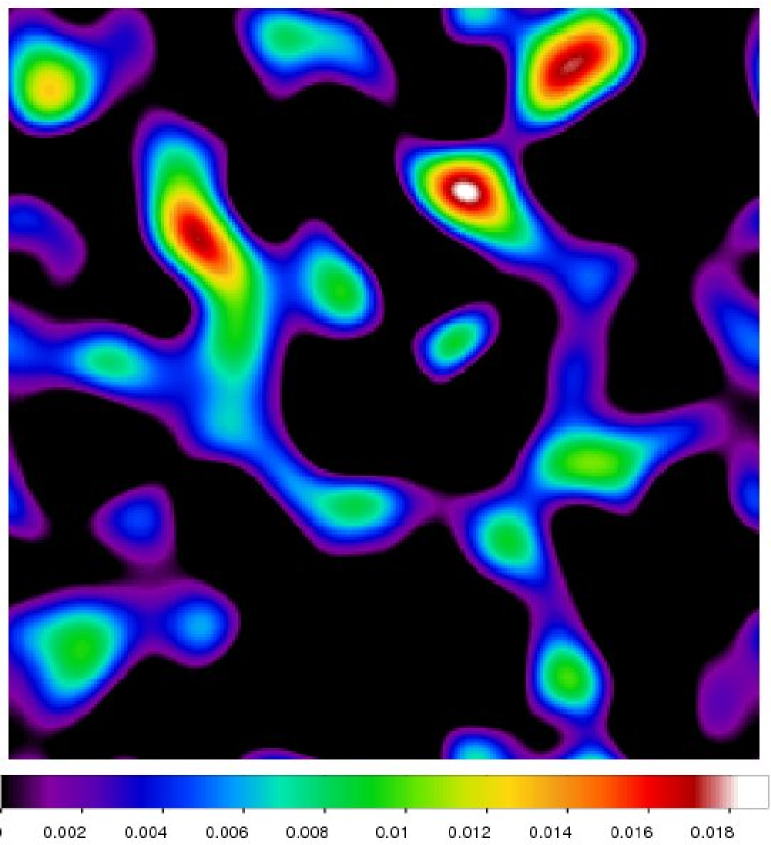
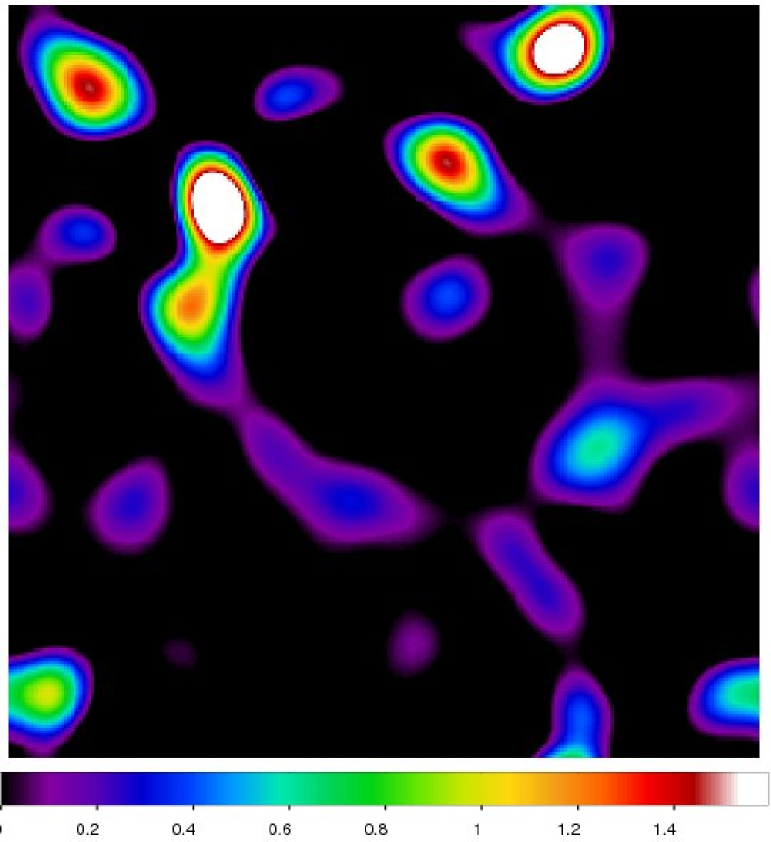
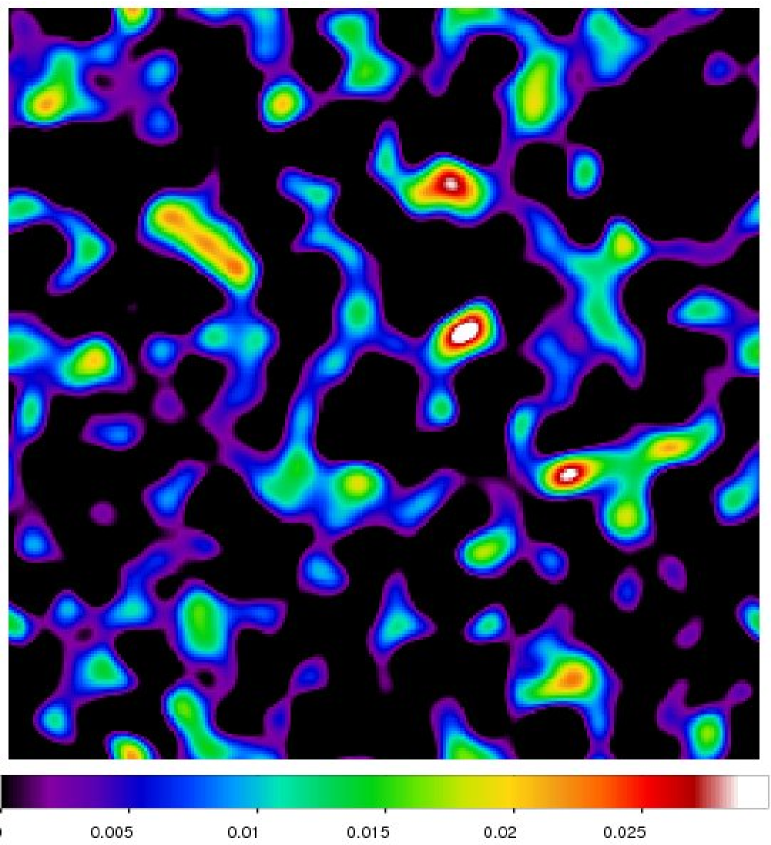
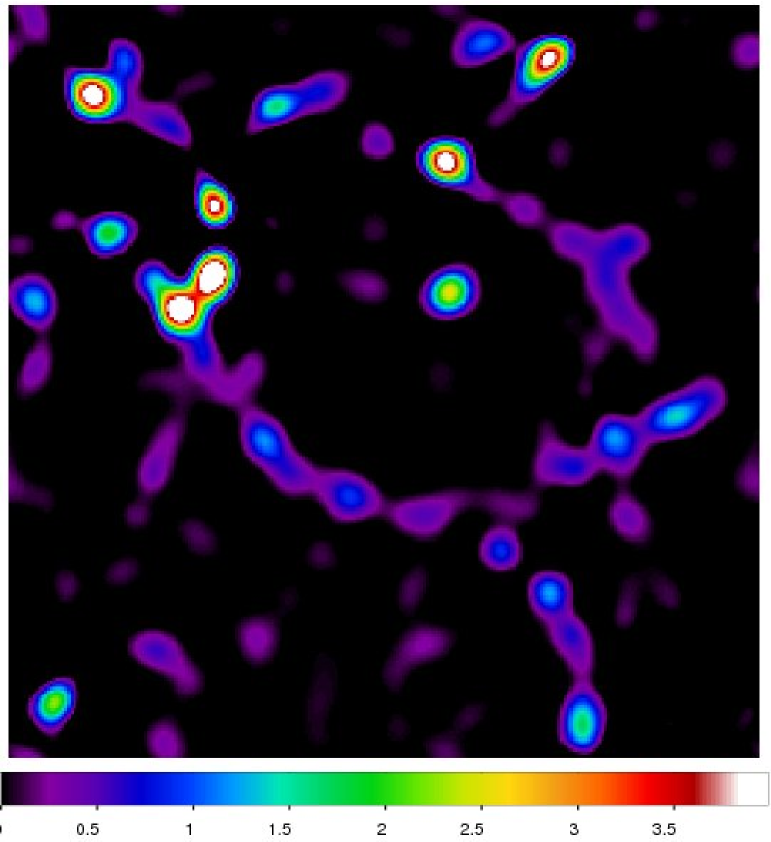
The Figure 9 shows the wavelet decomposition of the same field. Left panels show the high-redshift, and right panels the present epoch decomposition. Wavelets of the order from 6 (upper panels) to 4 (lower panels) are shown, they show waves from the size of the box (100 Mpc) to about 25 Mpc. Only overdensity regions are shown, having densities above unity in mean density units. The colour code is chosen so that it corresponds approximately to the factor of linear growth from to , about 76.
The Figure shows that large-scale waves have almost the same shape in the early and present epoch, only the amplitude has grown as expected. Even the waves of scale 25 Mpc have changed only little – the main features at both epochs are the same, only some filaments have joined during the evolution. This is the well-known effect of structure merging inside superclusters.
It is well known that the Zeldovich approximation of linear growth is the more accurate the earlier epochs and larger waves we consider. Thus it is evident that at epochs earlier than our first epoch discussed here, the growth can be described very accurately by the Zeldovich approximation. In other words: all large-scale structures have had almost no evolution in their positions of density wave features (maxima, minima and other similar features), the evolution of these features is only in the amplitude of the density contrast.
The second important lesson from this analysis concerns the positions of maxima of waves of various scale. When we take a density maximum of the wave of the largest scale, then at the same position ALL waves of smaller scale have also a maximum, i.e. maxima of density waves are synchronized. The same behavior is present in the real density field of Sloan galaxies as discussed above.
Thus wavelet analysis of our simulations demonstrates that positions of high-density objects (superclusters, rich clusters) almost do not change during the whole history of the evolution of structure. In other words: the skeleton of the cosmic web or the supercluster-void network was fixed already at a very early stage, much before the epoch of recombination. This conclusion confirms early analytic calculations by Kofman & Shandarin (1988), where main contours of the cosmic web were found using the theory of adhesion at the epoch which corresponds to the end of the inflation stage and to the start of the Hubble expansion.
Our analysis shows that high-density peaks of the density field are present already at the very early stage of the evolution of the structure. Recent numerical studies show that the formation of first generation stars starts just inside these high-density peaks. The density is highest in protohalos of central clusters of future rich superclusters. Simulations by Gao et al. (2005) have shown that metal-free gas in dark matter haloes of virial temperature about 2000 K and mass M⊙ cools efficiently, thus giving rise to formation of stars. In these high-density regions star formation can start as early as at the redshift . These first generation stars have large masses and evolve rapidly, and at least some of them may explode and spread products of nuclear synthesis to the surrounding “pure” gas.
4 Conclusions
-
•
Superclusters form in regions where large-scale density waves combine in similar locations of maxima.
-
•
Superclusters are the richer the larger is the wavelength of wave synchronization.
-
•
Medium rich superclusters are often formed near minima of waves of scale Mpc by the first overtone of this wave.
-
•
Voids form in regions where large-scale density waves combine in similar locations of minima.
-
•
Large-scale density waves do not change positions of maxima during the evolution, i.e the web of the filaments that defines the final state of the large-scale galaxy distribution is actually present in the initial density inhomogeneities.
-
•
In centers of rich superclusters all waves of various scale have maxima. Since positions of large waves do not change, high local densities were formed already at a high redshift . Thus formation of the first generation stars started in the centers of rich superclusters.
References
- Blumenthal et al. (1982) Blumenthal, G. R., Pagels, H., & Primack, J. R. 1982, Galaxy formation by dissipationless particles heavier than neutrinos, Nature, 299, 37
- Bond et al. (1996) Bond, J. R., Kofman, L., & Pogosyan, D. 1996, How filaments of galaxies are woven into the cosmic web, Nature, 380, 603
- Bond & Szalay (1983) Bond, J. R. & Szalay, A. S. 1983, The collisionless damping of density fluctuations in an expanding universe, ApJ, 274, 443
- Bond et al. (1982) Bond, J. R., Szalay, A. S., & Turner, M. S. 1982, Formation of galaxies in a gravitino-dominated universe, Physical Review Letters, 48, 1636
- Bond et al. (1983) Bond, J. R., Szalay, A. S., & White, S. D. M. 1983, How galaxies acquire their neutrino haloes, Nature, 301, 584
- Chernin (1981) Chernin, A. D. 1981, The rest mass of primordial neutrinos, and gravitational instability in the hot universe, AZh, 58, 25
- Cowsik & McClelland (1973) Cowsik, R. & McClelland, J. 1973, Gravity of Neutrinos of Nonzero Mass in Astrophysics, ApJ, 180, 7
- de Vaucouleurs et al. (1976) de Vaucouleurs, G., de Vaucouleurs, A., & Corwin, H. G. 1976, Second reference catalogue of bright galaxies (University of Texas Monographs in Astronomy, Austin: University of Texas Press)
- Doroshkevich et al. (1975) Doroshkevich, A. G., Joeveer, M., & Einasto, J. 1975, Conference: Hidden Mass in the Universe, AZh, 52, 1113
- Doroshkevich & Khlopov (1984) Doroshkevich, A. G. & Khlopov, M. I. 1984, Formation of structure in a universe with unstable neutrinos, MNRAS, 211, 277
- Doroshkevich et al. (1980) Doroshkevich, A. G., Zeldovich, Y. B., Syunyaev, R. A., & Khlopov, M. Y. 1980, Astrophysical Implications of the Neutrino Rest Mass - Part Three - Nonlinear Growth of Perturbations and the Missing Mass, Soviet Astronomy Letters, 6, 257
- Einasto et al. (2003) Einasto, J., Hütsi, G., Einasto, M., et al. 2003, Clusters and superclusters in the Sloan Digital Sky Survey, A&A, 405, 425
- Einasto et al. (1974a) Einasto, J., Kaasik, A., & Saar, E. 1974a, Dynamic Evidence on Massive coronas of galaxies, Nature, 250, 309
- Einasto et al. (1974b) Einasto, J., Saar, E., Kaasik, A., & Chernin, A. D. 1974b, Missing mass around galaxies - Morphological evidence, Nature, 252, 111
- Einasto et al. (2001) Einasto, M., Einasto, J., Tago, E., Müller, V., & Andernach, H. 2001, Optical and X-Ray Clusters as Tracers of the Supercluster-Void Network. I. Superclusters of Abell and X-Ray Clusters, AJ, 122, 2222
- Einasto et al. (2008) Einasto, M., Saar, E., Martínez, V. J., et al. 2008, Toward Understanding Rich Superclusters, ApJ, 685, 83
- Gao et al. (2005) Gao, L., White, S. D. M., Jenkins, A., Frenk, C. S., & Springel, V. 2005, Early structure in CDM, MNRAS, 363, 379
- Gramann (1988) Gramann, M. 1988, Structure and formation of superclusters. VIII - Evolution of structure in a model with cold dark matter and cosmological constant, MNRAS, 234, 569
- Gunn & Tinsley (1975) Gunn, J. E. & Tinsley, B. M. 1975, An accelerating Universe, Nature, 257, 454
- Jõeveer & Einasto (1978) Jõeveer, M. & Einasto, J. 1978, Has the universe the cell structure, in IAU Symposium, Vol. 79, Large Scale Structures in the Universe, ed. M. S. Longair & J. Einasto, 241
- Jaaniste & Saar (1975) Jaaniste, J. & Saar, E. 1975, On the stellar component of galactic coronae, Tartu Astr. Obs. Publ., 43, 216
- Kofman & Shandarin (1988) Kofman, L. A. & Shandarin, S. F. 1988, Theory of adhesion for the large-scale structure of the universe, Nature, 334, 129
- Kofman & Starobinskii (1985) Kofman, L. A. & Starobinskii, A. A. 1985, Effect of the Cosmological Constant on Largescale Anisotropies in the Microwave Background, Soviet Astronomy Letters, 11, 271
- Komberg & Novikov (1975) Komberg, B. V. & Novikov, I. D. 1975, Nature of the halos of spiral galaxies, Soviet Astronomy Letters, 1, 47
- Martínez & Saar (2002) Martínez, V. J. & Saar, E. 2002, Statistics of the Galaxy Distribution, ed. V. J. Martínez & E. Saar (Chapman & Hall/CRC)
- Melott et al. (1983) Melott, A. L., Einasto, J., Saar, E., et al. 1983, Cluster analysis of the nonlinear evolution of large-scale structure in an axion/gravitino/photino-dominated universe, Physical Review Letters, 51, 935
- Oort (1983) Oort, J. H. 1983, Superclusters, ARA&A, 21, 373
- Pagels & Primack (1982) Pagels, H. & Primack, J. R. 1982, Supersymmetry, cosmology, and new physics at teraelectronvolt energies, Physical Review Letters, 48, 223
- Parijskij (1978) Parijskij, Y. N. 1978, Search for Primordial Perturbations of the Universe: Observations with RATAN-600 Radio Telescope, in IAU Symposium, Vol. 79, Large Scale Structures in the Universe, ed. M. S. Longair & J. Einasto, 315
- Peebles (1971) Peebles, P. J. E. 1971, Physical cosmology (Princeton Series in Physics, Princeton, N.J.: Princeton University Press, 1971)
- Peebles (1982) Peebles, P. J. E. 1982, Primeval adiabatic perturbations - Effect of massive neutrinos, ApJ, 258, 415
- Sandage & Tammann (1981) Sandage, A. & Tammann, G. A. 1981, A revised Shapley-Ames Catalog of bright galaxies (Washington: Carnegie Institution, 1981, Preliminary version)
- Stoughton et al. (2002) Stoughton, C., Lupton, R. H., Bernardi, M., et al. 2002, Sloan Digital Sky Survey: Early Data Release, AJ, 123, 485
- Szalay & Marx (1976) Szalay, A. S. & Marx, G. 1976, Neutrino rest mass from cosmology, A&A, 49, 437
- Tarenghi et al. (1978) Tarenghi, M., Tifft, W. G., Chincarini, G., Rood, H. J., & Thompson, L. A. 1978, The Structure of the Hercules Supercluster, in IAU Symposium, Vol. 79, Large Scale Structures in the Universe, ed. M. S. Longair & J. Einasto, 263
- Tifft & Gregory (1978) Tifft, W. G. & Gregory, S. A. 1978, Observations of the Large Scale Distribution of Galaxies, in IAU Symposium, Vol. 79, Large Scale Structures in the Universe, ed. M. S. Longair & J. Einasto, 267
- Tremaine & Gunn (1979) Tremaine, S. & Gunn, J. E. 1979, Dynamical role of light neutral leptons in cosmology, Physical Review Letters, 42, 407
- Tully & Fisher (1978) Tully, R. B. & Fisher, J. R. 1978, A Tour of the Local Supercluster, in IAU Symposium, Vol. 79, Large Scale Structures in the Universe, ed. M. S. Longair & J. Einasto, 214
- Turner et al. (1984) Turner, M. S., Steigman, G., & Krauss, L. M. 1984, Flatness of the universe - Reconciling theoretical prejudices with observational data, Physical Review Letters, 52, 2090
- White et al. (1983) White, S. D. M., Frenk, C. S., & Davis, M. 1983, Clustering in a neutrino-dominated universe, ApJ, 274, L1
- White et al. (1987) White, S. D. M., Frenk, C. S., Davis, M., & Efstathiou, G. 1987, Clusters, filaments, and voids in a universe dominated by cold dark matter, ApJ, 313, 505
- York et al. (2000) York, D. G., Adelman, J., Anderson, Jr., J. E., et al. 2000, The Sloan Digital Sky Survey: Technical Summary, AJ, 120, 1579
- Zehavi et al. (2002) Zehavi, I., Blanton, M. R., Frieman, J. A., et al. 2002, Galaxy Clustering in Early Sloan Digital Sky Survey Redshift Data, ApJ, 571, 172
- Zeldovich (1970) Zeldovich, Y. B. 1970, Gravitational instability: An approximate theory for large density perturbations., A&A, 5, 84
- Zeldovich (1975) Zeldovich, Y. B. 1975, Deuterium of cosmological origin and the mean density of the universe, Soviet Astronomy Letters, 1, 5
- Zeldovich (1978) Zeldovich, Y. B. 1978, The theory of the large scale structure of the universe, in IAU Symposium, Vol. 79, Large Scale Structures in the Universe, ed. M. S. Longair & J. Einasto, 409
- Zeldovich et al. (1982) Zeldovich, Y. B., Einasto, J., & Shandarin, S. F. 1982, Giant voids in the universe, Nature, 300, 407