The 0.9 mJy sample: A mid-infrared spectroscopic catalog of 150 infraredluminous, 24 micron selected galaxies at 0.3z3.5
Abstract
We present a catalog of mid-infrared (MIR) spectra of 150 infrared (IR) luminous galaxies in the Spitzer extragalactic first look survey obtained with the IR spectrograph on board the Spitzer Space Telescope. The sample is selected to be brighter than 0.9 mJy at 24 µm and it has a redshift distribution in the range [0.3,3.5], with a peak at 1. It primarily comprises ultraluminous IR galaxies at z1 and luminous IR galaxies at z1, as estimated from their monochromatic rest-frame 14 µm luminosities. The number of sources with spectra that are dominated by an active galactic nucleus (AGN) continuum is 49, while 39 sources have strong, star-formation related features. For this classification, we used the equivalent width (EW) of the 11.3 µm polycyclic aromatic hydrocarbon (PAH) feature. Several intermediate and high starbursts have higher PAH EW than local ULIRGs, which is indicative of an elevated star formation activity. Moreover, an increase in the AGN activity is observed with increasing and luminosity, based on the decreasing EW of PAHs and the increasing [Ne III]/ [Ne II] ratio. Spectral stacking leads to the detection of weak features such as the 3.3 µm PAH, the H2 0-0 S(1) and S(3) lines, and the [Ne V] line. We observe differences in the flux ratios of PAHs in the stacked spectra of IR-luminous galaxies with redshift or luminosity, which cannot be attributed to extinction effects since both the depth and the profile of the silicate absorption feature at 9.7 µm remain the same at 1 and 1. When placing the observed galaxies on IR color-color diagrams, we find that the wedge defining AGN comprises most sources with continuum-dominated spectra, but also contains many starbursts and sources with strong silicate absorption at 9.7 µm. The comparison of the 11.3 µm PAH EW and the -band effective radius, measured from Hubble Space Telescope data, indicates that sources with EWs2 µm, are typically more extended than 3 kpc. However, there is no strong correlation between the MIR spectral type and the near-IR extent of the sources.
1 Introduction
Infrared (IR) bright galaxies at intermediate and high redshift, i.e., 0.53, play an important role in driving galaxy evolution since they are in the process of forming new stars (Carilli et al. 2005; Solomon & Van den Bout 2005; Tacconi et al. 2006) or growing black holes (e.g. Alexander et al. 2008, Sajina et al. 2008), and since they are often associated with galactic interactions (Zheng et al. 2004; Dasyra et al. 2008a). The number density of both IR-bright galaxies and galactic interactions evolves strongly with redshift, increasing to at least 1 (Chary & Elbaz 2001; Le Floc’h et al. 2005; Pérez-González et al. 2005; Conselice 2006; Kartaltepe et al. 2007). This cosmologically significant population of galaxies with IR-excess, which often comprises galaxies that are selected in sub-millimeter wavelengths (Valiante et al. 2007; Menéndez-Delmestre et al. 2007; 2009; Pope et al. 2008) or that have extremely red colors in the optical and near-infrared (NIR) wavelengths (Yan et al. 2004b; Daddi et al. 2005; Papovich et al. 2006), is believed to form many of the early-type galaxies (Daddi et al. 2004 Yan et al. 2004a; Swinbank et al. 2006) and possibly some of the late-type galaxies (Hammer et al. 2005) that we observe in the local Universe.
Thousands of new IR-bright galaxies were discovered with the Spitzer Space Telescope in the 24 µm catalog of various surveys (Fadda et al. 2004; Papovich et al. 2004; Rigby et al. 2004; Houck et al. 2005; Surace et al. 2005) thanks to the high sensitivity of the Multiband Imaging Photometer for Spitzer (MIPS). Many of these systems were spectroscopically followed up with the IR spectrograph (IRS) on board Spitzer to determine their redshifts and to reveal the origin of their IR emission. The determination from mid-infrared (MIR) spectra was very efficient because of the bright and broad polycyclic aromatic hydrocarbon (PAH) features that can be observed within the IRS spectral range, 5-35 µm, for sources at 3.5. This led to the discovery of a large number of galaxies at 13, complementing previous studies that aimed to populate the so-called ’redshift desert’ of optical spectroscopy (Adelberger et al. 2004; Steidel et al. 2004).
The IRS spectra often revealed different powering mechanisms for the MIR emission of these distant IR-bright sources because of the different selection techniques that were applied for each program. Dey et al. (2008) imposed a high 24 µm flux, f24, to -band flux ratio to select systems more obscured than local ultraluminous IR galaxies (ULIRGs). They detected a large number of sources with continuum-dominated spectra, especially for f241 mJy (Dey et al. 2009). Other authors used a radio flux cutoff that also led to the identification of several active galactic nuclei (AGN; Martínez-Sansigre et al. 2008; Weedman et al. 2006). Star-forming galaxies, as determined by their PAH emission, were found in samples with different selection criteria. Yan et al. (2005; 2007) identified new 13 starbursts by imposing that the ratio of their 24 µm flux to their 8 µm flux and the ratio of their 24 µm flux to their -band flux are as low as those of local starbursts. Farrah et al. (2008), Huang et al. (2009), and Desai et al. (2009) collected IRS spectra for sources with a flux excess in Infrared Array Camera (IRAC) channels that corresponded to the 1.6 µm stellar bump. Their samples comprised a large number of 2 star-forming galaxies. Sub-millimeter galaxies were also followed-up with IRS and were found to be primarily star-forming, but to also have a nonnegligible AGN contribution to their MIR luminosity (Valiante et al. 2007; Menéndez-Delmestre et al. 2007; 2009; Pope et al. 2008). Hernán-Caballero et al. (2009) observed with IRS a sample of 1 galaxies that have detections in several optical bands. Their sample comprised several composite systems, i.e., systems with weak PAH or silicate absorption feature(s) and an AGN continuum.
The goal of this project is to use a purely flux-limited sample of 150 IR-bright galaxies spanning a wide range to investigate what are the processes that lead to an excess of IR activity at different epochs. We have been awarded time with Spitzer and with the Hubble Space Telescope (HST) to collect IR imaging and spectroscopic datasets to address what type of galaxies undergo IR-luminous phases at different . Our program aims to investigate whether there are changes in the interstellar medium properties of these galaxies with look-back time, and whether there is any relation between the dominant MIR emission mechanism and the morphologies of these galaxies. In this paper, we present the catalog of the IRS spectra and we primarily study the behavior of MIR line and feature properties as a function of .
The rest of this paper is organized as follows. In § 2 we describe the sample selection technique, followed by the presentation of ancillary and complementary datasets for the sample in § 3. The methods that we used to reduce and analyze the spectra are presented in § 4. Results are presented in § 5, followed by a discussion on MIR spectral properties with and a summary of our conclusions in § 6 and § 7, respectively. Throughout this paper we use a CDM cosmology with =70 km s-1 Mpc-1, =0.3, and =0.7.
2 Sample selection
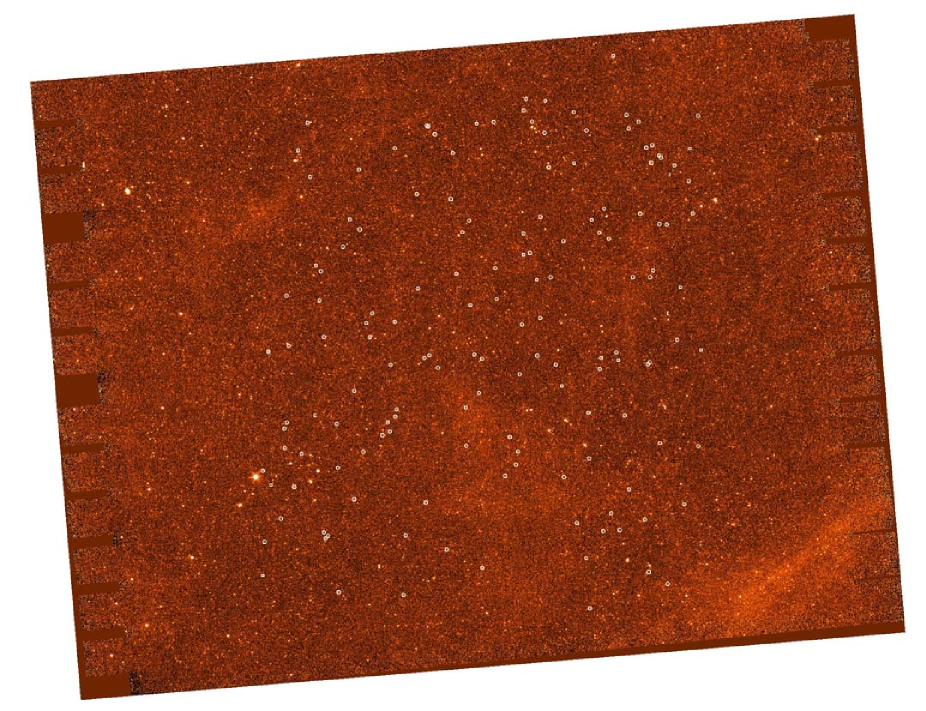
The sample comprises 150 sources that were selected from the 24 µm mosaic of the 3.7 deg2 Spitzer extragalactic first look survey (XFLS; Fadda et al. 2006). It was selected to be flux limited with a lower flux threshold of 0.9 mJy at 24 µm. To facilitate the selection of high- objects, we observed only sources that are fainter than 19 Vega magnitudes in the band. We also restricted the selection to an area that covers approximately three quarters of the total XFLS field of view and that is located at the center of the field (Fig. 1). An advantage of selecting sources from the central XFLS region is that it comprises a 0.25 deg2 field with deep IRAC datasets (Lacy et al. 2005), the so-called ’verification zone’. Moreover, IRS spectra have also been acquired for several sources with f240.9 mJy in the same region as part of other programs (PIs Borys, Fazio, Lacy, Lagache, Martinez-Sansigre, Weedman, Yan). These archival data can be merged with data from our program, with ID 20629, to create an extended sample that is highly complete at faint optical magnitudes and that will be used for luminosity function studies (Yan et al. 2009, in preparation).
In total, new IRS observations were executed for 150 XFLS sources as part of the program with ID 20629. This led to the acquisition of MIR spectra for one out of every three extragalactic sources in the central XFLS field with f24mJy and mR20 Vega mags (Fig. 2). Similarly, this sample is 57% complete for mR22 Vega magnitudes within the selected area (Fig. 2). The datasets were collected during the second Spitzer cycle. The coordinates of the observed sources and their integration times per mode are presented in Table 1. The total integration time per target varied from 25 mins to 2 hours on-source. The integration times were longer at wavelengths 14 µm than at wavelengths 14 µm to compensate for the lower sensitivity of the instrument at long wavelengths.
3 Ancillary data collection and reduction
The XFLS region has a plethora of ancillary datasets. Fadda et al. (2004) presented an -band mosaic with a corresponding catalog that has a depth of 25.5 Vega magnitudes. Imaging datasets for all IRAC channels, at 3.6, 4.5, 5.8, and 8.0 µm, are available in the Lacy et al. (2005) catalogs. Each IRAC flux is measured within a fixed aperture of either 60, 93, 149, or 244 that is optimally determined for each galaxy and band (Lacy et al. 2005). When possible, we used the deep ’verification-zone’ IRAC data. The ancillary datasets that we compiled, together with the MIPS 24 µm fluxes of the sources (Fadda et al. 2006) are presented in Table 1.
To enhance the accuracy of the analysis presented in this paper, we examined the proper identification of the counterpart of each 24 µm source in all IRAC channels. We remeasured IRAC fluxes or limits for 15% of the galaxies because of counterpart misidentification or overlap of nearby sources. We deblended IRAC overlapping sources when one of them was a star or a galaxy that did not contribute to the MIPS 24 µm flux. We also deblended overlapping sources when the 24 µm emission peaked near one of the sources, unless their HST image showed clear evidence of interactions between them. Vice versa, we typically merged the fluxes of two IRAC detections within the 24 µm beam if the 24 µm flux peaked between them. Moreover, all IRAC limits were remeasured, since Lacy et al. (2005) used statistical completeness limits for their catalogs.
To perform aperture photometry, we used the Sextractor package (Bertin & Arnouts 1996) with the same parameters as those used by Lacy et al. (2005), except for the background and the minimum deblending parameter. We computed the background locally (within 1 square arc minute) and we set the deblending parameter to 0.001, to easily deblend overlapping sources. We used the optimal extraction aperture of each source, as chosen by Lacy et al. (2005), with the corresponding aperture flux correction for the specific channel. To measure the flux limit of a source that is undetected at a given channel, we used its aperture at the nearest channel(s) in which the source was detected. If two such apertures existed, we chose the largest of the two. To deblend overlapping sources, we decomposed them into two or more point sources using the package GALFIT (Peng et al. 2002). After determining the intensity of each individual point-spread-function (PSF), we subtracted all PSF models that were unrelated to the 24 µm source. We then measured the flux of the deblended counterpart of the 24 source using Sextractor (with the same parameters as above), to avoid systematic effects in our measurements.
A cleaning analysis similar to that performed for the IRAC catalogs was also performed for the -band catalog fluxes of Fadda et al. (2006). We remeasured the -band fluxes for sources that were erroneously identified as the counterpart of the 24 µm source. Whenever we merged the IRAC fluxes of two overlapping sources, we also merged their -band fluxes. To measure -band fluxes, we used Sextractor with the zeropoints of the original catalog. We kept most parameters identical to those selected by Fadda et al. (2006), including the automatic determination of the optimal aperture. We set the area that is used to compute the background flux to 1 square arc minute. We used deblending parameter values in the range [0.1,0.001] to ensure the proper deblending of nearby sources. In Table 1, we summarize all remeasured IRAC and -band fluxes or limits.
Shallow MIPS 70 and 160 µm catalogs are also available for the XFLS (Frayer et al. 2006). We were awarded time to complement the 70 µm catalog with deeper MIPS observations for two thirds of the sources in our sample. The MIPS datasets will be presented in Sajina et al. (2009, in preparation), together a multi-wavelength spectral energy distribution (SED) fitting that aims on the computation of the bolometric luminosities of the sources.
As part of the same large, joint Spitzer and HST program, we also acquired HST -band images of several sources with the Near Infrared Camera and Multi-Object Spectrometer (NICMOS). In total, NICMOS successfully observed 102 sources. We processed the NICMOS images similar to those in Dasyra et al. (2008a), and we used them to measure effective radii using Sextractor (Table 1; Zamojski et al. 2009, in preparation). The NICMOS data and their reduction techniques will be presented in detail in Zamojski et al. (2009, in preparation).
4 IRS data reduction and analysis
4.1 Data reduction procedures
The IRS data reduction began with the processing of the basic calibration datasets (BCDs) by the IRS pipeline version 15.3. The pipeline converts the up-the-ramp exposures to a single image and then performs dark subtraction, linearity correction, flat division and other instrument-related corrections to the image. Details on the pipeline products can be found at the IRS data and pipeline handbooks that are available at the Spitzer Science Center (SSC) webpage111 http://ssc.spitzer.caltech.edu/irs/dh/dh32.pdf and http://ssc.spitzer.caltech.edu/irs/dh/irsPDDmar30.pdf . The pipeline provides the two-dimensional spectral images together with their uncertainties and mask files for each of nod position and wavelength range.
There are two wavelength ranges for the low-resolution mode of the IRS spectrograph: the short-low (SL) and long-low (LL) modes that can obtain datasets in the wavelength ranges [5.2,14.7] µm and [14.3,35.0] µm, respectively. For LL data, we removed the sky background for each order and nod position using IDL routines that compute the median sky image for all other orders and nod positions of the same source. Because in SL we only obtained order 1 data, we simply subtracted one nod position from the other to remove the sky background. The sky subtraction was performed with the code used by Yan et al. (2005). We then performed an automated first-order rejection of negative bad pixels, and an inspection and manual removal (when necessary) of positive bad pixels that deviated by more than 3 standard deviations from the median value of the spectrum. The manual rejection of bad pixels was performed using the IDL routine IRSCLEAN222 http://ssc.spitzer.caltech.edu/postbcd/irsclean.html provided by the SSC. The values of bad pixels were interpolated from those of their neighbors. We extracted the spectrum of each nod position using the SSC package SPICE333http://ssc.spitzer.caltech.edu/postbcd/spice.html. For the extraction of the spectrum, we used the ’optimal’ technique, which is recommended for faint source spectroscopy. This technique maximizes the signal-to-noise ratio of the spectrum by weighting the spatial pixels at any wavelength prior adding them. The code uses the spatial profile of a point source to compute the appropriate weights. The extracted one-dimensional spectrum and its uncertainty image are then flux calibrated. Aperture-loss and slit-loss corrections are applied based on a point-source profile. After extracting the spectrum for both nod positions of each spectral order, we computed the average spectrum for both nod positions and trimmed all (noisy) edges. We merged the final spectra and interpolated the flux values in the wavelength range where different orders overlap to the wavelength values of the order with the lower spectral resolution.
4.2 Analysis techniques
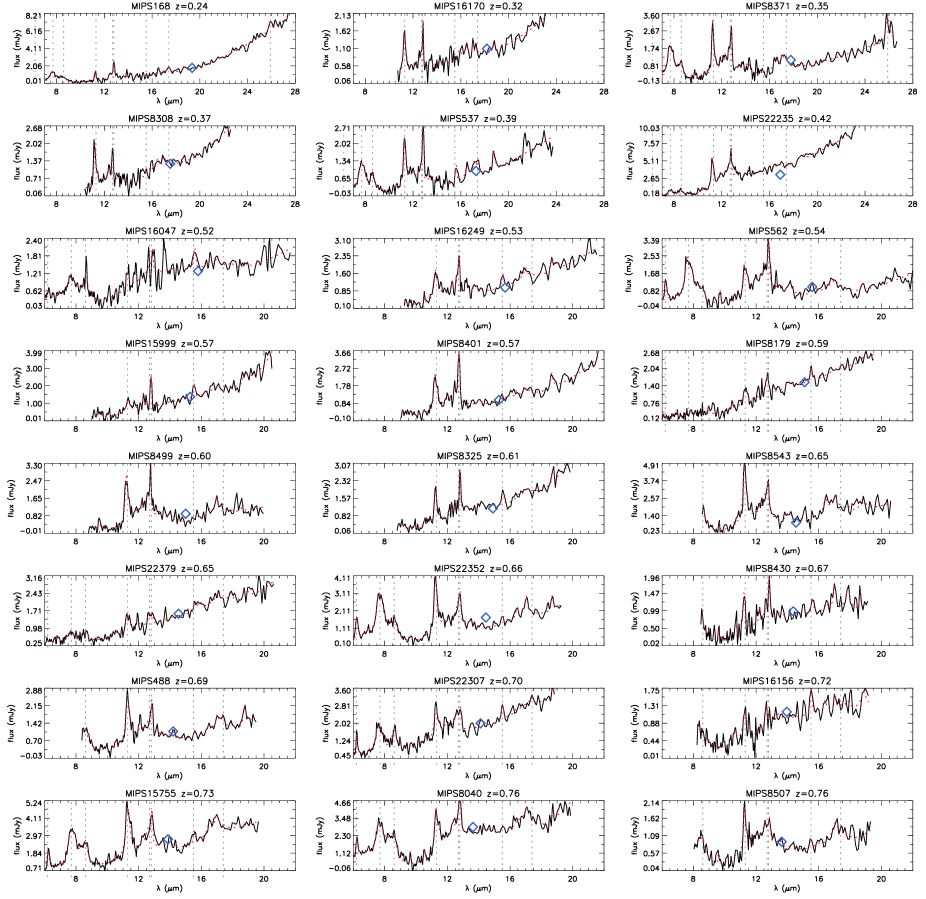
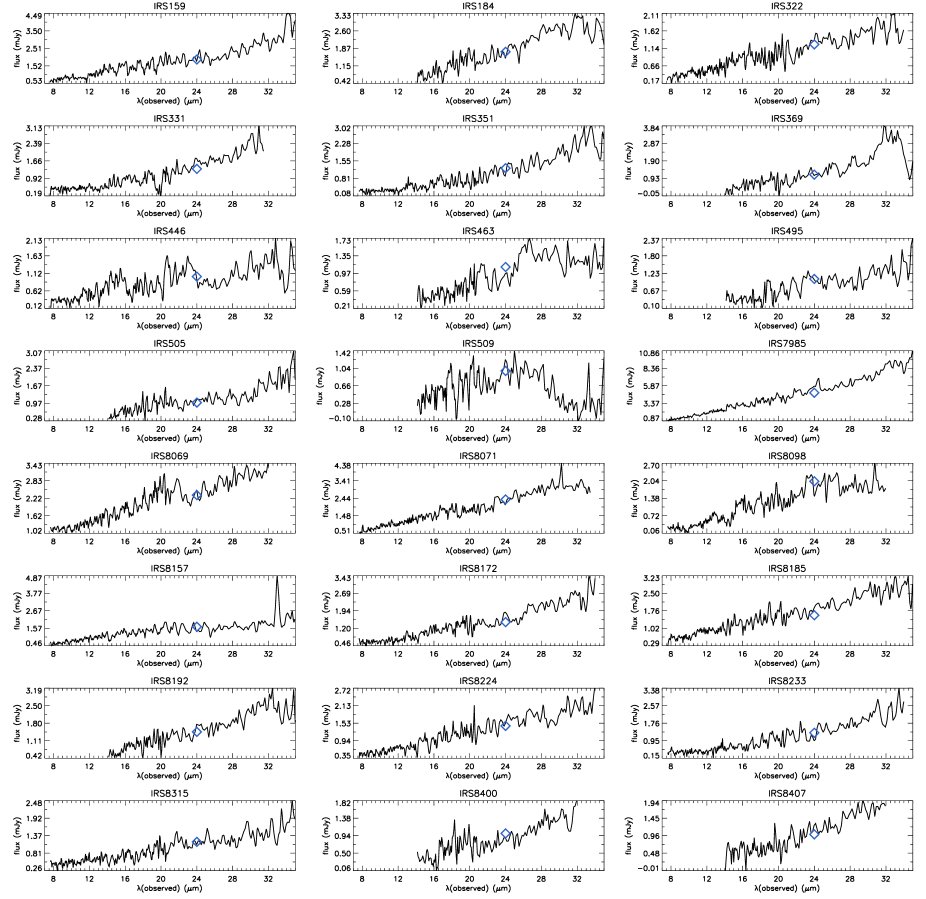
To compute the redshift of each source we first ran a code that simultaneously fits MIR fine-structure lines and PAHs using Gaussian and Lorentzian functions, respectively, using an initial redshift guess. After fitting the spectrum, the code returns the best solution by averaging the redshift of all 3- detected lines and features that are within 0.2 µm from their expected wavelength. In Table 2, we summarize the confidence and errors of all measured values. We define the measurement of a source reliable when its spectrum has more than two 3- detected emission lines or features, or silicate absorption at 9.7 µm, or a combination of the two (see source confidence classifications a, b, and c in Table 2). All sources with uncertain redshift measurement, e.g., because more than one redshift solutions are plausible, are excluded from the analysis in this paper. The fully reduced spectra are presented in the rest frame for the 95 sources with reliable measurement (Fig. 3), and in the observed frame for the 55 sources with unknown or uncertain redshift (Fig. 4).
For sources with reliably measured redshift, we ran the fitting algorithm PAHFIT (Smith et al. 2007) to derive the fluxes of lines and features and the optical depth of the obscuring medium in the MIR. PAHFIT decomposes MIR spectra into emission originating from ionic and molecular lines, PAH features, dust continuum and stellar continuum. All components are multiplied with an extinction curve prior to being added. The best-fit solution of the observed spectrum is computed using a minimization method. The code returns the best-fit parameters for each of the components, including the line or feature fluxes and the optical depth of the silicate absorption feature at 9.7 µm, 9.7.
The rest-frame spectrum of each source was used as input to PAHFIT. The spectral flux per frequency was divided by a factor of (1+z) so that all line fluxes are correctly measured at rest frame, where PAHFIT performs all line flux computations. We added all available IRAC datapoints to the spectra, so that PAHFIT can best constrain the stellar continuum emission. Since the default PAHFIT parameters were optimized to fit local low-luminosity sources, we modified several parameters to make the code appropriate for high-z IR-bright galaxies. To include a rising AGN continuum for 10 µm, we allowed the dust grains to have temperatures of 400,600, 800,1000,1200, or 1400K, which are higher than the default temperatures that PAHFIT uses (300K). By default, PAHFIT returns extinction-corrected line fluxes. Because the geometric distribution of dust grains in high- obscured galaxies is not known, we measured and used throughout this paper fluxes that are not extinction corrected. For this reason, we run PAHFIT assuming a screen Galactic center extinction (Chiar & Tielens 2006), and we then multiplied the measured fluxes with the extinction curve value at the center of each line or PAH complex. The PAHFIT best-fit solution for each spectrum is presented in Fig. 3.
To measure line or feature equivalent widths (EWs), we divided the best-fit profile of each individual line or feature, which has no continuum, by the combined continuum of dust and stars. We then integrated the result as a function of wavelength. Fluxes (or 3- flux limits) and EWs of the most common bright lines and features in the IRS spectra are summarized in Tables 3 and 4. Fluxes of lines or features whose continuum cannot be well determined are not tabulated. For example, we do not present an 8.6 µm PAH flux measurement when silicate absorption is present and the continuum shortward of the 7.7 µm PAH is outside the spectral range.
We note that variations can exist between the fluxes and the signal-to-noise ratios of features that are detected with the simple fitting algorithm that we used to derive redshifts (Table 2) and those of features that are detected with PAHFIT (Tables 3 and 4) because of different continuum assumptions. To get an estimate of the deviations in the fluxes provided by various codes, we also ran the fitting algorithm of Sajina et al. (2007) for all spectra with well-determined redshifts. While we found no significant differences for fluxes of PAHs at 10 µm, systematic differences were observed for the short-wavelength features. The fluxes of both the 6.2 and the 7.7 µm PAHs, when derived with PAHFIT, are on average 1.5 times higher than those measured with the code of Sajina et al. (2007). The discrepancies are high for the 7.7 µm PAH because it is located at the edges of the 9.7 µm absorption feature and because it is partially blended with the 8.6 µm PAH. The statistics are poor for the 6.2 µm PAH because it is either undetected or outside the spectral range in many sources. Because we would like to use diagnostics that depend little on the choice of model (continuum) parameters and that are applicable to the majority of the sources in this sample, we used the EW of the 11.3 µm feature, EW11.3, to define sources with MIR spectra resembling those of AGN or starbursts (see also Desai et al. 2007). Despite that the 11.3 µm feature can be heavily obscured, the EW11.3 measurements presented in this paper are independent of the selected extinction law because the continuum and the PAHs are equally obscured for a screen geometry. Different geometric distributions of the obscuring medium could affect EW11.3. Still, we opt to use it to distinguish the MIR spectral type of the sources because otherwise we would be restricted in using the EW of the 12.7 µm PAH. This would render our classification highly uncertain because the 12.7 µm PAH is blended with the [Ne II] line at 12.81 µm.
To determine the EW11.3 thresholds that we used to define AGN and starbursts, we ran PAHFIT for the local templates presented in Armus et al. (2007). We used the same PAHFIT parameters for the local templates as for the sources in our sample. Based on this calibration, we chose to classify as star-forming galaxies those with EW11.30.8 µm. This threshold selects sources with star-formation contribution to their MIR luminosity that is likely to exceed 90%, as in NGC 6240, IRAS 12112+0305, and IRAS 14348-1447. Similarly, we define as AGN the sources with EW11.30.1 µm, since this cutoff comprises sources with AGN contribution to their MIR luminosity that is likely to exceed 90%, as in IRAS 05189-2524, IRAS08572+3915, Mrk 231, Mrk 463, and Mrk 1014 (Armus et al. 2007).
5 Results
5.1 Redshift distribution and estimated IR luminosities of the sources
Using redshifts derived from the IRS spectra, we find that the redshift distribution of the sources in this sample peaks at 1, with average and median values of 1.12 and 0.96, respectively. The range that this sample spans is fairly high, with the lowest and the highest source being at =0.3 and 3.5, respectively (Fig. 5).
To obtain an estimate of each source’s bolometric IR luminosity, , we used the 14 continuum luminosity, which is available for most sources and which is little affected by PAH emission. We used the relation between L14 and presented in Sajina et al. (2008) because of the similarities in the IRS spectra of the two IR-bright galaxy populations. We find that most sources at 1 are ULIRGs, with 1012 . Most sources at 1 are luminous infrared galaxies (LIRGs), with 1011 1012 (Fig. 6). Because of the scatter in the relation that we used, the computation of from L14 can be uncertain by a factor of at least 2.
5.2 Detection of weak lines through spectral stacking
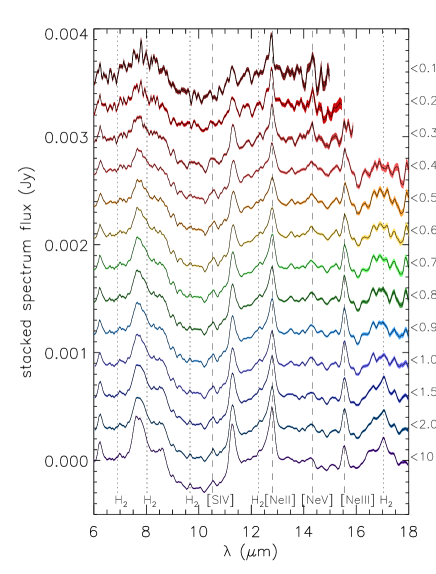
To investigate for weak lines that are hard to detect in individual spectra of high- galaxies, we performed a stacking analysis using sources with well determined redshifts. We began the stacking procedure by dividing the flux (per frequency) of each source by a factor of (1+) in order to correctly measure line fluxes at the rest frame. We determined the continuum of each source by fitting a spline function at feature-free wavelengths and subtracted it, so that the weak features that we are trying to detect are not diluted into the continuum of the brightest galaxies. Moreover, adding spectra with different MIR continuum slopes could create artificial bumps in the resulting spectrum at the wavelengths where the individual spectra start or end. We then stacked the continuum-subtracted spectra by computing their weighted average using their uncertainty images as weights. To enhance the probability of detecting weak lines, we stacked sources that already have line detections. For this reason, we used the spectra of all sources with [Ne II] emission, which originates from an ion that is found both in star-forming regions and in AGN.
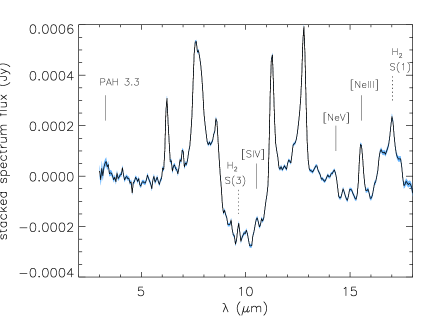
The resulting stacked spectrum is presented in Fig. 7. It contains molecular lines, i.e., the H2 0-0 S(1) and S(3) lines, detected with fluxes of 2.65 (0.30)10-23 W cm-2 and 2.42 (0.41)10-23 W cm-2, respectively. It is unclear whether the line at 6.9 µm originates from the H2 0-0 S(5) transition, since the H2 line could be blended with [Ar II] at 6.99 µm. Assuming that the stacked spectrum is at 0.85, which is the average redshift of the individual spectra used for its construction, we find that the S(1) and S(3) line luminosities are 2.42 (0.27) and 2.21 (0.37) , respectively. Using the median value of the sources that were used for the computation of the stacked spectrum, 2.21012 , we find that the ratio of the S(1) and S(3) line luminosities to is of order 10-4, as in several local ULIRGs (Higdon et al. 2006). We computed the excitation temperature and the mass of the warm molecular hydrogen using the S(1) and S(3) line luminosities and the technique and assumptions of Higdon et al. (2006). We find that the H2 gas has an excitation temperature of 360 (5) K and a mass of 2.06 ( 0.26)108 , similar to those in local IR-bright galaxies (Rigopoulou et al. 2002; Higdon et al. 2006).
Spectral stacking also leads to the detection of a line at 14.32 µm (Fig. 7), which corresponds to [Ne V] and which is frequently found in AGN. [Ne V] can be blended with [Cl II] at 14.37 µm, which is primarily found in spectra of star-forming galaxies because Cl II only needs 23.81 eV to be ionized to Cl III. To test whether this line primarily originates from Ne V or Cl II ions, we ran our stacking algorithm in a manner than can allow us to investigate how the stacked spectrum changes for different AGN and star-formation luminosities. For this reason, we stacked sources with different 11.3 µm PAH strength (Fig. 8). We find that the flux of the line increases with decreasing EW11.3 (or with increasing AGN contribution to the MIR luminosity). Specifically, the line flux increases from 4.0210-23 W cm-2 for sources with EW11.30.5 µm to 9.2910-23 W cm-2 for sources with EW11.30.1 µm. This indicates that a significant fraction of the flux originates from an ion of high ionization potential, i.e., [Ne V]. Since the ionization potential of [Ne V] is 97.12 eV, its detection provides direct evidence for the presence of an AGN in some of the sources in this sample (Dasyra et al. 2008b).
We also investigated whether we can detect the PAH feature at 3.3 µm that has been seen in several local galaxies (Sturm et al. 2000; Imanishi 2002; Imanishi et al. 2006; Risaliti et al. 2006). The PAH feature was detected at 5 levels in the stacked spectrum of sources with [Ne II] detections (Fig. 7) with a flux of 3.3710-22 W cm-2. Since the flux of the 6.2 µm PAH is 7.5010-22 W cm-2, the flux ratio of the 6.2 µm PAH to the 3.3 µm PAH is 2.22, which is plausible for PAHs that are mainly neutral (Draine & Li 2007). Using 0.85 and 2.21012 for the stacked spectrum, we find that the 3.3 µm feature luminosity, L3.3, is 3.07 or 0.001 . The 6.2 µm feature luminosity, L6.2, is 6.84109 . The ratio L6.2/ is 0.003, which is typical for local starbursts (Peeters et al. 2004). The 3.3 µm feature has also been detected with comparable L3.3/ and L6.2/L3.3 ratios in an XFLS source with deep IRS spectra (Sajina et al. 2009, in preparation). Still, the L3.3/ ratio is a factor of 3 higher than the highest L3.3/ ratio found in a local ULIRG (Imanishi et al. 2006; 2008). This difference could be due to uncertainties in the determination of or due to changes in the relative PAH strengths with (see § 6).
5.3 AGN vs star-formation properties
Using the EW11.3 threshold of 0.8 µm, we determined that the number of sources that have MIR spectra resembling those of starbursts is 39 (or 26%). Similarly, the number of sources that are continuum-dominated is 49 (or 33%). Of these 49 sources, 31 have featureless MIR spectra and no measurement.
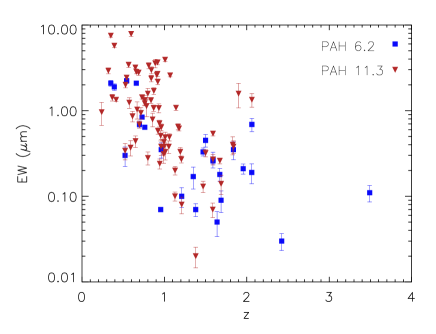
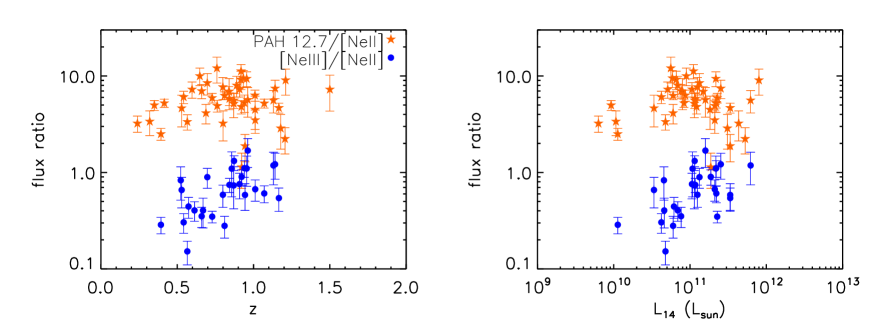
The AGN contribution to the MIR luminosity of the sources increases with . This can be demonstrated by the decreasing EW of PAHs with (Fig 9). Moreover, the [Ne III]/ [Ne II] flux ratio increases with , indicating that the radiation field in the most distant sources is harder than that in the most nearby sources (Fig. 10). This effect is also seen as a function of luminosity possibly due to the flux-limited selection of the sample.
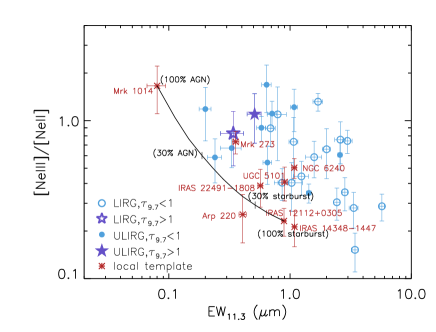
In Fig. 11, we constructed a diagnostic diagram between the [Ne III]/ [Ne II] flux ratio and EW11.3, which determines the powering mechanism of a source’s MIR emission. While this diagram does not use lines with large difference in ionic excitation potential (e.g., Genzel et al. 1998, Peeters et al. 2004, Dale et al. 2006, Armus et al. 2007) or two different states of the same ion (e.g., Sturm et al. 2002; Verma et al. 2003; Farrah et al. 2007), it is useful because it uses lines in the range 1116 µm. Hence, it can be applied to samples that span a wide range, i.e., 01.3 for samples observed with IRS. We used the local templates Mrk 1014 and IRAS 12112+0305 to demonstrate how the position of a source on this diagram changes when the AGN (or star-formation) fraction of L14 increases from 0 to 100%. We also plotted the positions of several local templates to investigate for differences between distant IR-bright galaxies and their local analogues. Because ionic lines are hard to detect in distant AGN, most of the sources in our sample that are used to populate this diagram are either composite or starburst dominated, i.e., they have EW11.3 0.1 and 0.8 µm, respectively. We find that, at intermediate and high , IR-bright galaxies often have a radiation field that is harder than that in their local analogues, with ULIRGs being more AGN dominated than LIRGs. Based on their locus on this diagram, several distant star-forming galaxies could resemble NGC 6240, which has a buried active nucleus (Komossa et al. 2003; Armus et al. 2006; Farrah et al. 2007). Buried AGN have been discovered in X-ray data of 2 starbursts (Huang et al. 2009). Moreover, the EW11.3 values of many distant starbursts are higher than those of local ULIRGs, indicating a possible increase in star formation activity with (Weedman & Houck 2008). The few heavily obscured sources in the MIR that are seen on this diagram may be hosting an AGN. However, the dominant mechanism of their MIR emission is unclear.
5.4 IR color-color diagrams vs MIR spectral type
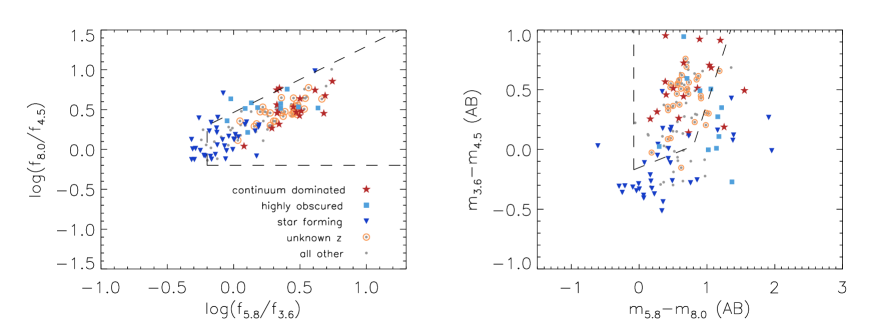
Color-color diagrams in the IR (Lacy et al. 2004; Stern et al. 2005) have provided a way to select AGN, allowing IR samples to largely complement -ray samples in the identification of type-2 QSOs (Barmby et al. 2006; Poletta et al. 2006, 2007; Donley et al. 2007; Georgantopoulos et al. 2007; Lacy et al. 2007; Barger et al. 2008; Cardamone et al. 2008; Gorjian et al. 2008). These diagrams use 3.68.0 µm broad-band photometry to determine whether the NIRMIR SED of extragalactic sources resemble those of AGN.
Using the updated IRAC fluxes of the sources in this sample (Table 1) and the AGN and star-forming galaxy classification based on EW11.3, we investigated how well the MIR spectral type classification agrees with the color-color diagram classification. For this purpose, we constructed the Lacy et al. (2004) and Stern et al. (2005) diagrams for the 141 sources with detections in all four IRAC channels (Fig. 12). We displayed on these diagrams sources with AGN and star-formation dominated spectra, and sources that are highly obscured in the MIR (with 1). Sources without have featureless MIR continua and are therefore also classified as AGN. We find that the number of sources that lie inside the AGN wedge, which is the area enclosed by the dashed lines, was 122 (or 87%) for the Lacy et al. (2004) diagram and 88 (or 62%) for the Stern et al. (2005) diagram. In most cases, spectroscopically determined AGN with or without lie inside the AGN wedge. However, some star-forming galaxies and many heavily obscured systems are also located inside the same wedge. A plausible explanation why this diagram could lead to the misidentification of starbursts as AGN is effects. The use of rest-frame IRAC fluxes can bring sources outside the AGN wedge boundaries or close to them (Barmby et al. 2006; Donley et al. 2007; Higdon et. al. 2008; Yun et al. 2008).
5.5 MIR spectral properties vs NIR radial extent
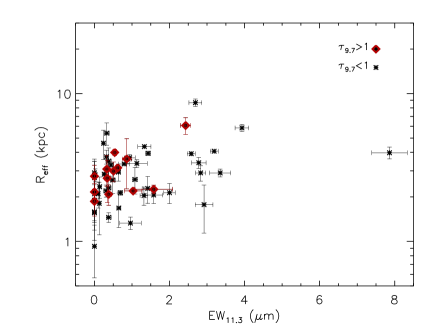
Previous NIR imaging of distant 24 µm selected sources indicated that 2 ULIRGs with large radial extents typically have MIR spectra resembling those of star-forming galaxies. Sources with continuum-dominated MIR spectra are often compact, while the extent of systems with high MIR obscuration can vary (Dasyra et al. 2008a; Melbourne et al. 2009). Using this large sample, we populated the redshift range 02 to investigate whether this trend is typical of IR-luminous galaxies at several epochs.
We confirm that composite sources and sources that are heavily obscured in the MIR (i.e., sources with 1) can either have a compact or an extended stellar distribution (Fig. 13). One of the heavily obscured sources in the MIR, MIPS 562, is one of the most extended sources in the images with two (or possibly more) closely interacting gas-rich components. We also find that the sources with the strongest EW11.3 values, i.e., EW11.32 µm, are typically more extended than 3 kpc (Fig. 13). However, there is no strong correlation between EW11.3 and the observed-frame NIR radial extent of the sources.
Scenarios of local gas-rich galaxy mergers suggest that the IR SED becomes warmer (Sanders et al. 1988), the IR luminosity increases (Veilleux et al. 2006), and the EW11.3 value decreases (Farrah et al. 2009) as a merger advances, approaching dynamical equilibrium. In such scenarios, the radial extent of interacting galaxies would correlate with EW11.3. The lack of a strong correlation could be due to the large scatter in the merger timescales during which the peak of star-formation (or AGN) activity is observed (Rigopoulou et al. 1999). Moreover, several of the distant IR-bright galaxies may not be associated with interactions (Zheng et al. 2004; Dasyra et al. 2008a).
6 Discussion: Changes in the MIR spectral properties with or
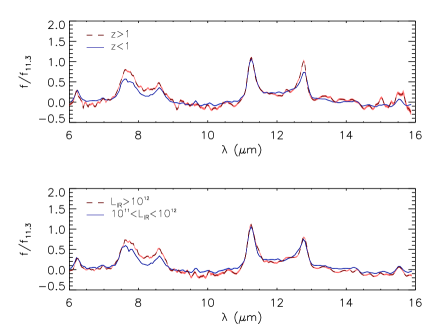
Having a flux-limited sample of IR-luminous galaxies spanning a wide range, we investigated for differences in the properties of spectral features with look-back time by comparing the stacked spectra of sources in different bins. To create a representative spectrum for each bin, we used a stacking algorithm that was similar to that presented in § 5.2. We first divided each spectrum by its extinction curve so that the line ratios in the stacked spectrum are not affected by differences in the silicate depth among individual galaxies. For each extinction-corrected spectrum, we then subtracted the continuum and divided the flux at all wavelengths by its 11.3 µm value, so that all sources have similar 11.3 µm PAH strength. The resulting stacked spectrum, which was computed using all galaxy spectra with rest-frame 11.3 µm data, was found by averaging the individual spectra using their uncertainties as weights. It is shown in Fig. 14 for sources at 1 and 1. We observe a small but significant (3) change in the fluxes of several PAH features with . For example, the normalized flux of the 7.7 µm PAH is 22% higher at 1 than at 1. Such flux variations are frequently seen within local galaxies (Galliano et al. 2008). The ratio of the 11.3 µm PAH flux, f11.3, to the flux of the PAHs at 7.7 µm and 8.6 µm decreases with increasing redshift. Changes in the PAH radius or excitation state can reproduce this trend. For example, an increasing fraction of ionized PAHs leads to stronger PAH emission at 6-9 µm than at 11.3 µm (Draine & Lee 1984; Allamandola et al. 1999; Draine & Li 2007; Farrah et al. 2008).
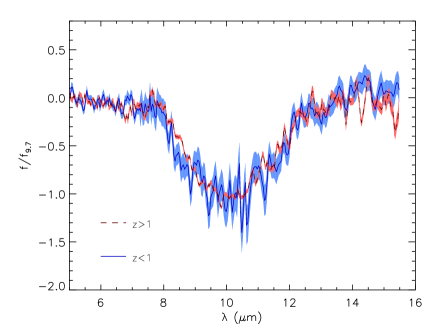
To investigate whether some of the observed trends could be attributed to a change in the extinction curve shape with , we computed the stacked spectrum of the 9.7 µm absorption profile at 1 and 1. For this reason, we removed both the continuum and the best-fit profile of all lines and features in each individual spectrum. We normalized all spectra at 9.7 µm, and computed the average spectrum using only sources with intermediate and high extinction, i.e. 0.5. We also used only sources with EW11.30.8 µm, so that possible residuals from the removal of lines and features do not affect the absorption feature profile. We find no significant change in the shape of the extinction at 1 and 1 (Fig. 15). Moreover, there is no correlation between and the depth of the silicate absorption feature, as computed by PAHFIT (see Table 2), indicating that any changes in the spectral properties with are primarily due to differences in the PAH properties.
What remains to be tested is whether the observed changes in the spectra of IR-bright galaxies are purely dependent on redshift. Because of the flux-limited nature of the sample, the sources become brighter with increasing . When computing the stacked spectra of sources as a function of luminosity, we also find that the flux ratio of the 11.3 µm PAH over the 7.7 or the 8.6 µm complex decreases with the transition from LIRGs to ULIRGs (Fig. 14; see also Farrah et al. 2008). The use of further datasets that extend the sample’s range in each bin will help us break this degeneracy by enabling us to compare the spectra of LIRGs and ULIRGs at 1 and 1. For this purpose, we will need to use sources from flux-limited samples of different f24 thresholds. Including such samples will also help us to avoid possible biases associated with a single flux threshold, and possibly, cosmic variance. This will be the focus of a forthcoming paper.
7 Conclusions
We presented a MIR spectroscopic catalog of 150 IR-luminous galaxies in the Spitzer extragalactic first look survey. Our program aimed to collect data with the IRS spectrograph on board Spitzer for a purely flux-limited sample (with f240.9 mJy and mR19 Vega mags) of IR-luminous galaxies in order to investigate for possible evolution in their MIR spectral properties with . This catalog is complemented by a large number of ancillary datasets, including ground-based -band images, HST -band imaging, Spitzer IRAC (3.6, 4.5, 5.0, and 8.0 µm) and MIPS (24 and 70 µm) photometry. Our basic findings are summarized as follows.
-
1.
Of the 150 observed sources, 31 have featureless MIR continua and 24 have potential but uncertain measurements. Reliable spectroscopic redshifts were derived for the remaining 95 sources from MIR features. These 95 sources span a wide range, 0.3z3.5, with a peak at 1. Most of these sources are estimated to be LIRGs at 1 and ULIRGs at 1, based on their monochromatic 14 µm luminosities.
-
2.
We used the EW of the 11.3 µm PAH to classify sources as AGN dominated (EW11.3 0.1 µm) or star forming (EW11.30.8 µm). We found that the sample comprises 39 star-forming galaxies, 9 of which are simultaneously highly obscured systems (with 9.7 µm optical depth that exceeds unity). The sample also comprises 13 more highly obscured systems with EW11.30.8 µm. The galaxies with an AGN-related power-law continuum are 49, including the 31 sources that have no measurement.
-
3.
The AGN continuum emission becomes stronger with increasing , as indicated by the decreasing EW of PAH features. Moreover, the interstellar radiation field becomes harder with increasing , as determined by the increasing [Ne III]/ [Ne II] flux ratio. These results could be attributed to the flux-limited nature of the sample, since it comprises more luminous, and possibly more AGN-dominated systems, at earlier epochs. Distant ULIRGs are more AGN-dominated than distant LIRGs based on a [Ne III]/ [Ne II] versus EW11.3 diagram that is used as a diagnostic between AGN and star formation activity. Based on their high EW11.3 values, several distant starbursts can have an elevated star formation activity with respect to their local analogues.
-
4.
We tested how well the power source of the MIR emission, i.e., an AGN or a starburst, as inferred from the IRS spectra, agrees with the position of sources on 3.68 µm color-color diagrams. While continuum-dominated sources fall inside the AGN wedge of color-color diagrams, so do some starbursts possibly due to redshift effects. Since most of the heavily obscured sources (with 1) also fall inside the AGN wedge, they would be selected as type-2 AGN, even if they were undergoing nuclear starbursts.
-
5.
Stacking analysis enabled the detection of weak features that are often undetected in high- sources. Such an example is the 14.32 µm [Ne V] line, which constitutes direct evidence for the existence of an AGN because it is emitted by an ion with high ionization potential. The [Ne V] line was detected in stacked spectra of sources with low EW11.3, and its flux increased as the EW11.3 decreased. The H2 0-0 S(1) and S(3) lines were observed in stacked spectra of sources with [Ne II] emission, which comprised starburst galaxies. The excitation temperature of the warm molecular hydrogen is 360 K and its mass is 2108 . The luminosities of the S(1) and S(3) lines were 10-4 . The 3.3 µm PAH feature was also detected in the stacked spectra of sources with [Ne II] emission. Its luminosity was of order and 2 times lower than the luminosity of the 6.2 µm PAH feature.
-
6.
A small (but significant) change in the ratios of PAH features is observed in the stacked spectra of IR-luminous galaxies with . The 11.3 µm feature flux decreases with respect to the fluxes of the 7.7 and 8.6 µm complexes from 1 to 1, while there is no evidence for change in the profile or the depth of the extinction curve with redshift. The same trend is seen as a function of luminosity. It is possible that this effect is due to changes in the PAH excitation properties.
-
7.
We investigated whether the MIR spectra of IR-luminous galaxies are related to their radial extents in the NIR. While we found no strong correlation between EW11.3 and , as measured from HST NICMOS -band images, the strongest starbursts, i.e., the sources with EW11.32 µm typically have 3 kpc. The extent of sources with composite MIR spectra or with high MIR obscuration can vary.

![[Uncaptioned image]](/html/0906.5271/assets/x4.png)
Figure 3 continued.
![[Uncaptioned image]](/html/0906.5271/assets/x5.png)
Figure 3 continued.
![[Uncaptioned image]](/html/0906.5271/assets/x6.png)
Figure 3 continued.
![[Uncaptioned image]](/html/0906.5271/assets/x8.png)
Figure 4 continued.
![[Uncaptioned image]](/html/0906.5271/assets/x9.png)
Figure 4 continued.


| Galaxy | coordinates | tint(SL1, LL2, LL1) | mR | f3.6 | f4.5 | f5.8 | f8.0 | f24 | |
|---|---|---|---|---|---|---|---|---|---|
| (J2000) | (s) | (Vega) | (Jy) | (Jy) | (Jy) | (Jy) | (mJy) | (kpc) | |
| (1) | (2) | (3) | (4) | (5) | (6) | (7) | (8) | (9) | (10) |
| MIPS34 | 17:17:08.7+59:13:41.1 | 483, 487, 487 | 21.05 | 445.8 45.1 | 680.1 68.5 | 980.4 100.6 | 1413.9 142.9 | 5.42 0.06 | 2.82 0.28 |
| MIPS39 | 17:17:50.7+58:47:45.3 | 483, 487, 731 | 23.27 | 58.3 6.7 | 135.2 15.0 | 322.9 36.6 | 971.9 100.7 | 5.10 0.07 | |
| MIPS55 | 17:15:06.6+58:39:39.7 | , 487, 487 | 20.75 | 189.8 19.4 | 144.3 15.3 | 174.1 20.6 | 275.8 30.6 | 4.13 0.06 | |
| MIPS159 | 17:13:33.4+59:27:47.2 | 483, 1462, 1706 | 22.08 | 168.7 17.5 | 277.6 28.7 | 499.8 53.6 | 841.1 87.4 | 1.88 0.06 | |
| MIPS168 | 17:17:55.1+59:28:45.3 | 483, 975, 1218 | 20.18 | 96.4 10.8 | 95.5 11.2 | 80.4 16.1 | 486.2 52.0 | 1.82 0.06 | 1.33 0.13 |
| MIPS184 | 17:14:04.5+59:03:03.7 | , 1462, 1706 | 21.56 | 130.6 14.1 | 113.4 12.9 | 145.6 22.3 | 257.7 30.9 | 1.73 0.06 | |
| MIPS213 | 17:13:35.7+59:27:21.8 | 483, 1462, 1706 | 23.42 | 34.3 3.9 | 65.6 7.4 | 140.7 16.9 | 365.0 38.8 | 1.65 0.06 | 1.90 0.52 |
| MIPS224 | 17:16:55.8+59:25:40.4 | 483, 1462, 1706 | 20.54 | 149.6 16.0 | 248.7 26.0 | 276.5 35.1 | 493.1 52.7 | 1.57 0.06 | 1.81 0.70 |
| MIPS268 | 17:12:08.9+59:30:25.0 | 483, 1462, 1706 | 22.93 | 59.7 7.0 | 116.9 12.5 | 187.7 25.2 | 366.2 39.3 | 1.48 0.06 | 2.34 0.39 |
| MIPS277 | 17:14:20.8+58:55:02.5 | , 1462, 1706 | 21.31 | 134.4 14.2 | 105.3 11.1 | 76.7 14.7 | 139.0 16.3 | 1.43 0.06 | |
| MIPS298 | 17:14:48.9+59:28:47.4 | , 1462, 1706 | 23.95 | 6.5 ggThe flux or limit was remeasured (often due to a misidentification). | 10.5 ggThe flux or limit was remeasured (often due to a misidentification). | 41.2 12.8 | 163.5 21.6 | 1.37 0.06 | |
| MIPS322 | 17:14:24.9+59:29:48.0 | 483, 1462, 1706 | 23.40 | 81.6 9.2 | 131.8 14.7 | 277.6 34.8 | 424.2 46.1 | 1.25 0.06 | |
| MIPS324 | 17:17:15.7+59:06:03.3 | 483, 1462, 1706 | 20.79 | 171.9 18.2 | 211.1 22.4 | 286.9 35.6 | 271.8 32.0 | 1.23 0.06 | 2.94 0.39 |
| MIPS331 | 17:15:05.7+59:18:20.2 | 483, 1462, 1706 | 22.04 | 161.8 17.2 | 200.1 21.3 | 270.9 32.9 | 455.4 49.0 | 1.32 0.07 | |
| MIPS350 | 17:15:50.7+59:23:15.9 | , 1462, 1706 | 22.85 | 102.5 10.8 | 86.2 10.0 | 100.3 14.5 | 159.8 21.9 | 1.15 0.06 ddTwo or more sources are blended in this IRAC or MIPS channel. | |
| MIPS351 | 17:16:59.2+59:08:11.7 | 483, 1462, 1706 | 22.04 | 104.5 11.6 | 146.2 15.8 | 209.2 27.8 | 331.9 36.8 | 1.24 0.06 | |
| MIPS358 | 17:18:07.1+59:29:37.4 | , 1462, 1706 | 22.24 | 108.5 11.5 | 76.3 8.3 | 81.7 13.8 | 86.8 11.7 | 1.11 0.05 | 2.91 0.17 |
| MIPS369 | 17:14:50.9+59:26:33.3 | , 1462, 1706 | 22.32 | 94.5 10.2 | 93.8 10.7 | 58.7 11.8 | 106.9 17.3 | 1.13 0.06 | |
| MIPS394 | 17:13:15.7+59:12:08.5 | , 1462, 1706 | 22.08 | 134.0 14.0 | 105.3 12.1 | 69.2 12.6 | 108.5 17.4 | 1.10 0.06 | |
| MIPS397 | 17:15:05.9+59:09:16.9 | 966, 2924, 3412 | 23.80 | 65.2 7.7 | 74.2 8.6 | 138.1 20.9 | 270.0 30.1 | 1.12 0.06 | 2.79 0.69 |
| MIPS419 | 17:15:45.2+59:05:38.7 | , 2924, 3412 | 22.85 | 33.1 4.6 | 42.6 6.0 | 83.8 16.6 | 243.7 29.6 | 1.06 0.06 | 1.87 0.38 |
| MIPS446 | 17:14:09.0+59:17:48.4 | 483, 1462, 1706 | 21.82 | 142.7 14.8 | 140.7 14.7 | 175.6 21.2 | 283.3 30.8 | 1.03 0.06 | |
| MIPS463 | 17:14:45.2+58:54:55.1 | , 2924, 3412 | 44.3 6.0 hhTwo or more sources that could be at similar redshifts are comprised in the IRAC or MIPS flux. | 58.2 7.4 hhTwo or more sources that could be at similar redshifts are comprised in the IRAC or MIPS flux. | 78.9 16.1 | 169.1 21.4 hhTwo or more sources that could be at similar redshifts are comprised in the IRAC or MIPS flux. | 1.11 0.06 | ||
| MIPS472 | 17:18:16.7+59:19:36.1 | , 1462, 1706 | 22.21 | 70.7 16.0 d,id,ifootnotemark: | 41.7 13.1 d,id,ifootnotemark: | 32.9 ggThe flux or limit was remeasured (often due to a misidentification). | 62.0 12.6 | 1.03 0.06 | |
| MIPS488 | 17:15:11.9+58:49:35.0 | , 2924, 3412 | 21.16 | 119.2 12.7 | 88.3 10.1 | 98.4 16.4 | 116.9 16.4 | 1.08 0.06 | 3.40 0.30 |
| MIPS495 | 17:14:33.0+58:58:19.8 | , 1462, 1706 | 21.84 bbThe identification of the optical counterpart is uncertain. | 159.3 16.9 | 155.6 16.9 | 171.4 23.9 | 202.8 25.1 | 1.05 0.06 | |
| MIPS505 | 17:15:59.4+59:27:33.4 | , 1462, 1706 | 24.91 | 17.2 2.8 | 31.5 5.4 | 63.1 11.5 | 187.8 23.8 | 1.00 0.06 | |
| MIPS509 | 17:14:22.1+59:28:14.3 | , 1462, 1706 | 6.9 ggThe flux or limit was remeasured (often due to a misidentification). | 17.3 3.9 | 36.3 ggThe flux or limit was remeasured (often due to a misidentification). | 136.4 20.0 | 0.98 0.06 | ||
| MIPS512 | 17:16:55.7+59:10:46.1 | 483, 1462, 1706 | 23.21 | 117.7 12.7 | 162.7 17.4 | 173.4 24.0 | 272.0 31.1 | 0.89 0.06 | 2.19 0.21 |
| MIPS521 | 17:13:41.4+58:57:03.7 | , 1462, 1706 | bbThe identification of the optical counterpart is uncertain. | 64.5 7.4 d,id,ifootnotemark: | 75.8 8.4 d,id,ifootnotemark: | 93.7 19.6 d,id,ifootnotemark: | 129.1 18.7 d,id,ifootnotemark: | 1.00 0.06 | |
| MIPS530 | 17:13:37.1+58:46:37.5 | , 2924, 3412 | 22.18 | 120.4 12.7 | 123.8 8.6 ggThe flux or limit was remeasured (often due to a misidentification). | 179.2 21.2 ggThe flux or limit was remeasured (often due to a misidentification). | 102.291 16.1 ggThe flux or limit was remeasured (often due to a misidentification). | 0.91 0.06 | |
| MIPS532 | 17:15:26.1+58:56:32.4 | , 2924, 3412 | 22.70 | 51.5 6.7 | 56.9 7.5 | 62.9 15.1 | 185.8 23.1 | 0.98 0.06 | |
| MIPS537 | 17:17:59.3+59:21:56.3 | 483, 1462, 1706 | 19.90 a,ba,bfootnotemark: | 88.7 10.1 | 113.6 12.6 | 48.6 14.1 | 282.2 32.5 | 0.94 0.06 | |
| MIPS542 | 17:12:45.7+59:32:14.4 | , 1462, 1706 | 22.06 | 119.7 13.0 | 108.1 12.1 | 87.2 16.8 | 93.6 15.4 | 0.90 0.05 | |
| MIPS544 | 17:13:07.7+58:44:13.3 | , 1706, 1950 | 23.03 | 49.0 5.8 | 67.7 8.2 | 74.2 13.4 | 227.2 28.2 | 0.91 0.06 | 2.08 0.33 |
| MIPS546 | 17:12:16.1+59:11:22.0 | , 1462, 1706 | 22.08 | 172.5 18.1 | 141.8 15.0 | 103.0 17.7 | 119.7 15.9 | 0.93 0.06 | 3.92 0.11 |
| MIPS549 | 17:16:28.9+59:29:21.0 | , 1462, 1706 | 21.54 | 80.2 9.1 | 62.8 7.8 | 82.6 15.3 | 96.8 16.5 | 0.98 0.05 | |
| MIPS562 | 17:12:39.6+58:59:55.1 | 483, 1462, 1706 | 20.90 | 214.0 43.8 d,id,ifootnotemark: | 165.5 24.8 d,id,ifootnotemark: | 140.2 21.8 | 281.6 31.2 | 1.01 0.06 | 6.08 0.80 |
| MIPS7985 | 17:13:25.5+60:07:20.2 | 483, 487, 487 | 22.57 | 168.6 17.5 | 269.1 28.1 | 493.1 53.0 | 947.0 98.5 | 4.87 0.06 | |
| MIPS8040 | 17:13:12.0+60:08:40.2 | 483, 731, 975 | jjThis source is blended with a star. Its flux cannot be recovered. | jjThis source is blended with a star. Its flux cannot be recovered. | 357.7 36.5 | 352.1 41.7 | 529.6 54.9 | 2.88 0.07 | |
| MIPS8069 | 17:15:00.4+59:56:11.7 | 483, 975, 975 | 19.12 ccWe remeasured these -band magnitudes from the catalog of Fadda et al. (2004) due to a problem in the detection or identification of the optical counterpart. | 386.9 39.2 | 545.3 54.8 eeThe lRAC flux is taken from the deep catalog of Lacy et al. (2005). | 695.0 72.6 | 972.0 97.8 eeThe lRAC flux is taken from the deep catalog of Lacy et al. (2005). | 2.33 0.03 | |
| MIPS8071 | 17:12:43.5+60:06:50.0 | 483, 1462, 1706 | 22.10 | 120.8 13.0 | 216.9 22.9 | 368.8 41.9 | 782.4 82.3 | 2.38 0.06 | |
| MIPS8098 | 17:16:08.0+60:06:38.8 | 483, 1462, 1706 | 21.83 | 167.8 17.8 | 194.5 20.2 | 189.1 25.3 | 292.6 31.9 | 2.02 0.06 | |
| MIPS8107 | 17:16:38.7+59:49:44.5 | 483, 14 62, 1706 | 22.17 | 104.1 10.6 eeThe lRAC flux is taken from the deep catalog of Lacy et al. (2005). | 132.8 13.5 eeThe lRAC flux is taken from the deep catalog of Lacy et al. (2005). | 217.8 23.1 eeThe lRAC flux is taken from the deep catalog of Lacy et al. (2005). | 449.2 45.0 eeThe lRAC flux is taken from the deep catalog of Lacy et al. (2005). | 1.84 0.03 | 4.61 1.03 |
| MIPS8121 | 17:13:22.8+60:10:44.6 | 483, 1462, 1706 | 23.43 | 153.4 31.5 d,id,ifootnotemark: | 258.7 41.2 d,id,ifootnotemark: | 481.4 53.8 | 685.9 73.1 | 1.89 0.06 | |
| MIPS8157 | 17:18:40.6+60:09:35.3 | 483, 1462, 1706 | 23.31 | 142.9 15.3 | 189.6 19.9 | 226.4 30.1 | 563.4 58.5 | 1.66 0.06 | |
| MIPS8172 | 17:16:49.1+59:49:18.6 | 483, 1462, 1706 | 23.06 | jjThis source is blended with a star. Its flux cannot be recovered. | jjThis source is blended with a star. Its flux cannot be recovered. | 473.1 53.2 | 798.7 83.0 ffThe flux measurement of the IRAC counterpart of the 24 µm source is uncertain due to the blending of two sources. | 1.46 0.03 | |
| MIPS8179 | 17:16:15.0+60:13:32.4 | 483, 1462, 1706 | 20.87 | 123.5 13.4 | 138.8 14.9 | 243.6 31.5 | 274.2 30.8 | 1.53 0.06 | 2.68 0.52 |
| MIPS8185 | 17:14:22.8+60:28:34.6 | 483, 1218, 1462 | 23.80 | 87.5 9.7 | 149.9 15.8 | 262.4 33.5 | 572.0 59.1 | 1.57 0.06 ddTwo or more sources are blended in this IRAC or MIPS channel. | |
| MIPS8192 | 17:12:53.9+60:05:00.8 | , 1462, 1706 | 23.09 | 52.3 5.9 | 63.1 7.2 | 86.6 13.7 | 214.2 24.9 | 1.46 0.06 | |
| MIPS8204 | 17:14:40.9+59:58:19.2 | , 1462, 1706 | 22.83 | 163.1 16.8 | 152.0 15.8 | 149.9 19.5 | 222.6 24.8 | 1.39 0.03 | 2.04 0.29 |
| MIPS8224 | 17:16:49.0+59:53:35.5 | 483, 1462, 1706 | 23.53 | 94.5 9.6 eeThe lRAC flux is taken from the deep catalog of Lacy et al. (2005). | 167.6 17.1 eeThe lRAC flux is taken from the deep catalog of Lacy et al. (2005). | 260.9 27.4 eeThe lRAC flux is taken from the deep catalog of Lacy et al. (2005). | 465.5 47.1 eeThe lRAC flux is taken from the deep catalog of Lacy et al. (2005). | 1.44 0.03 | |
| MIPS8226 | 17:12:04.7+60:16:32.0 | , 1462, 1706 | 20.95 | 30.3 4.3 | 72.8 8.3 | 144.6 22.2 | 206.9 23.9 | 1.42 0.06 | 0.930.36 |
| MIPS8233 | 17:17:31.5+59:40:33.8 | 483, 1462, 1706 | 21.92 | 143.0 14.4 eeThe lRAC flux is taken from the deep catalog of Lacy et al. (2005). | 198.8 20.2 eeThe lRAC flux is taken from the deep catalog of Lacy et al. (2005). | 270.0 28.2 eeThe lRAC flux is taken from the deep catalog of Lacy et al. (2005). | 398.4 40.5 eeThe lRAC flux is taken from the deep catalog of Lacy et al. (2005). | 1.32 0.03 | |
| MIPS8251 | 17:12:21.7+60:03:33.6 | , 1462, 1706 | 23.22 | 28.2 4.2 | 44.5 5.8 | 59.6 14.8 | 249.0 28.8 | 1.31 0.06 | 2.10 0.76 |
| MIPS8253 | 17:15:07.8+60:13:52.9 | 483, 1462, 1706 | 21.78 | 113.4 12.4 | 114.4 12.7 | 154.1 22.3 | 440.4 47.0 | 1.25 0.06 | 2.99 0.45 |
| MIPS8308 | 17:16:34.4+60:15:44.0 | , 1462, 1706 | 20.29 | 89.4 10.1 | 96.0 10.8 | 67.8 15.5 | 242.2 28.0 | 1.26 0.06 | 2.28 0.47 |
| MIPS8311 | 17:15:27.7+60:07:26.3 | , 1462, 1706 | 22.08 | 100.4 11.2 | 100.2 11.3 | 89.6 17.7 | 229.1 28.5 | 1.17 0.06 | 3.15 0.15 |
| MIPS8315 | 17:13:57.0+59:44:37.6 | 483, 1462, 1706 | 23.88 | 80.6 9.3 | 135.2 15.0 | 245.7 29.7 | 482.7 51.8 | 1.17 0.04 | |
| MIPS8325 | 17:16:43.7+60:20:13.6 | , 1462, 1706 | 21.05 | 69.8 8.0 | 62.9 7.6 | 84.9 16.8 | 129.6 18.1 | 1.13 0.06 | 3.61 1.34 |
| MIPS8328 | 17:16:06.7+59:44:54.6 | , 1462, 1706 | 22.33 | 95.5 9.7 eeThe lRAC flux is taken from the deep catalog of Lacy et al. (2005). | 89.9 9.4 eeThe lRAC flux is taken from the deep catalog of Lacy et al. (2005). | 76.9 9.3 eeThe lRAC flux is taken from the deep catalog of Lacy et al. (2005). | 129.5 14.1 eeThe lRAC flux is taken from the deep catalog of Lacy et al. (2005). | 1.14 0.03 | 2.60 0.49 |
| MIPS8360 | 17:16:52.5+59:35:31.9 | , 1462, 1706 | 22.07 | 96.7 9.8 eeThe lRAC flux is taken from the deep catalog of Lacy et al. (2005). | 107.0 11.2 eeThe lRAC flux is taken from the deep catalog of Lacy et al. (2005). | 88.1 10.5 eeThe lRAC flux is taken from the deep catalog of Lacy et al. (2005). | 120.9 13.1 eeThe lRAC flux is taken from the deep catalog of Lacy et al. (2005). | 1.04 0.03 | 3.73 0.40 |
| MIPS8371 | 17:13:25.0+59:45:57.8 | 483, 1462, 1706 | 20.03 b,cb,cfootnotemark: | 176.8 39.2 d,id,ifootnotemark: | 205.2 19.6 d,id,ifootnotemark: | 131.5 18.4 | 381.6 24.5 d,id,ifootnotemark: | 1.12 0.06 | |
| MIPS8375 | 17:14:33.8+59:52:21.8 | , 1462, 1706 | 21.06 b,cb,cfootnotemark: | 143.5 4.7 h, gh, gfootnotemark: | 144.5 5.9 h, g,eh, g,efootnotemark: | 72.6 16.0 ddTwo or more sources are blended in this IRAC or MIPS channel. | 108.2 12.2 e,de,dfootnotemark: | 1.16 0.03 ddTwo or more sources are blended in this IRAC or MIPS channel. | |
| MIPS8377 | 17:17:33.5+59:46:40.7 | , 1462, 1706 | 22.17 bbThe identification of the optical counterpart is uncertain. | 101.7 33.1 d,i,ed,i,efootnotemark: | 76.8 22.4 d,i,ed,i,efootnotemark: | 89.9 9.8 eeThe lRAC flux is taken from the deep catalog of Lacy et al. (2005). | 74.1 8.4 e,de,dfootnotemark: | 1.03 0.03 | |
| MIPS8384 | 17:16:47.5+60:17:57.2 | 483, 1462, 1706 | 22.39 | 232.3 23.7 | 238.8 24.6 | 242.8 27.7 | 340.1 36.4 | 1.09 0.06 | |
| MIPS8387 | 17:18:02.8+60:15:22.0 | , 1462, 1706 | 21.33 a, ca, cfootnotemark: | 280.1 28.8 | 201.1 21.2 | 190.8 26.2 | 151.7 20.5 | 1.06 0.06 | 8.67 0.50 |
| MIPS8388 | 17:14:00.4+60:14:09.5 | , 1462, 1706 | 21.42 | 112.4 12.3 | 130.6 14.2 | 113.4 18.9 | 173.1 21.6 | 1.05 0.06 | 2.62 0.53 |
| MIPS8392 | 17:13:43.9+59:57:14.5 | , 2924, 3412 | 15.5 2.7 | 23.1 4.3 | 63.7 12.6 | 223.0 26.8 | 1.01 0.06 | 2.25 0.15 | |
| MIPS8400 | 17:13:13.9+59:55:06.2 | , 1462, 1706 | 20.11 | 115.5 12.6 | 125.1 14.0 | 165.3 23.3 | 243.9 29.7 | 1.00 0.06 | |
| MIPS8401 | 17:12:38.5+59:42:33.4 | , 1462, 1706 | 20.42 | 122.2 13.0 | 88.9 9.7 | 132.7 18.7 | 128.0 16.7 | 1.02 0.06 | |
| MIPS8405 | 17:15:27.7+60:17:31.2 | , 1462, 1706 | 21.28 | 144.3 15.5 | 160.9 17.4 | 108.6 18.5 | 123.1 18.5 | 1.05 0.06 | 1.68 0.44 |
| MIPS8407 | 17:16:12.8+60:19:49.0 | , 1462, 1706 | 24.26 | 54.3 6.4 | 83.3 9.6 | 124.3 18.6 | 242.3 28.5 | 1.00 0.06 | |
| MIPS8409 | 17:17:36.0+60:15:40.1 | , 1462, 1706 | 20.73 bbThe identification of the optical counterpart is uncertain. | 105.5 11.7 hhTwo or more sources that could be at similar redshifts are comprised in the IRAC or MIPS flux. | 80.5 9.7 hhTwo or more sources that could be at similar redshifts are comprised in the IRAC or MIPS flux. | 75.5 16.1 | 100.9 16.0 hhTwo or more sources that could be at similar redshifts are comprised in the IRAC or MIPS flux. | 1.09 0.06 hhTwo or more sources that could be at similar redshifts are comprised in the IRAC or MIPS flux. | |
| MIPS8411 | 17:14:03.3+60:16:56.6 | 483, 1462, 1706 | 23.69 | 48.3 6.3 | 90.8 9.8 | 105.0 18.0 | 279.1 30.2 | 0.97 0.06 | |
| MIPS8413 | 17:15:45.7+59:51:56.4 | , 1462, 1706 | 22.0 2.3 eeThe lRAC flux is taken from the deep catalog of Lacy et al. (2005). | 31.5 3.9 eeThe lRAC flux is taken from the deep catalog of Lacy et al. (2005). | 73.7 8.5 eeThe lRAC flux is taken from the deep catalog of Lacy et al. (2005). | 139.4 15.0 eeThe lRAC flux is taken from the deep catalog of Lacy et al. (2005). | 0.97 0.03 | ||
| MIPS8424 | 17:16:21.9+59:56:52.2 | , 1706, 1950 | 22.95 | 44.7 5.7 | 56.6 6.2 eeThe lRAC flux is taken from the deep catalog of Lacy et al. (2005). | 53.5 12.7 | 62.3 8.1 eeThe lRAC flux is taken from the deep catalog of Lacy et al. (2005). | 1.10 0.04 | |
| MIPS8430 | 17:13:33.2+60:10:19.5 | , 1462, 1706 | 22.03 | 95.9 6.91 d,id,ifootnotemark: | 106.4 12.2 | 119.9 18.5 | 235.2 28.8 | 0.97 0.06 | 2.20 0.05 |
| MIPS8450 | 17:18:26.0+59:53:53.5 | , 1462, 1706 | 21.38 | 124.7 12.6 eeThe lRAC flux is taken from the deep catalog of Lacy et al. (2005). | 88.5 9.2 eeThe lRAC flux is taken from the deep catalog of Lacy et al. (2005). | 70.0 8.9 eeThe lRAC flux is taken from the deep catalog of Lacy et al. (2005). | 86.0 10.1 eeThe lRAC flux is taken from the deep catalog of Lacy et al. (2005). | 0.96 0.03 | 5.86 0.32 |
| MIPS8462 | 17:13:09.5+60:08:16.0 | , 1462, 1706 | 21.64 | 90.7 10.2 | 73.9 8.3 | 53.3 14.8 | 130.6 17.0 | 0.99 0.06 | 5.400.93 |
| MIPS8465 | 17:13:01.8+59:37:22.4 | 483, 1462, 1706 | 22.61 | 65.0 7.2 | 108.0 11.4 | 194.3 23.9 | 298.5 32.1 | 0.93 0.06 | |
| MIPS8477 | 17:13:44.4+60:15:31.5 | , 1706, 1950 | 22.16 | 91.9 10.2 hhTwo or more sources that could be at similar redshifts are comprised in the IRAC or MIPS flux. | 84.0 9.7 hhTwo or more sources that could be at similar redshifts are comprised in the IRAC or MIPS flux. | 124.6 19.5 hhTwo or more sources that could be at similar redshifts are comprised in the IRAC or MIPS flux. | 251.1 30.3 hhTwo or more sources that could be at similar redshifts are comprised in the IRAC or MIPS flux. | 0.98 0.06 hhTwo or more sources that could be at similar redshifts are comprised in the IRAC or MIPS flux. | 1.45 0.11 |
| MIPS8479 | 17:13:02.1+59:55:00.2 | , 2924, 3412 | 24.23 | 19.6 3.2 | 23.4 4.3 | 38.9 ggThe flux or limit was remeasured (often due to a misidentification). | 70.5 15.1 | 0.99 0.06 | 2.76 0.51 |
| MIPS8495 | 17:14:49.0+59:53:38.8 | 483, 1462, 1706 | 22.79 | 100.0 10.6 | 127.1 13.2 eeThe lRAC flux is taken from the deep catalog of Lacy et al. (2005). | 212.3 24.4 | 363.7 37.0 eeThe lRAC flux is taken from the deep catalog of Lacy et al. (2005). | 0.94 0.03 | |
| MIPS8499 | 17:12:16.5+59:57:10.9 | , 1462, 1706 | 20.51 | 261.2 26.9 | 192.6 19.8 | 159.3 20.8 | 159.7 18.7 | 0.91 0.06 | 3.98 0.36 |
| MIPS8507 | 17:13:29.9+59:44:34.2 | , 1706, 1950 | 20.89 | 150.5 15.8 | 113.4 12.8 | 148.3 20.8 | 112.9 17.7 | 0.91 0.06 | 4.38 0.02 |
| MIPS8521 | 17:12:18.9+60:10:03.8 | 483, 1462, 1706 | 107.6 11.7 | 169.3 18.0 | 243.4 29.6 | 555.4 58.2 | 0.89 0.06 | 3.09 0.73 | |
| MIPS8526 | 17:16:28.4+59:44:22.9 | , 1462, 1706 | 22.44 | 131.5 13.3 eeThe lRAC flux is taken from the deep catalog of Lacy et al. (2005). | 98.4 10.4 eeThe lRAC flux is taken from the deep catalog of Lacy et al. (2005). | 88.0 10.4 eeThe lRAC flux is taken from the deep catalog of Lacy et al. (2005). | 80.7 9.5 eeThe lRAC flux is taken from the deep catalog of Lacy et al. (2005). | 0.92 0.03 | |
| MIPS8532 | 17:16:23.3+59:36:46.9 | , 1462, 1706 | 21.73 | 93.1 9.5 eeThe lRAC flux is taken from the deep catalog of Lacy et al. (2005). | 69.9 7.3 eeThe lRAC flux is taken from the deep catalog of Lacy et al. (2005). | 62.8 8.2 eeThe lRAC flux is taken from the deep catalog of Lacy et al. (2005). | 73.2 8.5 eeThe lRAC flux is taken from the deep catalog of Lacy et al. (2005). | 0.91 0.03 | 3.34 0.04 |
| MIPS8543 | 17:18:12.7+59:39:22.6 | , 1462, 1706 | 20.65 | 96.3 9.8 eeThe lRAC flux is taken from the deep catalog of Lacy et al. (2005). | 73.9 7.8 eeThe lRAC flux is taken from the deep catalog of Lacy et al. (2005). | 82.2 10.0 eeThe lRAC flux is taken from the deep catalog of Lacy et al. (2005). | 81.7 9.6 eeThe lRAC flux is taken from the deep catalog of Lacy et al. (2005). | 0.94 0.03 | 4.07 0.02 |
| MIPS8550 | 17:18:14.6+59:56:05.7 | , 1462, 1706 | 22.66 | 76.1 8.9 | 59.2 6.4 eeThe lRAC flux is taken from the deep catalog of Lacy et al. (2005). | 72.5 15.9 | 255.5 26.4 eeThe lRAC flux is taken from the deep catalog of Lacy et al. (2005). | 0.92 0.04 | |
| MIPS15678 | 17:23:28.4+59:29:47.3 | 483, 487, 487 | 22.15 | 339.9 14.1 d,id,ifootnotemark: | 612.2 62.3 | 972.4 102.6 | 1699.6 172.6 | 8.10 0.07 | |
| MIPS15690 | 17:19:22.4+60:14:56.2 | 483, 487, 487 | 22.20 | 125.4 13.6 | 149.1 16.3 | 277.3 34.8 | 879.1 91.6 | 5.66 0.07 | 2.91 0.69 |
| MIPS15755 | 17:18:34.9+59:45:34.1 | 483, 731, 975 | 20.72 | 262.0 26.3 eeThe lRAC flux is taken from the deep catalog of Lacy et al. (2005). | 272.7 27.6 eeThe lRAC flux is taken from the deep catalog of Lacy et al. (2005). | 403.9 41.0 eeThe lRAC flux is taken from the deep catalog of Lacy et al. (2005). | 521.5 53.0 eeThe lRAC flux is taken from the deep catalog of Lacy et al. (2005). | 2.74 0.03 | 3.94 0.13 |
| MIPS15771 | 17:20:11.4+59:36:00.9 | 483, 731, 975 | 24.00 | 20.3 3.2 | 38.2 4.8 | 111.1 18.0 | 387.5 41.3 | 2.53 0.03 | |
| MIPS15776 | 17:20:50.7+59:32:54.6 | 483, 1462, 1706 | 22.19 | 204.8 21.5 | 328.0 33.8 | 607.2 66.0 | 965.3 99.8 | 2.51 0.06 | 2.10 0.42 |
| MIPS15796 | 17:18:44.9+60:00:26.2 | 483, 731, 975 | 24.16 | 191.3 19.5 | 313.1 32.0 | 520.4 54.0 | 822.9 84.7 | 2.26 0.06 | |
| MIPS15871 | 17:19:17.3+59:29:29.3 | 483, 1462, 1706 | 23.26 | 48.7 6.0 | 98.0 11.0 | 225.0 30.3 | 422.1 45.7 | 1.77 0.05 | |
| MIPS15897 | 17:20:17.0+59:27:33.1 | 483, 1462, 1706 | 22.20 | 129.8 13.6 | 223.9 23.6 | 380.5 42.6 | 647.7 67.6 | 1.76 0.05 | |
| MIPS15941 | 17:22:47.8+60:09:46.7 | 483, 1462, 1706 | 23.44 | 52.9 6.8 d,id,ifootnotemark: | 97.9 14.9 d,id,ifootnotemark: | 162.6 20.8 | 316.7 30.3 f,if,ifootnotemark: | 1.52 0.06 | |
| MIPS15967 | 17:19:24.7+59:28:58.7 | 483, 1462, 1706 | 20.93 | 147.3 15.7 | 160.6 16.9 | 219.4 28.1 | 336.5 36.2 | 1.45 0.05 | |
| MIPS15999 | 17:19:35.0+59:42:41.3 | , 1462, 1706 | 22.27 | 34.5 5.1 e,d,ie,d,ifootnotemark: | 40.9 5.9 | 53.6 7.6 eeThe lRAC flux is taken from the deep catalog of Lacy et al. (2005). | 83.0 16.1 | 1.37 0.03 | |
| MIPS16037 | 17:21:33.9+59:50:46.9 | 483, 1462, 1706 | 24.31 | 89.9 9.5 | 214.6 22.7 | 388.5 42.3 | 711.6 73.8 | 1.26 0.06 | 2.16 0.30 |
| MIPS16047 | 17:23:01.4+59:40:54.0 | 483, 1462, 1706 | 20.95 | 164.1 17.1 | 167.9 18.1 | 209.6 26.2 | 275.3 32.3 | 1.29 0.06 | 2.68 0.85 |
| MIPS16066 | 17:21:23.7+59:56:17.4 | 483, 1462, 1706 | 21.99 a,ca,cfootnotemark: | 185.1 19.6 | 171.0 17.9 | 211.7 28.0 | 515.1 54.8 | 1.30 0.06 | |
| MIPS16099 | 17:19:37.5+60:01:24.9 | 483, 1462, 1706 | 23.11 | 74.2 8.4 | 129.7 14.5 | 225.7 28.8 | 421.1 45.8 | 1.24 0.06 | |
| MIPS16118 | 17:22:16.3+59:47:00.8 | , 1462, 1706 | 52.3 6.8 | 35.6 5.1 | 35.9 ggThe flux or limit was remeasured (often due to a misidentification). | 146.4 19.8 | 1.14 0.06 | 2.70 0.77 | |
| MIPS16126 | 17:22:27.5+60:04:30.8 | , 1462, 1706 | 22.20 aaTwo or more possibly interacting sources constitute the -band counterpart of the 24 source. | 28.9 4.3 | 38.2 5.5 | 66.2 15.4 | 170.1 22.2 | 1.09 0.06 | |
| MIPS16132 | 17:21:08.3+59:54:16.0 | 483, 1462, 1706 | 22.00 | 164.3 10.4 d,id,ifootnotemark: | 222.3 23.5 | 338.8 38.0 | 502.3 53.6 | 1.16 0.06 | |
| MIPS16134 | 17:20:46.7+59:37:42.7 | , 1462, 1706 | 23.44 | 28.5 4.2 | 52.1 6.1 | 101.3 18.7 | 239.6 26.8 | 1.17 0.05 | |
| MIPS16135 | 17:22:10.0+59:40:05.5 | , 1462, 1706 | 22.51 | 53.9 17.3 d, id, ifootnotemark: | 60.9 11.9 d, id, ifootnotemark: | 96.4 17.7 | 174.4 22.2 | 1.21 0.06 | |
| MIPS16152 | 17:20:55.8+59:35:41.8 | , 1462, 1706 | 23.01 | 44.2 5.6 d, id, ifootnotemark: | 70.4 10.8 d, id, ifootnotemark: | 99.9 17.8 | 264.5 30.8 | 1.12 0.06 | |
| MIPS16156 | 17:22:56.8+59:30:58.7 | , 1462, 1706 | 21.47 bbThe identification of the optical counterpart is uncertain. | 128.3 36.0 d, id, ifootnotemark: | 101.5 22.4 d, id, ifootnotemark: | 61.8 15.1 | 135.6 18.6 | 1.16 0.06 | 3.68 0.18 |
| MIPS16170 | 17:22:33.3+60:15:14.4 | , 1462, 1706 | 20.52 | 99.3 10.9 | 91.6 10.8 | 41.7 ggThe flux or limit was remeasured (often due to a misidentification). | 225.1 27.4 | 1.09 0.06 | 1.77 0.63 |
| MIPS16202 | 17:22:02.1+59:32:55.6 | 483, 1462, 1706 | 22.64 | 66.9 8.1 | 94.5 10.7 | 162.8 22.0 | 281.6 32.9 | 1.02 0.06 | |
| MIPS16206 | 17:21:10.4+60:06:08.2 | , 1462, 1706 | 94.5 10.4 ddTwo or more sources are blended in this IRAC or MIPS channel. | 147.7 15.7 ddTwo or more sources are blended in this IRAC or MIPS channel. | 82.1 15.4 | 112.3 15.9 | 0.98 0.06 ddTwo or more sources are blended in this IRAC or MIPS channel. | ||
| MIPS16219 | 17:20:13.2+60:10:28.3 | 483, 1462, 1706 | 22.88 | 58.4 6.9 | 110.5 12.3 | 165.7 23.5 | 315.1 36.0 | 1.03 0.06 | |
| MIPS16227 | 17:19:20.2+60:14:48.7 | , 1462, 1706 | 23.92 | 40.3 5.1 | 63.3 7.8 | 109.4 18.9 | 233.0 28.0 | 1.06 0.06 | |
| MIPS16249 | 17:22:08.4+59:45:54.4 | , 1462, 1706 | 20.47 | 54.3 5.9 | 60.7 7.3 | 36.7 9.6 | 132.4 17.9 | 0.99 0.06 | 2.14 0.33 |
| MIPS16267 | 17:19:10.3+60:13:16.0 | 483, 1462, 1706 | 24.36 | 47.9 5.6 | 93.4 11.0 | 155.0 20.1 | 283.6 33.3 | 1.04 0.06 | 1.56 0.37 |
| MIPS22196 | 17:22:45.2+59:03:28.3 | 483, 487, 487 | 21.00 | 215.8 19.6 d, id, ifootnotemark: | 358.9 29.9 d, id, ifootnotemark: | 618.3 66.1 | 1041.1 106.5 | 4.73 0.06 | |
| MIPS22235 | 17:20:17.2+59:16:37.4 | 483, 731, 975 | 20.57 bbThe identification of the optical counterpart is uncertain. | 583.6 58.8 ddTwo or more sources are blended in this IRAC or MIPS channel. | 401.2 41.0 ddTwo or more sources are blended in this IRAC or MIPS channel. | 281.5 32.6 | 299.6 33.1 ddTwo or more sources are blended in this IRAC or MIPS channel. | 3.16 0.07 ddTwo or more sources are blended in this IRAC or MIPS channel. | |
| MIPS22248 | 17:20:03.6+59:19:08.0 | 483, 731, 975 | 21.98 | 114.4 12.4 | 180.5 19.1 | 321.2 38.1 | 609.7 64.9 | 2.98 0.07 | |
| MIPS22307 | 17:19:51.4+58:42:22.8 | 483, 975, 1218 | 20.50 | 171.9 17.7 | 197.7 21.0 | 254.9 29.5 | 403.6 44.1 | 2.02 0.06 | 2.14 0.08 |
| MIPS22323 | 17:22:34.1+59:10:01.7 | 483, 731, 975 | 21.60 | 251.7 25.9 | 230.8 24.3 | 238.6 28.8 | 403.7 44.2 | 1.93 0.07 | |
| MIPS22352 | 17:21:47.7+58:53:55.9 | 483, 1462, 1706 | 20.52 | 228.8 23.8 | 218.5 22.6 | 229.5 30.8 | 294.4 32.7 | 1.72 0.06 | 2.91 0.35 |
| MIPS22356 | 17:20:14.6+59:14:43.6 | 483, 1462, 1706 | 23.37 | 110.8 12.2 | 127.3 13.9 | 200.7 26.5 | 334.0 37.1 | 1.69 0.06 | |
| MIPS22371 | 17:23:00.5+59:11:07.9 | 483, 1462, 1706 | 72.4 8.4 | 115.9 12.8 | 173.9 23.8 | 340.7 37.1 | 1.64 0.06 | 2.84 0.05 | |
| MIPS22379 | 17:19:18.6+59:00:42.6 | 483, 1462, 1706 | 20.87 | 227.3 23.4 | 176.6 18.4 | 256.7 29.9 | 358.0 38.3 | 1.58 0.06 | 3.29 0.11 |
| MIPS22397 | 17:20:06.0+59:17:45.3 | 483, 1462, 1706 | 23.12 | 99.5 11.1 | 169.9 17.7 | 284.4 35.0 | 489.7 50.7 | 1.57 0.06 | |
| MIPS22417 | 17:23:01.6+59:15:01.5 | 483, 1462, 1706 | 22.36 | 57.8 6.4 | 86.9 9.5 | 162.5 20.5 | 296.8 31.9 | 1.52 0.06 | |
| MIPS22432 | 17:21:36.9+59:16:07.8 | 483, 1462, 1706 | 21.80 a, ca, cfootnotemark: | 84.8 9.5 | 146.6 16.0 | 261.1 32.3 | 500.2 53.3 | 1.44 0.06 | 4.00 0.19 |
| MIPS22516 | 17:21:33.7+59:07:28.1 | , 1462, 1706 | 22.26 | 67.7 8.1 hhTwo or more sources that could be at similar redshifts are comprised in the IRAC or MIPS flux. | 69.0 8.1 hhTwo or more sources that could be at similar redshifts are comprised in the IRAC or MIPS flux. | 67.0 15.5 | 97.2 14.4 | 1.32 0.06 | |
| MIPS22527 | 17:18:15.5+59:12:00.7 | 483, 1462, 1706 | 22.87 b,cb,cfootnotemark: | 90.9 9.7 | 139.7 14.5 | 259.9 29.9 | 433.3 44.5 | 1.24 0.06 | |
| MIPS22536 | 17:21:08.3+59:01:16.0 | , 1462, 1706 | bbThe identification of the optical counterpart is uncertain. | 109.6 11.6 | 157.7 16.9 | 69.5 12.5 | 115.1 15.6 | 1.28 0.06 | |
| MIPS22548 | 17:23:30.5+58:45:44.8 | , 1462, 1706 | 9.2 2.8 | 36.6 5.4 | 45.8 13.0 | 228.7 27.4 | 1.28 0.06 | ||
| MIPS22549 | 17:22:13.9+59:17:40.5 | 483, 1462, 1706 | 23.64 | 81.6 8.8 | 134.2 14.8 | 232.0 27.9 | 427.8 46.4 | 1.17 0.06 | 2.30 0.01 |
| MIPS22555 | 17:21:31.0+58:42:49.0 | , 1462, 1706 | 23.71 a, ca, cfootnotemark: | 78.4 9.1 hhTwo or more sources that could be at similar redshifts are comprised in the IRAC or MIPS flux. | 104.8 12.1 hhTwo or more sources that could be at similar redshifts are comprised in the IRAC or MIPS flux. | 152.3 22.0 hhTwo or more sources that could be at similar redshifts are comprised in the IRAC or MIPS flux. | 194.1 25.7 hhTwo or more sources that could be at similar redshifts are comprised in the IRAC or MIPS flux. | 1.19 0.06 hhTwo or more sources that could be at similar redshifts are comprised in the IRAC or MIPS flux. | |
| MIPS22557 | 17:20:25.5+59:13:59.1 | , 1462, 1706 | 20.88 | 128.8 13.5 | 86.1 9.9 | 63.2 12.6 | 87.4 16.0 | 1.12 0.06 | 3.37 0.20 |
| MIPS22621 | 17:23:04.2+58:57:05.0 | , 1462, 1706 | 18.3 3.3 | 23.9 3.6 | 62.6 15.7 | 136.9 17.1 | 0.99 0.06 | ||
| MIPS22633 | 17:22:57.5+59:16:07.3 | , 1462, 1706 | 22.81 | 59.7 7.4 hhTwo or more sources that could be at similar redshifts are comprised in the IRAC or MIPS flux. | 77.0 9.5 hhTwo or more sources that could be at similar redshifts are comprised in the IRAC or MIPS flux. | 62.8 15.1 hhTwo or more sources that could be at similar redshifts are comprised in the IRAC or MIPS flux. | 116.0 17.8 hhTwo or more sources that could be at similar redshifts are comprised in the IRAC or MIPS flux. | 1.00 0.06 hhTwo or more sources that could be at similar redshifts are comprised in the IRAC or MIPS flux. | |
| MIPS22634 | 17:21:13.6+59:22:15.4 | 483, 1462, 1706 | 22.05 | 119.5 12.5 | 147.6 23.9 d, id, ifootnotemark: | 206.3 24.1 | 438.4 47.5 | 0.99 0.06 | |
| MIPS22635 | 17:20:55.0+59:10:39.8 | , 1462, 1706 | 22.64 | 49.8 5.4 | 31.0 5.0 | 37.2 8.7 | 50.7 13.7 | 1.04 0.06 | 2.06 0.25 |
| MIPS22638 | 17:21:54.7+58:54:36.6 | , 1462, 1706 | 23.04 | 67.9 8.1 ffThe flux measurement of the IRAC counterpart of the 24 µm source is uncertain due to the blending of two sources. | 57.7 7.3 ffThe flux measurement of the IRAC counterpart of the 24 µm source is uncertain due to the blending of two sources. | 34.4 ggThe flux or limit was remeasured (often due to a misidentification). | 104.9 18.1 | 1.04 0.06 | 3.49 0.78 |
| MIPS22663 | 17:23:20.7+59:03:43.2 | , 1462, 1706 | 23.15 | 39.3 5.5 | 58.2 6.8 | 111.0 18.7 | 257.2 29.1 | 0.96 0.06 | |
| MIPS22690 | 17:19:49.0+58:54:10.2 | , 1462, 1706 | 23.3 3.3 | 37.4 5.0 | 73.6 13.2 | 162.5 20.4 | 1.01 0.06 | 1.58 0.56 | |
| MIPS22710 | 17:23:28.5+58:52:25.4 | , 1462, 1706 | 24.25 | 30.3 4.0 | 53.5 6.5 | 105.2 16.5 | 234.8 27.4 | 0.99 0.06 | |
| MIPS22722 | 17:18:45.4+58:51:22.8 | , 1706, 1950 | 23.33 | 7.7 2.3 ggThe flux or limit was remeasured (often due to a misidentification). | 17.8 3.1 ggThe flux or limit was remeasured (often due to a misidentification). | 37.3 11.5 ggThe flux or limit was remeasured (often due to a misidentification). | 84.7 15.8 | 0.93 0.06 | |
| MIPS22725 | 17:19:03.7+59:26:57.4 | 483, 1462, 1706 | 22.80 | 87.7 9.8 | 140.0 15.4 | 207.1 26.1 | 365.6 40.6 | 0.83 0.05 | |
| MIPS22744 | 17:23:33.2+59:06:30.5 | , 1462, 1706 | 22.31 | 37.8 5.0 | 57.2 7.2 | 71.2 15.5 | 164.4 22.2 | 0.86 0.06 |
Note. — Columns 2 and 9 are the 24 µm coordinates and fluxes of the targets, respectively, taken from the catalog of Fadda et al. (2004). Column 4 lists the -band magnitudes of the sources in units of Vega mags. The magnitudes are taken from Fadda et al. (2006), unless otherwise noted. Undetected sources in the band are fainter than 25.5 Vega magnitudes. Columns 5,6,7, and 8 list the IRAC fluxes of the sources, taken from Lacy et al. (2004), unless otherwise noted. Because the Lacy et al. (2004) catalog limits are computed based on completeness levels (instead of noise levels), we remeasured the flux limits for all sources that were undetected in any of the IRAC channels. Column 10 lists the band effective radii of the sources measured with Sextractor from HST NICMOS images. In this table, we present measurements for sources with known redshift that can be used for the comparison of their radial extents with their MIR spectral feature properties. The full dataset will be presented in Zamojski et al. (2009, in preparation). For consistency with the photometry in all other bands, closely interacting systems have been treated as a single object.
Notes on individual objects:
| Galaxy | z | confidence | emission lines or features | absorption feature | Lν(14 µm) | |
|---|---|---|---|---|---|---|
| (1) | (2) | (3) | (4) | (5) | (6) | (7) |
| MIPS34 | 1.380.03 | a | PAH 6.2,PAH 7.7,PAH 8.6, [NeII] | silicate | 0.14 | 2.081012 |
| MIPS39 | 2.42 | c | PAH 8.6 | silicate (partial) | 0.87 | |
| MIPS55 | 0.800.03 | a | PAH 11.3,PAH 12.7 | silicate | 0.48 | 4.341011 |
| MIPS159 | ||||||
| MIPS168 | 0.240.01 | a | PAH 7.7,PAH 11.3,PAH 12.7,PAH 17.0 | silicate | 0.74 | 6.31109 |
| MIPS184 | ||||||
| MIPS213 | 1.22 | b | PAH 6.2 | silicate | 0.20 | 5.751011 |
| MIPS224 | 1.470.02 | a | PAH 6.2,PAH 7.7,PAH 8.6,PAH 12.7 | 0.00 | ||
| MIPS268 | 1.69 | b | PAH 7.7 | silicate | 0.67 | |
| MIPS277 | 1.060.02 | a | PAH 7.7,PAH 11.3,PAH 12.7 | 0.00 | 2.581011 | |
| MIPS298 | 3.49 | b | PAH 6.2 | silicate | 3.54 | |
| MIPS322 | ||||||
| MIPS324 | 0.960.01 | a | PAH 6.2,PAH 7.7,PAH 11.3,PAH 12.7, [NeIII] | silicate | 0.19 | 1.591011 |
| MIPS331 | 1.03 | d,f | silicate | |||
| MIPS350 | 0.940.02 | a | PAH 8.6,PAH 11.3,PAH 12.7, [NeIII] | silicate | 0.45 | 2.201011 |
| MIPS351 | ||||||
| MIPS358 | 0.810.02 | a | PAH 11.3,PAH 12.7 | silicate | 0.02 | 6.001010 |
| MIPS369 | 3.21 | e,f | PAH 6.2 | silicate (partial) | ||
| MIPS394 | 0.920.01 | a | PAH 11.3,PAH 12.7 | silicate | 1.08 | 1.111011 |
| MIPS397 | 1.35 | b | silicate | 0.12 | 4.581011 | |
| MIPS419 | 0.83 | c | silicate | 2.60 | 1.401011 | |
| MIPS446 | 0.820.01 | d | PAH 8.6,PAH 12.7, [NeIII] | |||
| MIPS463 | 2.44 | e | PAH 6.2 | |||
| MIPS472 | 0.920.02 | a | PAH 11.3,PAH 12.7 | 1.221011 | ||
| MIPS488 | 0.690.02 | a | PAH 11.3,PAH 12.7,PAH 17.0 | silicate | 0.81 | 6.001010 |
| MIPS495 | ||||||
| MIPS505 | ||||||
| MIPS509 | 2.28 | f | silicate (partial) | |||
| MIPS512 | 0.990.01 | a | PAH 12.7, [NeIII] | silicate | 0.84 | 1.841011 |
| MIPS521 | 2.060.01 | a | PAH 6.2,PAH 7.7,PAH 8.6 | 0.24 | ||
| MIPS530 | 0.890.02 | a | PAH 11.3,PAH 12.7 | silicate | 1.32 | 6.891010 |
| MIPS532 | 1.54 | b | silicate | 1.51 | ||
| MIPS537 | 0.390.01 | a | PAH 6.2,PAH 7.7,PAH 11.3,PAH 12.7, [NeIII],PAH 17.0 | silicate | 0.32 | 1.131010 |
| MIPS542 | 0.910.01 | a | PAH 11.3,PAH 12.7 | silicate | 0.09 | 1.061011 |
| MIPS544 | 0.96 | b | silicate | 1.12 | 1.621011 | |
| MIPS546 | 1.070.01 | a | PAH 7.7,PAH 11.3,PAH 12.7 | silicate | 0.47 | 2.211011 |
| MIPS549 | 0.930.01 | a | PAH 11.3,PAH 12.7,PAH 17.0 | 0.00 | 5.871010 | |
| MIPS562 | 0.540.01 | a | PAH 6.2,PAH 7.7,PAH 11.3,PAH 12.7 | silicate | 1.06 | 4.211010 |
| MIPS7985 | ||||||
| MIPS8040 | 0.760.01 | a | PAH 6.2,PAH 7.7,PAH 11.3,PAH 12.7,PAH 17.0 | silicate | 1.73 | 2.121011 |
| MIPS8069 | 1.45 | e | silicate | 0.28 | ||
| MIPS8071 | 0.98 | d | PAH 12.7 | |||
| MIPS8098 | 1.07 | d | PAH 6.2,PAH 12.7 | |||
| MIPS8107 | 0.940.03 | a | PAH 7.7,PAH 11.3, [NeIII] | silicate | 0.33 | 3.361011 |
| MIPS8121 | 1.210.03 | a | PAH 6.2,PAH 7.7 | silicate | 0.25 | 8.001011 |
| MIPS8157 | ||||||
| MIPS8172 | 1.110.03 | d | PAH 6.2,PAH 11.3 | |||
| MIPS8179 | 0.590.01 | a | PAH 11.3,PAH 12.7, [NeIII] | silicate | 0.55 | 7.621010 |
| MIPS8185 | ||||||
| MIPS8192 | ||||||
| MIPS8204 | 0.840.02 | a | PAH 11.3,PAH 12.7 | 1.491011 | ||
| MIPS8224 | ||||||
| MIPS8226 | 2.10 | c | PAH 7.7 | silicate | 0.41 | |
| MIPS8233 | ||||||
| MIPS8251 | 1.94 | b | PAH 7.7 | silicate | 0.59 | |
| MIPS8253 | 0.960.01 | a | PAH 7.7,PAH 11.3,PAH 12.7, [NeIII] | silicate | 2.03 | 2.181011 |
| MIPS8308 | 0.370.01 | a | PAH 11.3,PAH 12.7 | 6.41109 | ||
| MIPS8311 | 1.180.01 | a | PAH 7.7,PAH 11.3,PAH 12.7 | silicate | 1.13 | 3.091011 |
| MIPS8315 | ||||||
| MIPS8325 | 0.610.02 | a | PAH 11.3,PAH 12.7, [NeIII] | silicate | 1.14 | 6.911010 |
| MIPS8328 | 1.02 | b | PAH 11.3 | silicate | 0.26 | 1.831011 |
| MIPS8360 | 1.500.02 | a | PAH 6.2,PAH 7.7,PAH 11.3,PAH 12.7 | silicate | 0.57 | |
| MIPS8371 | 0.350.01 | a | PAH 6.2,PAH 7.7,PAH 11.3,PAH 12.7,PAH 17.0 | silicate | 0.43 | 9.24109 |
| MIPS8375 | 0.870.01 | a | PAH 11.3,PAH 12.7, [NeIII] | silicate | 0.92 | 1.151011 |
| MIPS8377 | 0.840.01 | a | PAH 11.3,PAH 12.7, [NeIII] | silicate | 1.67 | 1.171011 |
| MIPS8384 | 0.920.01 | a | PAH 6.2,PAH 7.7,PAH 11.3,PAH 12.7, [NeIII] | silicate | 0.01 | 1.871011 |
| MIPS8387 | 0.920.01 | a | PAH 11.3,PAH 12.7 | 0.00 | 6.601010 | |
| MIPS8388 | 1.140.02 | a | PAH 11.3,PAH 12.7 | silicate | 0.11 | 2.531011 |
| MIPS8392 | 1.90 | b | silicate | 4.56 | ||
| MIPS8400 | ||||||
| MIPS8401 | 0.570.01 | a | PAH 11.3,PAH 12.7 | silicate | 0.52 | 4.771010 |
| MIPS8405 | 1.170.01 | a | PAH 7.7,PAH 11.3,PAH 12.7 | 0.00 | 3.361011 | |
| MIPS8407 | ||||||
| MIPS8409 | 0.740.04 | d | PAH 12.7,PAH 17.0 | |||
| MIPS8411 | 2.06 | c | PAH 7.7 | silicate | 0.26 | |
| MIPS8413 | 2.18 | d,f | PAH 6.2 | silicate | ||
| MIPS8424 | 1.59 | b | PAH 12.7 | silicate | 0.20 | |
| MIPS8430 | 0.670.01 | a | PAH 11.3,PAH 12.7, [NeIII] | silicate | 1.15 | 4.591010 |
| MIPS8450 | 1.010.01 | a | PAH 7.7,PAH 11.3,PAH 12.7 | 0.00 | 8.671010 | |
| MIPS8462 | 1.010.02 | a | PAH 11.3,PAH 12.7 | silicate | 0.19 | 2.111011 |
| MIPS8465 | ||||||
| MIPS8477 | 1.840.01 | a | PAH 7.7,PAH 11.3 | silicate | 0.41 | |
| MIPS8479 | 1.30 | b | silicate | 2.36 | 1.311012 | |
| MIPS8495 | 1.28 | b | PAH 8.6 | silicate | 0.08 | 3.261011 |
| MIPS8499 | 0.600.02 | a | PAH 11.3,PAH 12.7 | 5.101010 | ||
| MIPS8507 | 0.760.02 | a | PAH 11.3,PAH 12.7,PAH 17.0 | silicate | 0.75 | 5.691010 |
| MIPS8521 | 1.190.02 | a | PAH 7.7,PAH 12.7 | silicate | 1.90 | 5.021011 |
| MIPS8526 | 0.84 | b,g | PAH 12.7 | silicate | 1.36 | 7.981010 |
| MIPS8532 | 0.860.01 | a | PAH 11.3,PAH 12.7, [NeIII] | silicate | 0.59 | 1.081011 |
| MIPS8543 | 0.650.01 | a | PAH 11.3,PAH 12.7 | silicate | 0.34 | 8.941010 |
| MIPS8550 | 0.87 | b | silicate | 2.24 | 1.241011 | |
| MIPS15678 | 1.37 | d | PAH 6.2,PAH 11.3,PAH 12.7 | |||
| MIPS15690 | 0.85 | b | PAH 12.7 | silicate | 0.04 | 6.791011 |
| MIPS15755 | 0.730.02 | a | PAH 6.2,PAH 7.7,PAH 11.3,PAH 12.7, [NeIII],PAH 17.0 | 0.00 | 2.271011 | |
| MIPS15771 | 1.32 | d,e,f | silicate | |||
| MIPS15776 | 1.12 | b | PAH 12.7 | silicate | 0.48 | 6.631011 |
| MIPS15796 | 1.45 | f | silicate | |||
| MIPS15871 | ||||||
| MIPS15897 | 1.62 | d | PAH 11.3,PAH 12.7 | |||
| MIPS15941 | 1.23 | e,f | silicate | |||
| MIPS15967 | ||||||
| MIPS15999 | 0.570.01 | a | PAH 12.7, [NeIII] | silicate | 0.76 | 6.161010 |
| MIPS16037 | 1.64 | b | PAH 12.7 | silicate | 1.04 | |
| MIPS16047 | 0.520.02 | a | PAH 7.7, [NeIII] | silicate | 1.13 | 4.551010 |
| MIPS16066 | 1.00 | b | PAH 7.7 | silicate | 0.87 | 3.131011 |
| MIPS16099 | 0.95 | d | [NeIII] | silicate | ||
| MIPS16118 | 2.61 | c | PAH 6.2 | silicate (partial) | ||
| MIPS16126 | ||||||
| MIPS16132 | ||||||
| MIPS16134 | 1.20 | d | PAH 12.7 | silicate | ||
| MIPS16135 | 0.62 | d | PAH 12.7 | |||
| MIPS16152 | 1.83 | c | PAH 7.7 | silicate | 1.19 | |
| MIPS16156 | 0.72 | b | [NeIII] | silicate | 0.48 | 6.701010 |
| MIPS16170 | 0.320.01 | a | PAH 11.3,PAH 12.7 | 1.071010 | ||
| MIPS16202 | ||||||
| MIPS16206 | 0.870.02 | a | PAH 11.3,PAH 12.7, [NeIII] | silicate | 0.49 | 1.141011 |
| MIPS16219 | ||||||
| MIPS16227 | 2.15 | e | PAH 7.7 | |||
| MIPS16249 | 0.530.02 | a | PAH 11.3,PAH 12.7 | 3.371010 | ||
| MIPS16267 | 1.31 | b | PAH 12.7 | silicate | 0.61 | 5.571011 |
| MIPS22196 | ||||||
| MIPS22235 | 0.420.01 | a | PAH 7.7,PAH 8.6,PAH 11.3,PAH 12.7 | silicate | 0.55 | 8.331010 |
| MIPS22248 | ||||||
| MIPS22307 | 0.700.01 | a | PAH 6.2,PAH 7.7,PAH 8.6,PAH 11.3 | 0.00 | 1.331011 | |
| MIPS22323 | 1.210.01 | a | PAH 6.2,PAH 7.7,PAH 12.7 | silicate | 0.10 | 5.281011 |
| MIPS22352 | 0.660.01 | a | PAH 6.2,PAH 7.7,PAH 11.3,PAH 12.7 | silicate | 0.19 | 7.611010 |
| MIPS22356 | 1.130.01 | a | PAH 8.6,PAH 11.3,PAH 12.7 | silicate | 0.39 | 6.221011 |
| MIPS22371 | 1.670.01 | a | PAH 6.2,PAH 7.7,PAH 11.3 | silicate | 0.37 | |
| MIPS22379 | 0.650.02 | a | PAH 8.6,PAH 11.3 | silicate | 0.13 | 8.551010 |
| MIPS22397 | ||||||
| MIPS22417 | 1.960.02 | a | PAH 6.2,PAH 8.6,PAH 11.3 | silicate (partial) | 0.90 | |
| MIPS22432 | 1.590.01 | a | PAH 6.2,PAH 11.3,PAH 12.7 | silicate | 1.18 | |
| MIPS22516 | 1.35 | e | PAH 7.7 | |||
| MIPS22527 | ||||||
| MIPS22536 | 1.590.02 | b | PAH 6.2,PAH 11.3 | silicate | 0.51 | |
| MIPS22548 | 2.12 | f | silicate (partial) | |||
| MIPS22549 | 1.050.01 | a | PAH 11.3,PAH 12.7 | silicate | 0.01 | 2.461011 |
| MIPS22555 | 1.88 | b | silicate | 0.08 | ||
| MIPS22557 | 0.780.01 | a | PAH 11.3,PAH 12.7, [NeIII] | silicate | 9.361010 | |
| MIPS22621 | 0.59 | e | PAH 12.7 | |||
| MIPS22633 | 2.20 | e | PAH 6.2 | |||
| MIPS22634 | ||||||
| MIPS22635 | 0.800.01 | a | PAH 11.3,PAH 12.7 | silicate | 0.78 | 1.251011 |
| MIPS22638 | 0.99 | b | [NeII] | silicate | 0.39 | 1.721011 |
| MIPS22663 | ||||||
| MIPS22690 | 2.07 | b | silicate | 0.39 | ||
| MIPS22710 | ||||||
| MIPS22722 | 1.71 | b | PAH 8.6 | silicate | 0.55 | |
| MIPS22725 | ||||||
| MIPS22744 |
Note. — Column (2): Redshifts based on MIR spectra. Uncertainties are given for all sources that have more than two 3 detected emission lines or features. For all other sources, the plausible redshift uncertainty is in the range [0.01,0.3].
Column (3): Classification of the confidence of the MIR redshift. The letters correspond to:
a: The reshift is confirmed by more than two emission lines or features that have detections.
b: The redshift is either derived from a single emission line but confirmed from the 9.7 µm silicate absorption feature or measured from the silicate absorption feature. The uncertainty in this redshift measurement is typically of order 0.1, but it can be as high as 0.3.
c: The redshift is measured from a single emission line and confirmed by the presence of part of the 9.7 µm silicate feature in the spectrum. The accuracy of the measurement can be lower than that of category (b).
d: More than one solutions are possible. This redshift is uncertain.
e: Only one line or feature had a significant detection. This redshift is also uncertain.
f: Only part of the 9.7 µm silicate absorption feature was seen in the MIPS spectral range, or the silicate feature had a very small optical depth, 0.1. This redshift is uncertain.
g: This spectrum contains features of two spatially unresolved sources, one at =0.84, and a somewhat fainter at =0.91. This could either be a binary merging system, or sources that neighbour each other due to projection effects.
Column (4): Emission lines or dust features used for the computation of each source’s redshift. These features have a signal-to-noise ratio greater than 3 when fitted with a Lorentzian profile. Unless otherwise noted, the 12.7 complex refers to the blended 12.6 and 12.7 µm dust features and the [NeII] line.
Column (5): Indicates whether the 9.7 µm silicate absorption feature was used in the redshift computation. Partially detected silicate absorption features were not used for that purpose.
Column (6): The 9.7 µm silicate feature optical depth was measured with PAHFIT for sources with reliable redshifts, i.e. with confidence classification a,b, or c in column 3.
Column (7):The rest-frame monochromatic 14 µm luminosity is given in units of solar luminosity for sources with reliable redshift measurements.
| Galaxy | f6.2 | f7.7 | f8.6 | f[SIV] | ||||
|---|---|---|---|---|---|---|---|---|
| (MIPS) | (Wcm-2) | (µm) | (Wcm-2) | (µm) | (Wcm-2) | (µm) | (Wcm-2) | (µm) |
| MIPS34 | 6.65(1.13) | 0.070.01 | 3.71(0.41) | 0.420.05 | 3.31 | 5.19 | ||
| MIPS39 | 3.02(0.67) | 0.030.01 | 2.85(0.19) | 0.420.03 | ||||
| MIPS55 | 7.40(1.47) | 0.220.04 | 1.99(0.46) | 0.060.01 | ||||
| MIPS168 | 4.73(0.43) | 9.700.88 | 8.10(1.61) | 1.830.36 | 1.27 | |||
| MIPS213 | 3.98 | 6.22 | 2.59 | 4.24 | ||||
| MIPS224 | 5.30(0.57) | 0.330.04 | 1.53(0.19) | 0.920.11 | 5.01(0.79) | 0.290.05 | 5.20(1.19) | 0.030.01 |
| MIPS268 | 2.82(0.80) | 0.090.03 | 1.60(0.26) | 0.640.10 | 1.04 | 7.73(1.17) | 0.060.01 | |
| MIPS277 | 1.91(0.16) | 1.200.10 | 5.67(1.08) | 0.380.07 | 6.15 | |||
| MIPS298 | 2.07(0.45) | 0.110.02 | 2.15 | |||||
| MIPS324 | 5.41(1.11) | 0.350.07 | 1.81(0.16) | 1.400.12 | 4.01(1.00) | 0.350.09 | 1.16 | |
| MIPS350 | 1.18(0.11) | 2.880.27 | 1.34 | |||||
| MIPS358 | 8.97 | |||||||
| MIPS394 | 1.31 | |||||||
| MIPS397 | 3.17(0.90) | 0.170.05 | 1.45(0.26) | 0.970.17 | 3.74 | 3.60 | ||
| MIPS419 | 6.81 | |||||||
| MIPS472 | 1.09 | |||||||
| MIPS488 | 1.87 | |||||||
| MIPS512 | 2.96 | 9.35 | 3.95 | 1.41 | ||||
| MIPS521 | 5.87(1.04) | 0.690.12 | 1.87(0.28) | 2.970.44 | 3.69(0.52) | 0.750.11 | 1.12(0.17) | 0.35 0.05 |
| MIPS530 | 1.18 | |||||||
| MIPS532 | 2.91 | 4.85(0.33) | 2.340.16 | 2.17 | 5.54 | |||
| MIPS537 | 1.14(0.10) | 1.890.17 | 3.66(0.29) | 7.310.58 | 1.01(0.12) | 2.560.30 | 1.06 | |
| MIPS542 | 1.17 | |||||||
| MIPS544 | 5.55 | 2.00 | ||||||
| MIPS546 | 5.69(0.32) | 19.261.08 | 1.36(0.12) | 4.440.39 | 7.52 | |||
| MIPS549 | 5.94(1.11) | 1.190.22 | 1.33 | |||||
| MIPS562 | 1.72(0.12) | 2.230.16 | 5.96(0.41) | 7.250.50 | 5.09(1.67) | 0.780.26 | 2.00 | |
| MIPS8040 | 1.74(0.09) | 0.640.03 | 5.70(0.47) | 2.300.19 | 1.80(0.13) | 1.060.08 | 9.95(3.01) | 0.090.03 |
| MIPS8107 | 4.51 | 1.99(0.45) | 1.060.24 | 3.15(0.91) | 0.210.06 | 1.21 | ||
| MIPS8121 | 2.88(0.75) | 0.100.03 | 2.00(0.24) | 0.770.09 | 3.44 | 4.77 | ||
| MIPS8179 | 2.53 | 3.70 | 4.37 | 1.11 | ||||
| MIPS8204 | 1.32 | |||||||
| MIPS8226 | 2.96 | 1.07(0.26) | 0.690.17 | 2.04 | 7.47 | |||
| MIPS8251 | 3.16 | 1.14(0.08) | 0.720.05 | 2.22(0.52) | 0.170.04 | 6.60 | ||
| MIPS8253 | 1.92(0.10) | 0.070.00∗ | 2.48(0.08) | 1.390.04 | 4.51(0.87) | 0.460.09 | 3.82(1.07) | 0.080.02 |
| MIPS8308 | ||||||||
| MIPS8311 | 1.77(0.12) | 1.270.09 | 5.81 | 5.89 | ||||
| MIPS8325 | 1.80 | |||||||
| MIPS8328 | 4.08 | 9.84 | ||||||
| MIPS8360 | 6.03(1.01) | 0.450.08 | 1.42(0.34) | 0.960.23 | 3.68(0.86) | 0.260.06 | 4.42(1.18) | 0.030.01 |
| MIPS8371 | 1.59(0.12) | 2.090.16 | 5.32(0.37) | 9.810.68 | 1.10(0.12) | 2.690.29 | 1.25 | |
| MIPS8375 | 1.44(0.32) | 0.380.09 | ||||||
| MIPS8377 | 1.60(0.37) | 0.670.16 | ||||||
| MIPS8384 | 3.40 | 2.20(0.12) | 1.980.11 | 2.91 | 9.87 | |||
| MIPS8387 | ||||||||
| MIPS8388 | 2.29(0.39) | 2.180.37 | 6.72(1.25) | 0.840.16 | 6.45 | |||
| MIPS8392 | 1.21 | 2.73(0.42) | 1.910.29 | 1.22 | 1.44 | |||
| MIPS8401 | 1.21 | |||||||
| MIPS8405 | 3.92(0.29) | 8.010.59 | 9.81(1.17) | 1.630.19 | 5.19 | |||
| MIPS8411 | 2.78(0.73) | 0.190.05 | 7.23(1.82) | 0.620.16 | 1.27(0.42) | 0.120.04 | ||
| MIPS8424 | 2.58 | 1.62(0.26) | 1.610.26 | 2.01(0.66) | 0.200.06 | 3.96 | ||
| MIPS8430 | 9.78 | |||||||
| MIPS8450 | 4.97(0.28) | 7.110.40 | 1.08(0.11) | 2.070.21 | 7.08 | |||
| MIPS8462 | 1.98(0.60) | 4.491.36 | 3.64(1.16) | 0.750.24 | 7.62 | |||
| MIPS8477 | 3.63(0.86) | 0.350.08 | 1.09(0.33) | 1.190.36 | 1.86 | 4.64(1.12) | 0.060.02 | |
| MIPS8479 | 1.25 | 5.57 | ||||||
| MIPS8495 | 2.21 | 1.49(0.23) | 1.000.15 | 3.04 | 7.15(1.36) | 0.060.01 | ||
| MIPS8499 | 1.01 | |||||||
| MIPS8507 | 1.04 | |||||||
| MIPS8521 | 6.27 | 4.30(0.29) | 1.860.13 | 5.72(1.04) | 0.430.08 | 5.57 | ||
| MIPS8526 | 1.74 | |||||||
| MIPS8532 | 1.33 | |||||||
| MIPS8543 | 1.39 | |||||||
| MIPS8550 | 4.50 | |||||||
| MIPS15690 | 2.59 | 4.21(0.30) | 0.710.05 | 4.62 | 1.39 | |||
| MIPS15755 | 1.89(0.11) | 0.840.05 | 6.65(0.34) | 3.360.17 | 1.68(0.15) | 0.870.08 | 1.06 | |
| MIPS15776 | 3.59 | 1.44(0.29) | 0.350.07 | 3.14 | 6.02 | |||
| MIPS15999 | 1.19 | |||||||
| MIPS16037 | 2.17(0.70) | 0.050.02 | 3.14(0.25) | 1.090.09 | 1.27 | 6.42 | ||
| MIPS16047 | 4.93(1.26) | 0.300.08 | 2.00(0.35) | 1.360.24 | 9.89(1.18) | 0.900.11 | 1.81 | |
| MIPS16066 | 3.79 | 3.04(0.30) | 1.760.17 | 4.11(0.98) | 0.350.08 | 1.65 | ||
| MIPS16118 | 2.38 | |||||||
| MIPS16152 | 1.27 | 2.10(0.52) | 0.210.05 | 9.93 | ||||
| MIPS16156 | 1.16 | |||||||
| MIPS16170 | ||||||||
| MIPS16206 | 1.02 | |||||||
| MIPS16249 | 8.61 | |||||||
| MIPS16267 | 3.25 | 1.72(0.35) | 0.760.15 | 4.36 | 5.19 | |||
| MIPS22235 | 3.35(1.11) | 0.430.14 | 1.83(0.15) | 2.070.17 | 8.33(1.79) | 0.810.17 | 1.87 | |
| MIPS22307 | 1.31(0.12) | 0.690.06 | 3.56(0.44) | 2.070.26 | 1.28(0.11) | 0.780.07 | 9.21 | |
| MIPS22323 | 3.59 | 1.43(0.33) | 0.530.12 | 3.98 | 6.41 | |||
| MIPS22352 | 1.92(0.11) | 2.090.12 | 7.81(0.43) | 11.270.62 | 1.49(0.12) | 2.350.19 | 9.48 | |
| MIPS22356 | 4.45 | 1.50(0.46) | 0.780.24 | 6.44(1.12) | 0.350.06 | 4.46 | ||
| MIPS22371 | 4.37(0.74) | 0.180.03 | 1.20(0.32) | 0.500.13 | 1.86 | 6.02(1.10) | 0.030.01 | |
| MIPS22379 | 3.05 | 9.97(3.14) | 0.800.25 | 4.59(1.27) | 0.410.11 | 8.73 | ||
| MIPS22417 | 5.02(0.69) | 0.210.03 | 1.02(0.08) | 0.670.05 | 5.20(0.48) | 0.550.05 | 5.67 | |
| MIPS22432 | 9.25(0.80) | 0.260.02 | 5.50(0.23) | 2.370.10 | 8.01(0.62) | 0.610.05 | 4.19(1.06) | 0.060.02 |
| MIPS22536 | 4.38(0.91) | 0.270.06 | 2.55(0.33) | 1.770.23 | 5.88(0.77) | 0.480.06 | 5.79 | |
| MIPS22549 | 2.20 | 1.92(0.25) | 1.590.21 | 3.69(1.04) | 0.350.10 | 5.73 | ||
| MIPS22555 | 8.50 | 1.72 | 4.92 | |||||
| MIPS22557 | 1.21 | |||||||
| MIPS22635 | 1.82 | |||||||
| MIPS22638 | 4.00 | 1.10 | ||||||
| MIPS22690 | 2.62 | 4.24(0.63) | 0.310.05 | 1.80(0.45) | 0.180.05 | 6.31 | ||
| MIPS22722 | 9.24(2.61) | 0.710.20 |
Note. — Fluxes may not be given for lines that are in the IRS wavelength range when their neighboring continuum cannot be well determined.
* Error bars of 0 correspond to EW uncertainties that are lower than the selected measurement accuracy.
| Galaxy | f11.3 | f12.7 | f[NeII] | f[NeIII] | ||||
|---|---|---|---|---|---|---|---|---|
| (MIPS) | (Wcm-2) | (µm) | (Wcm-2) | (µm) | (Wcm-2) | (µm) | (Wcm-2) | (µm) |
| MIPS34 | 2.01(0.54) | 0.020.01 | 1.12 | 5.58(1.79) | 0.010.00∗ | |||
| MIPS39 | ||||||||
| MIPS55 | 8.97(1.56) | 0.280.05 | 5.14(1.58) | 0.130.04 | 1.59(0.24) | 0.040.01 | 1.11 | |
| MIPS168 | 4.86(1.46) | 0.960.28 | 9.68(1.57) | 1.450.24 | 3.00(0.31) | 0.450.05 | 1.30 | |
| MIPS213 | 1.15 | 7.08 | 3.35 | |||||
| MIPS224 | 2.34(0.35) | 0.130.02 | 7.42 | 3.73 | ||||
| MIPS268 | 1.86(0.47) | 0.140.04 | 2.01 | 8.71 | ||||
| MIPS277 | 5.94(0.58) | 0.490.05 | 2.84(0.78) | 0.250.07 | 3.44 | |||
| MIPS298 | ||||||||
| MIPS324 | 6.57(0.59) | 0.640.06 | 2.66(0.57) | 0.260.06 | 4.69(1.32) | 0.040.01 | 7.91(1.19) | 0.090.01 |
| MIPS350 | 6.18(0.55) | 0.710.06 | 4.90(0.63) | 0.420.05 | 9.30(1.41) | 0.070.01 | 1.03(0.13) | 0.070.01 |
| MIPS358 | 1.19(0.10) | 3.350.28 | 1.24(0.07) | 2.720.15 | 1.98(0.15) | 0.410.03 | 5.54(1.22) | 0.080.02 |
| MIPS394 | 8.87(0.60) | 3.660.25 | 9.57(0.53) | 2.480.14 | 8.52(1.25) | 0.210.03 | 5.67 | |
| MIPS397 | 7.31 | 2.14(0.40) | 0.160.03 | 3.07 | ||||
| MIPS419 | 2.91 | 2.32 | 4.61 | 4.54 | ||||
| MIPS472 | 8.60(0.62) | 2.170.16 | 5.14(0.62) | 1.350.16 | 1.07(0.12) | 0.280.03 | 4.17 | |
| MIPS488 | 1.44(0.10) | 2.780.19 | 6.69(1.21) | 1.060.19 | 1.62(0.22) | 0.260.04 | 4.97 | |
| MIPS512 | 2.13(0.46) | 0.310.07 | 3.00(0.53) | 0.370.07 | 4.95 | 5.74(1.26) | 0.070.02 | |
| MIPS521 | 4.55(0.83) | 1.340.24 | ||||||
| MIPS530 | 6.61(0.76) | 3.570.41 | 6.17(0.96) | 2.120.33 | 7.72(1.44) | 0.260.05 | 6.67 | |
| MIPS532 | 1.58 | 2.22(0.17) | 0.100.01 | 9.37 | ||||
| MIPS537 | 1.54(0.07) | 5.720.26 | 8.35(0.97) | 2.830.33 | 3.33(0.27) | 1.160.09 | 9.55(1.64) | 0.240.04 |
| MIPS542 | 5.93(0.62) | 2.600.27 | 6.55(0.65) | 2.960.29 | 8.98(1.23) | 0.420.06 | 6.80(1.35) | 0.340.07 |
| MIPS544 | 2.53(0.53) | 0.380.08 | 2.21 | 4.68 | 5.47 | |||
| MIPS546 | 1.22(0.05) | 2.580.11 | 8.17(0.62) | 1.370.10 | 1.57(0.12) | 0.260.02 | 9.52(1.68) | 0.160.03 |
| MIPS549 | 5.70(0.67) | 1.070.13 | 5.87(0.54) | 1.140.10 | 6.18(1.21) | 0.120.02 | 3.52 | |
| MIPS562 | 1.23(0.07) | 2.430.14 | 1.48(0.11) | 2.520.19 | 2.44(0.30) | 0.430.05 | 7.42(1.25) | 0.170.03 |
| MIPS8040 | 1.85(0.12) | 1.220.08 | 1.05(0.11) | 0.470.05 | 2.14(0.20) | 0.090.01 | 5.96 | |
| MIPS8107 | 3.63(0.48) | 0.240.03 | 1.11(0.19) | 0.060.01 | 5.90(0.99) | 0.030.01 | 3.45(1.07) | 0.020.01 |
| MIPS8121 | 1.84(0.40) | 0.080.02 | 2.97(0.61) | 0.120.02 | 3.28(0.98) | 0.010.00∗ | ||
| MIPS8179 | 3.97(0.81) | 0.370.08 | 3.75(1.20) | 0.300.10 | 1.21 | 6.69(1.05) | 0.050.01 | |
| MIPS8204 | 1.16(0.09) | 1.320.10 | 9.52(0.68) | 0.960.07 | 1.38(0.15) | 0.130.02 | 3.73 | |
| MIPS8226 | ||||||||
| MIPS8251 | ||||||||
| MIPS8253 | 3.55(0.47) | 0.510.07 | 5.67(0.59) | 0.460.05 | 6.04(1.07) | 0.040.01 | 6.64(1.11) | 0.050.01 |
| MIPS8308 | 9.38(0.84) | 1.420.13 | 6.67(1.35) | 1.010.20 | 8.37 | 6.36 | ||
| MIPS8311 | 6.13(0.41) | 0.620.04 | 1.84(0.58) | 0.150.05 | 6.41(1.19) | 0.050.01 | 9.97 | |
| MIPS8325 | 6.44(0.90) | 0.860.12 | 6.00 | 2.05(0.33) | 0.200.03 | 8.29(1.31) | 0.080.01 | |
| MIPS8328 | 4.82(0.69) | 0.490.07 | 3.24(0.99) | 0.310.09 | 7.22(1.73) | 0.070.02 | 7.29 | |
| MIPS8360 | 4.36(0.42) | 0.320.03 | 4.11(0.87) | 0.270.06 | 5.66(1.56) | 0.040.01 | ||
| MIPS8371 | 1.89(0.07) | 7.500.28 | 1.38(0.11) | 5.080.40 | 2.77(0.24) | 1.060.09 | 1.04 | |
| MIPS8375 | 8.00(0.73) | 1.700.16 | 5.82(0.80) | 0.830.11 | 1.04(0.13) | 0.140.02 | 1.37(0.12) | 0.130.01 |
| MIPS8377 | 9.57(0.90) | 2.970.28 | 7.74(0.91) | 1.700.20 | 1.33(0.13) | 0.290.03 | 9.89(1.30) | 0.290.04 |
| MIPS8384 | 6.13(0.53) | 0.580.05 | 7.90(2.13) | 0.070.02 | 6.95(1.09) | 0.060.01 | 6.26(1.13) | 0.060.01 |
| MIPS8387 | 1.10(0.07) | 2.690.17 | 5.63(0.68) | 1.510.18 | 6.11(1.20) | 0.170.03 | 4.68 | |
| MIPS8388 | 7.52(0.50) | 1.080.07 | 5.27(0.71) | 0.670.09 | 7.09(1.24) | 0.090.02 | 8.62(1.87) | 0.090.02 |
| MIPS8392 | 3.06(0.97) | 1.580.50 | ||||||
| MIPS8401 | 1.33(0.09) | 3.430.23 | 1.09(0.14) | 2.050.26 | 3.25(0.41) | 0.600.08 | 4.94(1.29) | 0.070.02 |
| MIPS8405 | 5.90(0.48) | 0.650.05 | 7.90(0.77) | 0.800.08 | 1.69(0.11) | 0.160.01 | 9.17(2.35) | 0.080.02 |
| MIPS8411 | ||||||||
| MIPS8424 | 1.04(0.20) | 0.070.01 | 8.63(0.79) | 0.470.04 | 4.80 | |||
| MIPS8430 | 4.57(1.04) | 1.030.23 | 6.53 | 1.30(0.21) | 0.190.03 | 5.25(1.43) | 0.080.02 | |
| MIPS8450 | 1.08(0.05) | 3.930.18 | 7.25(0.59) | 3.230.26 | 1.15(0.12) | 0.550.06 | ||
| MIPS8462 | 2.97(0.58) | 0.330.06 | 3.11(0.72) | 0.280.06 | 8.91(1.16) | 0.070.01 | 5.97(1.48) | 0.050.01 |
| MIPS8477 | 3.04(0.52) | 0.380.07 | ||||||
| MIPS8479 | 5.34 | 4.47(0.64) | 0.140.02 | 8.37 | ||||
| MIPS8495 | 6.20 | 1.30 | 5.40(1.11) | 0.060.01 | ||||
| MIPS8499 | 1.49(0.09) | 7.860.47 | 1.41(0.13) | 5.550.51 | 1.94(0.33) | 0.730.13 | 2.95 | |
| MIPS8507 | 7.46(0.98) | 1.330.17 | 7.54(0.87) | 1.260.15 | 6.25(1.83) | 0.110.03 | 4.89 | |
| MIPS8521 | 3.55(0.42) | 0.330.04 | 4.27(0.56) | 0.240.03 | 6.17 | 1.16 | ||
| MIPS8526 | 1.04(0.09) | 2.370.21 | 4.00(0.83) | 0.720.15 | 5.77(1.50) | 0.100.03 | 6.38 | |
| MIPS8532 | 4.61(0.83) | 0.790.14 | 1.25 | 5.80(1.66) | 0.080.02 | 6.35(1.13) | 0.100.02 | |
| MIPS8543 | 2.73(0.09) | 3.190.11 | 1.83(0.15) | 2.010.16 | 1.83(0.35) | 0.200.04 | 4.81 | |
| MIPS8550 | 9.33 | 5.21 | 3.21 | 3.18 | ||||
| MIPS15690 | 3.30 | 2.84(0.37) | 0.050.01 | 6.28 | 7.45(1.21) | 0.010.00∗ | ||
| MIPS15755 | 2.58(0.12) | 1.430.07 | 1.47(0.10) | 0.830.06 | 2.48(0.23) | 0.140.01 | 8.64(1.05) | 0.050.01 |
| MIPS15776 | 3.05(0.37) | 0.100.01 | 1.43(0.22) | 0.040.01 | 3.72 | |||
| MIPS15999 | 6.63(0.95) | 1.240.18 | 5.59 | 2.30(0.36) | 0.260.04 | 1.02(0.17) | 0.100.02 | |
| MIPS16037 | 2.07 | 1.43(0.34) | 0.060.01 | 5.99 | ||||
| MIPS16047 | 3.58(0.77) | 0.340.07 | 5.29 | 1.01(0.33) | 0.070.02 | 8.38(1.28) | 0.070.01 | |
| MIPS16066 | 4.68(0.53) | 0.430.05 | 3.43(0.50) | 0.230.03 | 4.19 | 4.37(1.12) | 0.030.01 | |
| MIPS16118 | ||||||||
| MIPS16152 | 2.20(0.52) | 0.400.09 | ||||||
| MIPS16156 | 4.86(0.75) | 0.940.15 | 1.67(0.37) | 0.230.05 | 5.39 | 8.00(1.25) | 0.100.02 | |
| MIPS16170 | 1.11(0.09) | 2.920.24 | 5.27(1.26) | 1.000.24 | 1.56(0.23) | 0.280.04 | 1.00 | |
| MIPS16206 | 9.59(0.81) | 1.070.09 | 3.95(0.83) | 0.480.10 | 7.63(1.38) | 0.090.02 | 5.60(1.45) | 0.110.03 |
| MIPS16249 | 1.04(0.08) | 2.000.15 | 5.48(1.25) | 0.860.20 | 1.18(0.32) | 0.170.05 | 7.77(1.33) | 0.100.02 |
| MIPS16267 | 1.78 | 2.61 | 3.95 | |||||
| MIPS22235 | 2.64(0.11) | 1.340.06 | 2.32(0.14) | 0.870.05 | 4.43(0.34) | 0.150.01 | 7.33 | |
| MIPS22307 | 1.07(0.10) | 0.690.06 | 7.92(0.99) | 0.510.06 | 9.35(1.91) | 0.060.01 | 8.36(1.17) | 0.050.01 |
| MIPS22323 | 5.59(0.51) | 0.270.02 | 2.30(0.65) | 0.120.03 | 1.03(0.14) | 0.060.01 | ||
| MIPS22352 | 2.07(0.10) | 2.830.14 | 1.23(0.15) | 1.470.18 | 1.76(0.21) | 0.210.03 | 6.19(1.23) | 0.060.01 |
| MIPS22356 | 3.92(0.44) | 0.200.02 | 3.34(0.64) | 0.150.03 | 5.96(1.25) | 0.020.00∗ | 7.05(1.70) | 0.030.01 |
| MIPS22371 | 4.66(0.36) | 0.260.02 | 1.94(0.38) | 0.110.02 | 5.94 | |||
| MIPS22379 | 5.00(0.77) | 0.440.07 | 1.50(0.46) | 0.120.04 | 6.03 | 4.40(1.10) | 0.030.01 | |
| MIPS22417 | ||||||||
| MIPS22432 | 5.37(0.33) | 0.540.03 | 4.25 | 1.69(0.19) | 0.080.01 | |||
| MIPS22536 | 4.09(0.58) | 0.270.04 | 7.58(0.87) | 0.340.04 | 5.42 | |||
| MIPS22549 | 3.53(0.59) | 0.380.06 | 3.00(0.79) | 0.320.08 | 2.99 | |||
| MIPS22555 | 2.38 | |||||||
| MIPS22557 | 6.40(1.58) | 1.130.28 | 7.66(1.34) | 1.240.22 | 7.04 | 6.57(1.67) | 0.080.02 | |
| MIPS22635 | 6.51(0.99) | 1.580.24 | 5.69(0.96) | 0.930.16 | 7.41(1.54) | 0.110.02 | 4.35(1.13) | 0.060.02 |
| MIPS22638 | 2.96(0.57) | 0.380.07 | 3.18(0.63) | 0.360.07 | 3.93 | 5.28(1.27) | 0.050.01 | |
| MIPS22690 | ||||||||
| MIPS22722 |
Note. — Fluxes may not be given for lines that are in the IRS wavelength range when their neighboring continuum cannot be well determined.
* Error bars of 0 correspond to EW uncertainties that are lower than the selected measurement accuracy.
References
- Adelberger et al. (2004) Adelberger, K. L., Steidel, C. C., Shapley, A. E., Hunt, M. P., Erb, D. K., Reddy, N. A., & Pettini, M. 2004, ApJ, 607, 226
- Allamandola et al. (1999) Allamandola, L. J., Hudgins, D. M., & Sandford, S. A. 1999, ApJ, 511, L115
- Alexander et al. (2008) Alexander, D. M., et al. 2008, AJ, 135, 1968
- Armus et al. (2006) Armus, L., et al. 2006, ApJ, 640, 204
- Armus et al. (2007) Armus, L, et al. 2007, ApJ, 656, 148
- Barger et al. (2008) Barger, A. J., Cowie, L. L., & Wang, W.-H. 2008, ApJ, 689, 687
- Barmby et al. (2006) Barmby, P., et al. 2006, ApJ, 642, 126
- Bertin & Arnouts (1996) Bertin, E., & Arnouts, S. 1996,A&AS, 117, 393
- Brand et al. (2008) Brand, K. et al. 2008, ApJ, 680, 119
- Brandl et al. (2006) Brandl, B. R. et al. 2006, ApJ, 653, 1129
- Cardamone et al. (2008) Cardamone, C. N., et al. 2008, ApJ, 680, 130
- Carilli et al. (2005) Carilli, C. L. et al. 2005, ApJ, 618, 586
- Chary & Elbaz (2001) Chary, R., & Elbaz, D. 2001, ApJ, 556, 562
- Chiar & Tielens (2006) Chiar, J. E. & Tielens, A. G. G. M. 2006, ApJ, 637, 774
- Conselice (2006) Conselice, C. J. 2006, ApJ, 638, 686
- Daddi et al. (2004) Daddi, E., et al. 2004 ApJ, 600, L127
- Daddi et al. (2005) Daddi, E., et al. 2005, ApJ, 631, L13
- Dale et al. (2006) Dale, D. A. et al. 2006, ApJ, 646, 161
- Dasyra et al. (2008a) Dasyra, K. M., Yan, L., Helou, G., Surace, J., Sajina, A., & Colbert, J. 2008, ApJ, 680, 232
- Dasyra et al. (2008b) Dasyra, K. M., et al. 2008, ApJ, 674, L9
- Dey et al. (2008) Dey, A. et al. 2008, ApJ, 677, 943
- Dey et al. (2009) Dey, A., et al. 2009, ASPC, in press, arXiv/0905.4531
- Desai et al. (2007) Desai, V., et al. 2007, ApJ, 669, 810
- Desai et al. (2009) Desai, V., et al. 2009, ApJ, in press, arXiv/0905.4274
- Donley et al. (2007) Donley, J. L., Rieke, G. H., P rez-Gonz lez, P. G., Rigby, J. R., & Alonso-Herrero, A. 2007, ApJ, 660, 167
- Draine & Lee (1984) Draine, B. T., & Lee, H. M. 1984, ApJ, 402, 441
- Draine & Li (2007) Draine, B. T., & Li, A. 2007, ApJ 657, 810
- Fadda et al. (2004) Fadda, D., et al. 2004, AJ, 128, 1
- Fadda et al. (2006) Fadda, D., et al. 2006, AJ, 131, 2859
- Farrah et al. (2007) Farrah, D., et al. 2007, ApJ, 667, 149
- Farrah et al. (2008) Farrah, D., et al. 2008, ApJ, 677, 957
- Farrah et al. (2009) Farrah, D., et al. 2009, ApJ, in press, arXiv/0905.1956
- Frayer et al. (2006) Frayer, D. T., et al. 2006, AJ, 131, 250
- Galliano et al. (2008) Galliano, F., Madden, S. C., Tielens, A. G. G. M., Peeters, E., & Jones, A. P. 2008, ApJ, 679, 310
- Genzel et al. (1998) Genzel, R., et al. 1998, ApJ, 498, 579
- Georgantopoulos et al. (2007) Georgantopoulos, I., Georgakakis, A., & Akylas, A. 2007, A&A, 466, 823
- Gorjian et al. (2008) Gorjian, V. et al. 2008, ApJ, 679, 1040
- Hammer et al. (2005) Hammer, F., Flores, H., Elbaz, D., Zheng, X. Z., Liang, Y. C., & Cesarsky, C. 2005, A&A, 430, 115
- Hernán-Caballero et al. (2009) Hernán-Caballero, A. et al. 2009, MNRAS, in press, arXiv/0902.3369
- Higdon et al. (2006) Higdon, S. J. U., Armus, L., Higdon, J. L., Soifer, B. T., & Spoon, H. W. W. 2006, ApJ, 648, 323
- Higdon et. al. (2008) Higdon, J. L., Higdon, S. J. U., Willner, S. P., Brown, M. J. I., Stern, D., Le Floc’h, E., & Eisenhardt, P. 2008, ApJ, 688, 885
- Houck et al. (2005) Houck, J. R., et al. 2005, ApJ, 622, L105
- Huang et al. (2009) Huang, J.-S., et al. 2009, ApJ, in press, arXiv/0904.4479
- Imanishi (2002) Imanishi, M. 2002, ApJ, 569, 44
- Imanishi et al. (2006) Imanishi, M., Dudley, C. C., & Maloney, P. R. 2006, ApJ, 637, 114
- Imanishi et al. (2008) Imanishi, M., Nakagawa, T., Ohyama, Y., Shirahata, M., Wada, T., Onaka, T., & Oi, N. 2008, PASJ, 60, 489
- Kartaltepe et al. (2007) Kartaltepe, J. S., et al. 2007, ApJS, 172, 320
- Komossa et al. (2003) Komossa, S., Burwitz, V., Hasinger, G., Predehl, P., Kaastra, J. S., & Ikebe, Y. 2003, ApJ, 582, L15
- Lacy et al. (2004) Lacy, M., et al. 2004 ApJS, 154, 166
- Lacy et al. (2005) Lacy, M., et al. 2005 ApJS, 161, 41
- Lacy et al. (2007) Lacy, M., Petric, A. O., Sajina, A., Canalizo, G., Storrie-Lombardi, L. J., Armus, L., Fadda, D., & Marleau, F. R. 2007, AJ, 133, 186
- Le Floc’h et al. (2005) Le Floc’h, E., et al. 2005, ApJ, 632, 169
- Martínez-Sansigre et al. (2008) Mart nez-Sansigre, A., Lacy, M., Sajina, A., & Rawlings, S. 2008, ApJ, 674, 676
- Melbourne et al. (2009) Melbourne, J., et al. 2009, AJ, in press, arXiv/0904.1231
- Menéndez-Delmestre et al. (2007) Menéndez-Delmestre, K., et al. 2007, ApJ, 655, L65
- Menéndez-Delmestre et al. (2009) Menéndez-Delmestre, K., et al. 2009, ApJ, in press, arXiv/0903.4017
- Papovich et al. (2004) Papovich, C., et al. 2004, ApJS, 154, 70
- Papovich et al. (2006) Papovich, C., et al. 2006, ApJS, 640, 92
- Peeters et al. (2004) Peeters, E., Spoon, H. W. W., & Tielens, A. G. G. M. 2004, ApJ, 613, 986
- Peng et al. (2002) Peng, C. Y., Ho, L. C., Impey, C. D., & Rix, H.-W. 2002, AJ, 124, 266
- Pérez-González et al. (2005) Pérez-González, P. G., et al. 2005, ApJ, 630, 82
- Poletta et al. (2006) Polletta, M. et al. 2006, ApJ, 642, 673
- Poletta et al. (2007) Polletta, M. et al. 2007, ApJ, 663, 81
- Pope et al. (2008) Pope, A., et al. 2008, ApJ, 675, 1171
- Rigby et al. (2004) Rigby, J. R., et al. 2004, ApJS, 154, 160
- Rigopoulou et al. (1999) Rigopoulou, D., Spoon, H. W. W., Genzel, R., Lutz, D., Moorwood, A. F. M., & Tran, Q. D. 1999, AJ, 118, 2625
- Rigopoulou et al. (2002) Rigopoulou, D., Kunze, D., Lutz, D., Genzel, R., & Moorwood, A. F. M. 2002, A&A, 389, 374
- Risaliti et al. (2006) Risaliti, G. et al. 2006, MNRAS, 365, 303
- Sajina et al. (2007) Sajina, A., Yan, L., Armus, L., Choi, P., Fadda, D., Helou, G., & Spoon, H. 2007, ApJ, 664, 713
- Sajina et al. (2008) Sajina, A., et al. 2008, ApJ, 683, 659
- Sanders et al. (1988) Sanders, D. B., Soifer, B. T., Elias, J. H., Madore, B. F., & Matthews, K. 1988, ApJ, 328, L35
- Solomon & Van den Bout (2005) Solomon, P. M., & Vanden Bout, P. A. 2005, ARA&A, 43, 677
- Smith et al. (2007) Smith, J. D. T., et al. 2007, ApJ, 656, 770
- Steidel et al. (2004) Steidel, C. C., Shapley, A. E., Pettini, M., Adelberger, K. L., Erb, D. K., Reddy, Naveen A., & Hunt, Matthew P. 2004, ApJ, 604, 534
- Stern et al. (2005) Stern, D., et al. 2005, ApJ, 631, 163
- Sturm et al. (2000) Sturm, E., Lutz, D., Tran, D., Feuchtgruber, H., Genzel, R., Kunze, D., Moorwood, A. F. M., & Thornley, M. D. 2000, A&A, 358, 481
- Sturm et al. (2002) Sturm, E., Lutz, D., Verma, A., Netzer, H., Sternberg, A., Moorwood, A. F. M., Oliva, E., & Genzel, R. 2002, A&A, 393, 821
- Surace et al. (2005) Surace, J., et al. 2005, ”The SWIRE data release 2: Image atlases and source catalogs for ELAIS-N1, ELAIS-N2, XMM-LSS, and the Lockman Hole”
- Swinbank et al. (2006) Swinbank, A. M., Chapman, S. C., Smail, I., Lindner, C., Borys, C., Blain, A. W., Ivison, R. J., & Lewis, G. F. 2006, MNRAS, 371, 465
- Tacconi et al. (2006) Tacconi, L. J., et al. (2006) 2006, ApJ, 640, 228
- Valiante et al. (2007) Valiante, E., Lutz, D., Sturm, E., Genzel, R., Tacconi, L. J., Lehnert, M. D., & Baker, A. J. 2007, ApJ., 660, 1060
- Veilleux et al. (2006) Veilleux, S., et al. 2006, ApJ, 643, 707
- Verma et al. (2003) Verma, A., Lutz, D., Sturm, E., Sternberg, A., Genzel, R., & Vacca, W. 2003, A&A, 403, 829
- Weedman et al. (2006) Weedman, D. W., Le Floc’h, E., Higdon, S. J. U., Higdon, J. L., & Houck, J. R. 2006, ApJ, 638, 613
- Weedman & Houck (2008) Weedman, D. W. & Houck, J. R. 2008, ApJ, 686, 127
- Yan et al. (2004a) Yan, H., et al. 2004, ApJ, 616, 63
- Yan et al. (2004b) Yan, L., et al. 2004, ApJS, 154, 75
- Yan et al. (2005) Yan, L., et al. 2005, ApJ, 628, 604
- Yan et al. (2007) Yan, L., et al. 2007, ApJ, 658, 778
- Yun et al. (2008) Yun, M. S., et al. 2008, MNRAS, 389, 333
- Zheng et al. (2004) Zheng, X. Z., Hammer, F., Flores, H., Assémat, F., & Pelat, D. 2004, A&A, 421, 847