Accretion flow behaviour during the evolution of the Quasi Periodic Oscillation Frequency of XTE J1550-564 in 1998 outburst
Abstract
Low and Intermediate Frequency Quasi-Periodic Oscillations (QPOs) are thought to be due to oscillations of Comptonizing regions or hot regions embedded in Keplerian discs. Observational evidence of evolutions of QPOs would therefore be very important as they throw lights on the dynamics of the hotter region. Our aim is to find systems in which there is a well defined correlation among the frequencies of the Quasi Periodic Oscillations over a range of time so as to understand the physical picture. In this paper, we concentrate on the archival data of XTE J1550-564 obtained during 1998 outburst, and study the systematic drifts during the rising phase from the of September 1998 to the September 1998, when the QPO frequency increased monotonically from mHz to Hz. Immediately after that QPO frequency started to decrease and on the of September 1998, the QPO frequency became Hz. After that its value remained almost constant. This frequency drift can be modeled satisfactorily with a propagatory oscillating shock solution where the post-shock region behaves as the Comptonized region. Comparing with the nature of a more recent 2005 outburst of another black hole candidate GRO 1655-40, where QPOs disappeared at the end of the rising phase, we conjecture that this so-called ’outburst’ may not be a full-fledged outburst.
keywords:
accretion, accretion disc - shock waves - stars: individual (XTE J1550-564).1 Introduction
The Galactic soft X-ray transient (SXT) and a black hole candidate XTE J1550-564 is thought to be powered through the accretion process from a low mass companion star. The diversity of the exhibited outburst features depends on the evolutionary status and the possible irradiative heating of the companion star (See, e.g., Tanaka & Lewin 1995 for a review). XTE J1550-564 was first discovered by the all-sky monitor (ASM) on board the Rossi X-Ray Timing Explorer (RXTE) on 1998 September 7 (MJD 51063) (Smith, 1998) and by the Burst and Transient Source Experiment (BATSE) on board Compton Gamma Ray Observatory (CGRO; Wilson et al. 1998). The Optical (Orosz, Bailyn & Jain 1998) and radio (Campbell-Wilson et al. 1998) counterparts were detected shortly afterward. The optical photometry during this outburst revealed a binary period of days (Jain et al. 2001). During the September 1998 outburst, a superluminal jet was found to be associated with a massive X-ray flare (Hannikainen et al. 2001). Recent observation established that the black hole in XTE J1550-564 has a mass of (Orosz et al. 2002) and the companion star is a late-type sub-giant (). The binary inclination angle is (Orosz et al. 2002).
In this paper, we revisited the decade old ‘outburst’ especially focusing on the timing properties and try to interpret the results in the light of the current understanding of the accretion flow dynamics around a black hole. We thoroughly analize the data of the first three weeks of the very initial stage of the outburst which includes a rising phase and the preliminary declining phase. We clearly observe a very smooth day to day variation of the QPO frequency in these phases. However, unlike the 2005 outburst of GRO J1655-40 (Chakrabarti et al. 2005; Chakrabarti et al. 2008, hereafter referred to as CDNP08) where the QPO frequency is seen to steeply rise and disappear at the end of the onset phase and to go down monotonically after several months in the decline phase, QPOs never really disappeared between the rising phase and the declining phase in the present case. Indeed, there is a continuity in QPO frequency in the rising and decline phases. This is very interesting and should throw lights on any model which attempts to explain the evolution of QPOs. We discuss the possible reason for displaying such a behaviour.
In the literature, a considerable progress has been made in the analysis and interpretation of the spectral and timing properties of XTE J1550-564 during its last several outbursts. Soria et al. (2001) and Wu et al. (2002) showed that while the hard X-ray flux from BATSE 20-200keV observation of the 1998 burst reached its maximum after one day, and started to decline in the next 3-4 days, the soft X-ray flux from RXTE/ASM (2-12keV) continued to rise monotonically for 10 days or so. Subsequently, both the hard and the soft X-rays flared after 12 days of the initial hard X-ray spike. They also reported a radio flare after day of this flare. This interesting behaviour lead to the conclusion that both the low and the high angular momentum flows could be present simultaneously as in Chakrabarti & Titarchuk (1995). Sobczak et al. (2000a) presented a complete spectral study of XTE J1550-564 where they presented results of 209 observations spanning 250 days. The whole eruption was found to be double peaked, and while the first half was dominated by a power-law emission, the second half was dominated by the emission from an accretion disc. Sobczak et al. (2000b) compared the nature of the 1998 outburst of XTE J1550-564 with the 1996 outburst of GRO J1655-40 and discussed the similarities and differences. They find that both exhibited a general increase in QPO frequency with the disc flux. QPOs are found to be present only when the power-law component contributes more than 20 percent of the 2-20keV flux, thus agreeing with the general perception that only the Comptonized photons take part in QPOs (Chakrabarti & Manickam, 2000; hereafter CM00; Rao et al. 2000). Reilly et al. (2001), using the result from Unconventional Stellar Aspect (USA) Experiment on board the Advanced Research and Global Observation Satellite (ARGOS), showed that the centroid frequency of low frequency QPOs during the 2000 outburst of XTE J1550-564 tends to rise with increasing USA flux in 1-16keV. They study the correlations of the hard and soft fluxes and concluded that the observations could be explained only if the flow has two independent components, one Keplerian and the other sub-Keplerian. However, none of these papers addressed the issue of the evolution of the QPO frequency from the perspective of theoretical understanding.
Although the generic flaring in X-rays are often called the ’outbursts’, it possible that all the outbursts need not involve waves of matter rushing into the black hole in the identical way. In CDNP08 it was shown that in GRO J1655-40, towards the end of the rising phase of the outburst, the QPO frequency rapidly rose and disappeared altogether. It appeared that an oscillating shock wave, which caused QPOs, drifted slowly through the incoming flow and eventually disappeared behind the horizon. After several months, in the decline phase of the outburst, the oscillatory shock formed close to the black hole propagated outward till the rms value of QPO was too weak to be detected. If we follow a similar analysis as in CDNP08, we note that in the present case, the shock never reached close to the horizon before turning back. This gives rise to our conjecture that possibly a full-fledged outburst did not take place in this object in 1998.
The plan of the paper is the following: In the next section we discuss a possible cause of low and intermediate frequency QPOs in accretion discs around compact objects, namely, oscillations of shock waves. In §3, we present the observational results on XTE J1550-564 in detail and show our model fit of the QPO frequencies from day to day. From this, we extract the shock parameters. In §4, we discuss the implications of the present analysis. Finally in §5, we make concluding remarks.
2 Low and Intermediate frequency QPOs
A brief description of the physical processes in Low Frequency QPOs (LFQPOs) is in CDNP08 and we discuss them here only for the sake of completeness. A satisfactory model of LFQPOs claims that the X-ray oscillation could be due to the oscillation of the Comptonizing region which is the region between the centrifugal pressure supported shock and the innermost sonic point (Chakrabarti, Acharyya & Molteni, 2004; hereafter CAM04, and references therein). Perturbations inside a Keplerian disc has also variously been conjectured to be the cause of low-frequency QPOs (e.g., Trudolyubov, Churazov & Gilfanov, 1999; see, Swank 2001 for a review). To our knowledge, no numerical simulations have shown that hot perturbing blobs embedded in Keplerian discs can sustain itself beyond a few dynamical time scale. However, several numerical simulations of accretion flows including the thermal cooling effects (Molteni, Sponholz & Chakrabarti, 1996 [hereafter MSC96], CAM04; Okuda et al. 2007) or dynamical cooling (through outflows, e.g., Ryu, Chakrabarti & Molteni, 1997) clearly demonstrated that the shocks oscillated with frequencies similar to the observed QPO frequencies. The post-shock region does behave as a Comptonizing cloud for all practical purposes (Chakrabarti & Titarchuk, 1995). The shock moves inward with the increase of the cooling rate (MSC96) and it can propagate when the viscosity is turned on (Chakrabarti & Molteni, 1995). Using these physical results, we have recently explained the way the QPO frequency evolved in the 2005 X-ray outburst of GRO J1655-40 (Chakrabarti et al. 2008) quite satisfactorily.
It is to be noted that the shocks are quite common in low-angular momentum (sub-Keplerian) flows and they have been extensively studied in the literature (Chakrabarti, 1989; Nobuta & Hanawa, 1994; Yang & Kafatos 1994, Lu et al. 1997). There are increasing observational evidences both from spectral and timing observations that an accretion process must have a significant amount of low angular flow along with the Keplerian flow (Smith et al. 2001, 2002, 2007; Soria et al. 2001; Wu et al. 2002; Reilly et al. 2001). It is thus expected that the other consequences of a low angular flow, namely, the shock waves would also be manifested and their signatures would also be observed. Thus the past successful explanations of QPO properties with shock oscillation (CM00; Rao et al. 2000; CAM04) are not far fetched. Indeed, in the case of 1998 outburst of XTE J1550-564, Wu et al. (2002) invoked shocks in the low-angular flow to explain the observations while Reilly et al. (2001) found the shock oscillations to be most ’natural’ to explain the QPOs for the 2000 outburst. In the shock oscillation model, the QPO frequency is the inverse of the infall time , where, is the shock strength (ratio of the post-shock to pre-shock densities), is the shock location in units of the Schwarzschild radius , and is the radial velocity of the flow in the post-shock region in units of the velocity of light (MSC96; CM00; CDNP08). Of course, to trigger the oscillations, the accretion rate should be such that the cooling time scale roughly match the infall time scale from the post-shock region (MSC96). Thus, the instantaneous QPO frequency (in ) is expected to be,
Here, is the inverse of the light crossing time of the black hole of mass in and is the velocity of light. In a drifting shock scenario, is the time-dependent shock location given by,
Here, is the shock location when is zero and is the shock velocity in c.g.s. units. The positive sign in the second term is to be used for an outgoing shock and the negative sign is to be used for the in-falling shock.
The shock strength need not be fixed as it moves towards the black hole. This is because general relativistic properties of the horizon will not allow a density gradient on the horizon. Thus at the most the shock would have a strength on the horizon. In case the strength is reduced to somewhere inside the disc (which means a sub-sonic to super-sonic transition, which is unstable), the shock would rather propagate outward to increase it again. We show below that this is perhaps what is happening in this object.
3 Observation and Data Analysis
In this paper, we concentrate on the data of 27 Observational IDs (corresponding to a total of 20 days) of XTE J1550-564 due to RXTE Proportional Counter Array (PCA; Jahoda et al., 1996). We extracted the light curves (LC), the power density spectra (PDS), the energy spectra and the photon counts for different energy channels from the best calibrated PCA detector unit, namely, PCU2. We used FTOOLS software package version 6.1.1 and XSPEC version 12.3.0. For the timing analysis (LC and PDS) we used Science Data of the Normal Mode.

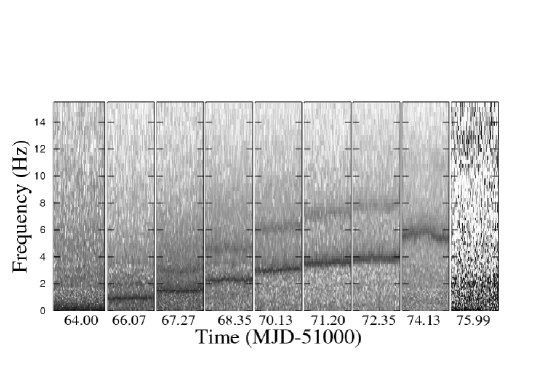
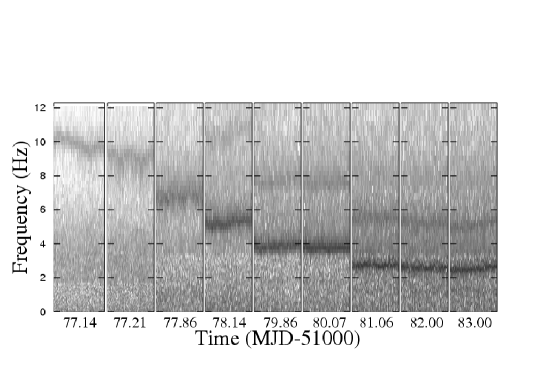
Figure 1 shows the systematic variation of the power density spectrum covering the first three weeks of the outburst. QPO frequencies obtained after fitting a Lorentzian are indicated inside each box. The arrows indicate the direction of increasing time. We clearly observe that after reaching the highest value of Hz, the qpo frequency started decreasing. Surprisingly, the power itself was very low on this day (see, Fig. 1). In Figs. 2(a-b), the dynamic power density spectrum for observations (a) in the rising phase and (b) in the declining phase are shown in the gray scale. At the bottom of the panels the start time of each panel is shown after subtracting the MJD values. To show better contrast, the square of log (Power) has been plotted with the gray scale range from 0-20 in all the days of the rising phase and decline phase except for the day 75.99 (MJD=51075.99) where gray scale range is 30-40.
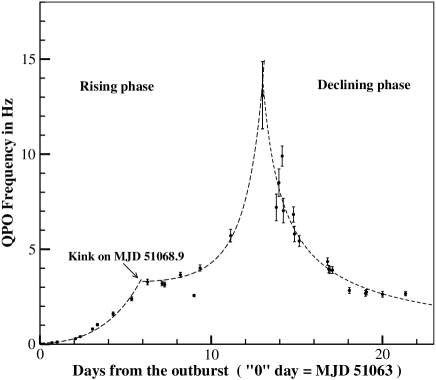
In Fig. 3, we show the variation of the QPO frequencies as a function of number of days passed after the first detection on MJD 51063 which is chosen to be the zeroth day. The full widths at half maxima of the fitted QPOs have been used as the error bars. In the rising phase, day starts on MJD=51063. As presented in CDNP08, we assume that in the rising phase, the variation of QPOs are due to slow drifting of the oscillating shocks towards the black hole. In the decline phase, the oscillating shock propagates outwards. The dashed curve represents our fit with Eqs. (1-2). There appears to be a kink on MJD=51068.9. The value of reduced for the fit in the rising phase is up to the kink and thereafter. The fit requires that a strong shock () is to be launched at which drifts slowly at cm s-1 towards the black hole. At the time of the flare on MJD=51075.99 ( d), the oscillation frequency was detected at Hz. At this point, our fit showed that the shock was located at . The shock is assumed to be time dependent and becomes weaker as it propagates towards the black hole. This is expected since at the inner boundary, i.e., the horizon, a density or velocity jump cannot be sustained and as . For simplicity, we assume , where is a very small number limited by the time in which the shock disappears ( days): . Thus in all, we have three free parameters, namely, the initial shock location and velocity and . In our fit, up to the day when the kink was observed and after that shock behaviour changed and had to be used.
The declining phase started almost immediately (within a day) after the rising phase ended on MJD=51075.99. This behaviour corresponds to the drifting of shocks in the reverse direction. This is unlike the outburst in GRO J1655-40 (CDNP08) where, the QPO disappears completely in the rising phase and the decline phase started only after several months. The shock was found to drift with time till MJD=51083.00 when Hz. It evolves as and since (Eq. 1), . Thus the shock steadily recedes away from the black hole with almost constant velocity (). The value of Reduced for this fit (with three degrees of freedom) is and thus the fit is satisfactory. After that the oscillation frequency varied between -Hz for about days till MJD=51109.74 (see also, Sobczak et al. 2000a). This shows that The shock started stalling exactly as in GRO J1655-40 (CDNP08). We believe that this behaviour is due to the interaction of the receding shocks with incoming Keplerian flow, which continued to accrete due to longer viscous timescale. Beyond MJD 51,109.7 the Keplerian disc is drained in a time scale of days (Wu et al. 2002) while the propagating shock in the sub-Keplerian flow, could be too weak to have any observational effect. Thus no regular QPO was seen in this phase. This is in contrast with GRO 1655-40, where the shock receded at a constant acceleration towards the very end of the decline phase.

In Fig. 4, we plot the variation of QPO frequency (upper panel), the fluxes of the hard, the intermediate and the soft X-rays (middle panel) and the power-law photon index (lower panel). Since the shock oscillation causes QPOs in this model, both the pre-shock flow responsible for very soft photons and the post-shock flows responsible for the Compotonized photons, become hotter and luminous as the shock approaches the black hole. The evolution of the photon spectral index shows that generally the spectrum became softer as the rising phase proceeded and became harder only marginally in the declining phase. In fact, the spectral index changed very little during the final twenty days (see, Fig. 4). The photon count is neither low (as in the beginning) nor high (as in the flare) and the index is marginally soft. Thus the system is in an intermediate state.

The physical picture during these initial days of the 1998 episode becomes clearer when we analize both the timing and the spectral properties. We plot the results for a few selected days in Fig. 5 (panels i to v). The left panels show the power density spectra and the right panels show the energy spectra. The Observation IDs (marked in each panel) in the rising phase are 30188-06-01-00 ( day), 30188-06-07-00 ( day) and 30191-01-02-00 ( day) and in the decline phase are 30191-01-08-00 ( day) and 30191-01-10-00 ( day) respectively. In the rising phase, the spectrum becomes softer as the shock moves in and the QPO frequency rises. The softening of the spectrum with the increase in the QPO frequency has been reported before (e.g., Chakrabarti et al. 2005; ST06; Shaposhnikov et al., 2007; CDNP08). MSC96 and CAM04 explicitly showed that an increase in the cooling rate reduces the shock location and thus increases the QPO frequency. We observe that the black body (BB) and the Gaussian (Ga) component from the Keplerian disc are strengthened by factor of ten in between the panel (i) and panel (iii). A similar behaviour was also seen by ST06 using the data of Cyg X-1. A kink on day in the rising phase is peculiar in the sense that the rising trend of the power-law photon index is decreased abruptly (lower panel of Fig. 4) and the rising trend of QPO frequency (Fig. 3) also changed abruptly. It is possible that there are multiple shock waves in the flow, both in the rising phase and in the decline phase.
4 Discussions
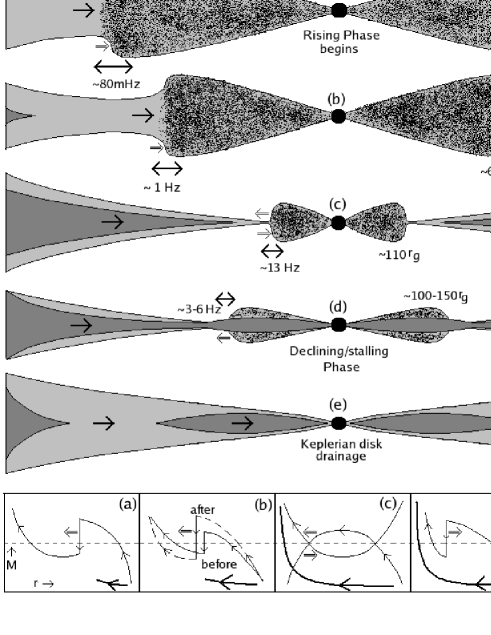
Analysis of the 1998 outburst gives a clearer physical picture of what is happening in XTE J1550-564. Fig. 6 shows the plausible accretion scenario in different phases (a-e) of the outburst. The lowest panel shows the corresponding cartoon diagrams of the Mach number (M) vs. radial distance (r) of the Keplerian (thick curve) and the sub-Keplerian (thin curve) flow (Chakrabarti, 1989). In panel (a), at the beginning of the rising phase, the flow is dominated by a sub-Keplerian flow with a shock at around . The shock propagates inward with a constant velocity and at the same time, the Keplerian disc moves in viscous time scale. As a result the spectrum becomes softer and the QPO frequency also rises [panel (b)]. The shock strength decreases and becomes at around when the QPO frequency was around Hz. At this stage ( days after the outburst began) either the same shock strengthened or a new wave of sub-Keplerian matter moved in and the QPO behaviour was changed distinctly (Fig. 3). Subsequently [panel (c)], the shock becomes weaker and stopped while a reverse shock formed and propagated outward to initiate the declining phase. The blackbody component is strongest in this case. The reverse shock propagated outward at almost constant velocity as QPO frequency also started to decrease [panel (d)]. The supply of Keplerian flow also ceased and the flow broke into two parts, the inner part is moving in while the other part stayed back. The segment moving in is eventually drained in viscous timescale ( days; Wu et al. 2002) [panel (e)].
5 Concluding remarks
In this paper, we studied the evolution of the QPO frequencies in the 1998 outburst of the black hole candidate XTE J1550-564. During the rising phase, the QPO frequency increases very slowly first few days and then very rapidly. The spectrum also became softer very closely following the QPO behaviour. Immediately after reaching a frequency of Hz, the decline phase started which is characterized by softening of the spectrum. The QPO frequency started to decrease also immediately. The spectral and temporal analysis suggest that the smooth variation of the QPO frequency is due to the movement of the Comptonizing region itself. A satisfactory model of the low frequency QPOs which claims that the oscillation of the shock wave is responsible for QPOs can also explain the daily variation provided the shock propagates towards the black hole at a velocity of about m/s. There was a kink in the frequency variation in the rising phase, indicating a possibility of sudden strengthening of the same shock wave or the presence of another incoming shock.
A comparison of the 2005 outburst in another transient source GRO J1655-40 (CDNP08) suggests a number of similarities and dissimilarities. For instance, a similar shock velocity was also necessary there to explain the QPO frequency variation. In both the objects the spectrum was marginally soft, i.e., the photon index is just above after the decline phases. This phase appears turbulent, with sporadic QPOs, as though the outward movement of the shockwave is confronting the still incoming Keplerian flow which moves in with a much longer viscous timescale. However, there are several major differences: (a) the nature of the rising phase differs qualitatively. In GRO J1655-40, the shock wave moved closer to the black hole and ultimately disappeared behind the horizon. In the present case, the best fit curve required that shock strength to go down to less than unity much before reaching the horizon. Thus the shock wave never reaches the horizon. This could be either because of a reverse shock in the sub-Keplerian flow which overpowered this incoming wave or the shock started to propagate in the reverse direction due to pressure imbalance. The outward propagating shock in GRO 1655-40 started only after several month, indicating that matter supply was prolonged while in the present situation, the supply was erratic causing the receding shock to form immediately after the flare. In GRO J1655-40, the shock was stalling in the decline phase only for days, while in the present case, the shock was receding with almost constant velocity () in the first week and then stalled for the next four weeks. After that QPO also disappeared.
In majority of the black hole candidates, existence of two component flows has been proven beyond any reasonable doubt. Even in this object, workers have always invoked two components to explain the spectral variations. The sub-Keplerian flow is found to be responsible for supplying hot electrons, which produce the power-law component through inverse Compton process. However a major consequence of a sub-Keplerian flow, namely to produce an oscillating shock was overlooked. This oscillation is due to the tug-of-war between the cooling process which tends to collapse the shock and centrifugal barrier which tends to push the shock outward (MSC06). In this paper, we show that the oscillating shock is probably responsible for QPOs which can propagate forward or backward depending on the extent to which the Rankine-Hugoniot condition is broken at the shock. In the rising phase, the excess cooling in the post-shock flow (which is the CENtrifugal pressure dominated BOundary Layer or CENBOL) causes a steady drift of the shock towards the black hole, while in the decline phase the recession of the Keplerian disc causes the reduction of pressure in the pre-shock flow and the shock can propagate outward. What is important is that we now have a consistent picture of how low and intermediate frequency QPOs are generated and are evolved in accretion flows around black hole candidates during the outburst. To our knowledge there is no competing model of low and intermediate frequency QPOs which explain the frequencies as well their variation with decent reduced of our fits. On the other hand, we are puzzled as to why in more than one black hole candidates, the propagation speed of the shock is m/s.
B.G. Dutta acknowledges the support of ”Teacher Fellowship” award under the Faculty Improvement Programme (F.I.P) scheme of U.G.C. and S.K.C. and P.S. Pal acknowledges the support of ISRO RESPOND project. We thank Dr. A.Nandi for helpful discussions on the data analysis.
References
- (1) Campbell-Wilson, D., McIntyre, V.,Hunstead, R. W.,& Green, A. 1998, IAU Circ., 7010,3
- (2) Chakrabarti, S.K., 1989, ApJ, 347, 365
- (3) Chakrabarti, S.K., Acharyya, K. & Molteni, D., 2004, A&A, 421, 1 (CAM04)
- (4) Chakrabarti, S.K. & Manickam, S.G., 2000, ApJ, 531, L41 (CM00)
- (5) Chakrabarti, S.K. & Molteni, D., 1995, MNRAS, 272, 80
- (6) Chakrabarti, S.K., Nandi, A., Debnath, D. Sarkar, R. & Datta, B.G., 2005, Ind. J. Phys., 78B, 1
- (7) Chakrabarti, S.K., Debnath, D., Nandi, A., Pal, P.S., 2008, A&A, 489L, 41 (CDNP08)
- (8) Chakrabarti, S.K. & Titarchuk, L.G., 1995, ApJ, 455, 623
- (9) Hannikainen, D. et al. 2001, ESA SP-459, Noordwijk (ESA) 291
- (10) Jahoda K., Swank J. H., Giles A. B., Stark M. J., Strohmayer T., Zhang W., Morgan E. H., 1996, in EUV, X-Ray, and Gamma-Ray Instrumentation for Astronomy VII, (Eds.) O. H. Siegmund and M. A. Gummin, Proc. SPIE Vol. 2808, 59
- (11) Jain R. K., Bailyn C. D., Orosz J. A., McClintock J. E., Sobczak G. J., Remillard R. A., 2001, ApJ, 546, 1086
- (12) Lu, J.-F., Yu, K.N., Yuan, F. & Young, E.C.M., 1997, A&A, 321, 665
- (13) Molteni, D., Sponholz, H. & Chakrabarti, S.K., 1996, ApJ, 457, 805 (MSC96)
- (14) Nobuta, K. & Hanawa, T., 1994, PASJ, 46, 257
- (15) Okuda, T., Teresi, V. & Molteni, D., 2007, MNRAS, 377, 1431
- (16) Orosz, J.A., & Bailyn, C.D., Jain, R.K 1998, IAU Circ., 7009, 1
- (17) Orosz, J. A., et al. 2002 ApJ, 568, 845
- (18) Rao, A.R., Naik, S., Vadawale, S.V. & Chakrabarti, S.K., 2000, ApJ, 360, 25
- (19) Reilly et al. 2001, ApJ 561, L183
- (20) Ryu, D., Chakrabarti, S.K. & Molteni, D., 1997, ApJ, 474, 378
- (21) Shaposhnikov, N., Swank, J., Shrader, C. R., Rupen, M., Beckmann, V., Markwardt, C. B., Smith, D. A.,2007, ApJ, 655, 434
- (22) Shaposhnikov, N. & Titarchuk, L. G., ApJ, 2006, 643, 1098 (ST06)
- (23) Smith, D., Heindl, W.A. & Swank, J.H., 2002, ApJ, 569, 362
- (24) Smith, D.M., Heindl, W.A., Markwardt, C.B. & Swank, J.H., 2001, ApJ, 554, L41
- (25) Smith, D.M., Dawson, D.M. & Swank, J.H., 2007, ApJ, 669, 1138
- (26) Smith, D.M. 1998, IAU Circ., 7008, 1
- (27) Sobczak, G. J., McClintock J. E., Remillard R. A., Cui W., Levine A. M., Morgan E. H., Orosz J. A., Bailyn C. D., 2000a, ApJ, 531, 537
- (28) Sobczak G. J., McClintock J. E., Remillard R. A., Cui W., Levine A. M., Morgan E. H., Orosz J. A., Bailyn C. D., 2000b, ApJ, 544, 993
- (29) Soria, R., Wu, K., Hannikainen, D., McMollough M., Hunstead, R. 2001, In X-ray Emission from Accretion onto Black Holes, (Eds.) T. Yaqoob and J. H. Krolik, p. 65
- (30) Swank, J.H., 2001, ApSS, 276, 201
- (31) Tanaka, Y. and Lewin, W.H.G., 1985, in X-ray Binaries, (Eds.) W.H.G. Lewin, J. van Paradijs and E.P.J. van den Heuvel, Cambridge Univ. Press, Cambridge, 0.126
- (32) Trudolyubov, S., Churazov, E., Gilfanov, M, 1999, A&A, 351, L15
- (33) Wilson, C.A., Harmon, B.A., Paciesas, W.S., & McCollough, M.L. 1998, IAU Circ., 7010,2
- (34) Wu, K. et al., 2002, ApJ, 565, 1161