On the robustness of the ammonia thermometer
Abstract
Ammonia inversion lines are often used as probes of the physical conditions in the dense ISM. The excitation temperature between the first two para metastable (rotational) levels is an excellent probe of the gas kinetic temperature. However, the calibration of this ammonia thermometer depends on the accuracy of the collisional rates with H2. Here we present new collisional rates for ortho-NH3 and para-NH3 colliding with para-H2 () and we investigate the effects of these new rates on the excitation of ammonia. Scattering calculations employ a new, high accuracy, potential energy surface computed at the coupled-cluster CCSD(T) level with a basis set extrapolation procedure. Rates are obtained for all transitions involving ammonia levels with and for kinetic temperatures in the range 5100 K. We find that the calibration curve of the ammonia thermometer – which relates the observed excitation temperature between the first two para metastable levels to the gas kinetic temperature – does not change significantly when these new rates are used. Thus, the calibration of ammonia thermometer appears to be robust. Effects of the new rates on the excitation temperature of inversion and rotation-inversion transitions are also found to be small.
keywords:
molecular data — molecular processes — ISM: molecules1 Introduction
Since its discovery in the interstellar medium forty years ago by Cheung et al. (1969), ammonia has been widely used as a probe of the physical conditions in a variety of interstellar environments, ranging from pre-stellar cores, molecular clouds, to external galaxies (see Ho & Townes, 1983, for a review). The peculiar structure of the molecule makes ammonia lines excellent tracers of the density and temperature in these environments. NH3 is a symmetric top molecule, whose rotational levels can be denoted by two quantum numbers, the total angular momentum , and its projection along the molecular axis. Owing to the possible relative orientations of the hydrogen spins, two distinct species exists: ortho-NH3 (, with an integer; hereafter o-NH3) and para-NH3 (; hereafter p-NH3). As both radiative and non-reactive collisional transitions do not change the spin orientations, transitions between o-NH3 and p-NH3 are forbidden. Each of the rotational energy levels (with the exception of those with ) is further split into two sub-levels which can be denoted either by the inversion symmetry of the vibrational wave functions or by the symmetry index (see Fig. 1 and Eq. 29 in Rist et al., 1993)111In this paper, we denote each level by its symmetry index , with a sign for and a sign for . We refer the reader to the Fig. 1 of Rist et al. (1993) for an energy diagram of the molecule.. This splitting is caused by the inversion motion of the molecule, and the corresponding inversion transitions fall in the range cm. Electric dipole transitions rules () prevent radiative transitions between different ladders to occur. Consequently, the lowest inversion doublets in each ladder (i.e. with ) are metastable; they can be relaxed only through collisions.
For this reason, the relative population of the first two metastable inversion doublets of p-NH3, and , depends solely on the kinetic temperature. Considering only the first three doublets, , and , and assuming that the population of the doublet is much smaller than that of the , Walmsley & Ungerechts (1983) showed that the excitation temperature between the two lowest doublets is given by the analytic formula:
| (1) |
where is the energy difference between the first two metastable doublets ( K), is the kinetic temperature, is the collisional excitation rate (averaged over the symmetry index ) between the and rotational levels, and is the collisional de-excitation rate between the and levels. Thus, if one knows the excitation temperature, one can derive the kinetic temperature of the gas, effectively using ammonia inversion lines as a “thermometer”.
Observationally, can be determined by observing the hyperfine components of the and inversion transitions. The inversion doublets have indeed hyperfine components, which are due to the interaction between the electric quadrupole moment of the N nucleus and the electric field gradient created by the electrons. If one assumes that the excitation temperature of each hyperfine components (within a given rotational state) is the same, then one can derive the opacity and of the and multiplets from the relative intensity of each hyperfine component (Barrett et al., 1977). is then calculated from the following formulae (Ho et al., 1979; Hotzel et al., 2002):
| (2) |
In order to “calibrate” the ammonia thermometer, i.e. to compute the kinetic temperature from the measured excitation temperature, a good knowledge of the collisional rates of NH3 colliding with H2 is necessary (see Eq. 1). Although a large number of measurements have been made on the NHH2 system, using in particular double resonance (e.g. Daly & Oka, 1970), crossed beam (e.g. Schleipen et al., 1993) and pressure broadening (e.g. Willey et al., 2002) experiments, laboratory data generally do not directly provide state-to-state rate coefficients. As a result, radiative transfer models can exclusively rely on theoretical estimates. On the other hand, laboratory measurements are crucial to establish the predictive abilities of theory and, in particular, of the potential energy surfaces (PES).
Following the pioneering work of Morris et al. (1973), Walmsley & Ungerechts (1983) performed statistical equilibrium calculations based on the theoretical NHHe collisional rates of Green (1980). Danby et al. (1988) then determined more accurate collisional rates for collisions of NH3 with p-H2() and used them to recalibrate the ammonia thermometer. The scattering calculations of Danby et al. (1988) were based on the ab initio NHH2 PES of Danby et al. (1986). This latter was subsequently improved to investigate propensity rules at selected collisional energies for ammonia colliding with both p- and o-H2 (Offer & Flower, 1990; Rist et al., 1993). More recently, high accuracy ab initio calculations have been performed by Mladenović et al. (2008) to explore the topographical features of the NHH2 interaction. In the present paper, we present new collisional rates based on the determination of a new, highly accurate, NHH2 ab initio PES. Ammonia and hydrogen molecules are treated as rigid rotors and H2 is further constrained in the scattering calculations to be in the (spherically symmetrical) para- state, as in Danby et al. (1988). Hence, the main difference between the present collisional rates and those of Danby et al. (1988) arises from the PES. These new rates are then used to estimate the robustness of the ammonia thermometer and the excitation of ammonia lines under the condition that prevails in cold molecular clouds, prestellar cores and protostars ( 100 K). For this, we compute the excitation of both o-NH3 and p-NH3 using a non-LTE radiative transfer code. The paper is organized as follows. In §2 we present both the new NHH2 PES and the scattering calculations. Our excitation computations and the comparison with earlier computations are presented in § 3, and §4 concludes this article.
2 Potential energy surface and collisional rates
2.1 Potential Energy Surface
The ammonia and hydrogen molecules were both assumed to be rigid. This assumption is adequate here because i) the investigated collisional energies are below the first vibrational excitation threshold of ammonia ( Rajamäki et al., 2004) and ii) the corresponding collision time scales are much faster than the inversion motion of ammonia. Monomer geometries were taken at their ground-state average values, as recommended by Faure et al. (2005). The average structure of NH3 was derived from the high-accuracy calculations of Rajamäki et al. (2004): , and . The ground-state average geometry of H2 was taken as (e.g. Faure et al., 2005). The conventions of Phillips et al. (1994) were employed in defining the NH3-H2 rigid-rotor (five-dimensional) coordinate system (one H atom lies in the plane).
The NHH2 PES was constructed using the following two step procedure: (i) a reference PES was computed from a large set (89,000 points) of CCSD(T)222CCSD(T) stands for the coupled cluster method with noniterative evaluation of triple excitations. calculations using the Dunning’s correlation consistent aug-cc-pVDZ basis set; (ii) this reference surface was calibrated using a complete basis set (CBS) extrapolation procedure based on a smaller set (29,000 points) of CCSD(T)/aug-cc-pVTZ calculations. A CBS-type extrapolation was applied to the correlation part of the interaction energy and was performed using a two-point type extrapolation, where is the cardinal number corresponding to the basis set, as described in Jankowski & Szalewicz (2005). The self-consistent field (SCF) contribution was not extrapolated but was taken at the aug-cc-pVTZ level. All basis sets were supplemented with midbond functions and all calculations were counterpoise corrected as in Jankowski & Szalewicz (2005). The same strategy was recently applied to H2COH2 (Troscompt et al., 2009).
Grid points were chosen for 29 fixed intermolecular distances (in the range a0) via random sampling for the angular coordinates of H2 relative to NH3. At each intermolecular distance, the interaction energy was then least square fitted using a 120 terms expansion for the angular coordinates, using Eq. (3) of Phillips et al. (1994) adapted to the C3v symmetry of NH3. This expansion includes anisotropies up to and , where the integer indices and refer to the tensor ranks of the angular dependence of the NH3 and H2 orientation, respectively. The CBS correction was fitted over a subset of only 46 angular terms with and . We note that the expansion restricted to p-H2 (), in which all terms with are eliminated, includes only 24 terms. The accuracy of the angular expansions was monitored using a self-consistent Monte Carlo error estimator. A cubic spline interpolation was finally employed over the whole intermolecular distance range and was smoothly connected with standard extrapolations to provide continuous radial expansion coefficients suitable for scattering calculations. Technical details on the fitting strategy can be found in Valiron et al. (2008). The accuracy of the final five-dimensional fit was found to be better than 1 cm-1 in the long-range and minimum region of the interaction ( Bohrs). The accuracy of the above procedure was also checked against a moderate set (1,200 points) of “high-cost” CCSD(T)-R12 calculations which offer a direct way of reaching the basis set limit value within a single calculation, that is without extrapolation (Noga & Kutzelnigg, 1994). The RMS error between the final fit and the benchmark CCSD(T)-R12 values was found to be lower than 1 cm-1 in the whole attractive part of the interaction ( Bohrs). We emphasize that the intrinsic accuracy of CCSD(T) calculations at the basis set limit is cm-1.
Constraining H2 in its lowest para level () is strictly equivalent to averaging the PES over the H2 rotational motion. The global minimum of this averaged PES lies at -85.7 cm-1 for =6.3 Bohrs, with H2 in an almost equatorial location, equidistant from the two closest H atoms of ammonia. A similar location was found for the global minimum of the NHHe interaction, but with a significantly more shallow potential well at cm-1 (Hodges & Wheatley, 2001). The five-dimensional PES, including the anisotropy of H2, is of course qualitatively different: the global minimum, as deduced from our fit, lies at cm-1 for Bohrs, with H2 colinear with the C3v axis of ammonia at the nitrogen end. It is interesting to compare this result with the recent calculations of Mladenović et al. (2008): these authors found the global minimum of the NHH2 interaction at a similar location with a comparable, although significantly smaller, binding energy ( cm-1). As their calculations were performed at a similar level of accuracy (CCSD(T) method and aug-cc-pVQZ basis sets), this difference most likely reflects monomer geometry effects. Detailed comparisons will be investigated in dedicated future works.
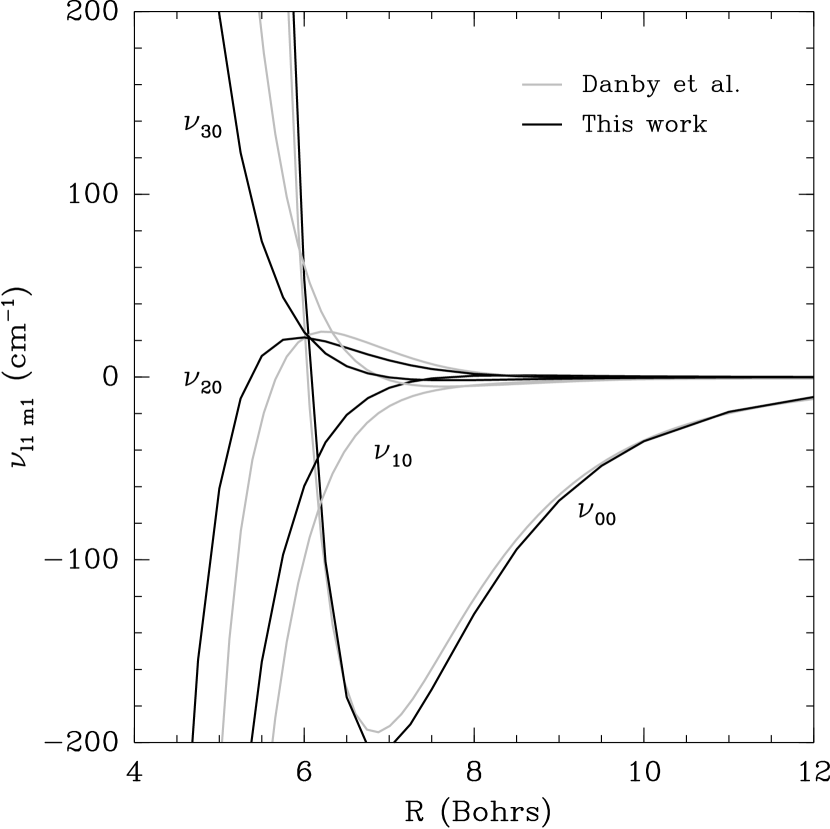
Now, in order to compare the present NHH2 PES with that employed by Danby et al. (1988), we present in Fig. 1 a comparison of the angular expansion coefficients . The definition of these coefficients is given in Eq. (2.1) of Danby et al. (1986) and their values are listed in their Table 4333 corresponds to in Eq. (2.1) of Danby et al. (1986).. Only the first four are plotted for clarity in the figure. Despite significant differences at short-range ( Bohrs), the overall agreement between the two sets of coefficients is quite reasonable. This comparison i) indicates the good quality of the ab initio calculations of Danby et al. (1986) and ii) suggests moderate effects of the new PES on the dynamics, as shown below.
Finally, it should be noted that the PES of Danby et al. (1986) has been previously checked against laboratory measurements: Schleipen et al. (1993) and Willey et al. (2002) reported, respectively, symmetry-resolved state-to-state and broadening cross sections. In both cases, a good overall agreement was obtained between theory and experiment, suggesting the adequacy of the PES. Discrepancies were however noted, in particular strong propensity rules predicted by theory for NHp-H2 were observed in experiment to a much lower extent (see below).
2.2 Scattering calculations
The quantal theory for scattering of a symmetric top with an atom or a structureless molecule like H2 (=0) can be found in Green (1976). The extension of the formalism to the scattering of a symmetric top with a linear molecule can be found in Offer & Flower (1990) and Rist et al. (1993). In the present work, calculations were performed using the (nonreactive) scattering code MOLSCAT (Hutson & Green, 1994)444http://www.giss.nasa.gov/tools/molscat in which the extension to allow for the rotational structure of H2 is not yet implemented. Hence, the present calculations were restricted to collisions between NH3 and p-H2 (. Extension to p-H2() and o-H2() is under way and is further discussed below.
All calculations were performed at the close-coupling (CC) level. Inversion doubling was neglected and the inversion-tunneling wavefunction was simply taken as a linear combination of two delta functions centered at the equilibrium position (Green, 1976; Davis & Boggs, 1978). We actually tested this approximation on the NHHe system by taking the inversion coordinate explicitly into account, as done previously by Davis & Boggs (1981). To this aim, we employed the high quality NHHe PES of Hodges & Wheatley (2001), which does include the inversion dependence of the interaction. The inversion motion was found to have a negligible effect (less than 10 %) on the rigid-body interaction potential and on the cross sections (Scifoni et al., 2007), as was concluded by Davis & Boggs (1981) from a lower quality potential. We note that van der Sanden et al. (1992) obtained a comparable result for the NHAr interaction. A similar conclusion is therefore expected for the NHH2 interaction, although the inversion dependence of this PES is yet not known.
We adopted the rotational constants cm-1 and cm-1. The reduced mass of the system is 1.802289 a.m.u. As the ortho- and para-levels of ammonia do not interconvert in inelastic collisions, these were treated separately. The coupled-channel equations were integrated using the modified log-derivative propagator of Manolopoulos (1986). The radial propagation used a stepsize parameter STEPS=10 except at total energies below 30 cm-1 where STEPS was increased up to 300 to constrain the step length of the integrator below 0.1 Bohrs. Other propagation parameters were taken as the MOLSCAT default values. Calculations were performed for collision energies between cm-1 and 700 cm-1. The energy grid was adjusted to reproduce all the details of the resonances, with an energy step of 0.2 cm-1 up to total energies of 150 cm-1 and 0.5 cm-1 from 150 to 300 cm-1. All calculations also included several energetically closed channels to ensure that cross sections were converged to within % for all transitions involving . Thus, at the highest investigated energies, the basis set incorporated all target states with and 12 for o- and p-NH3, respectively.
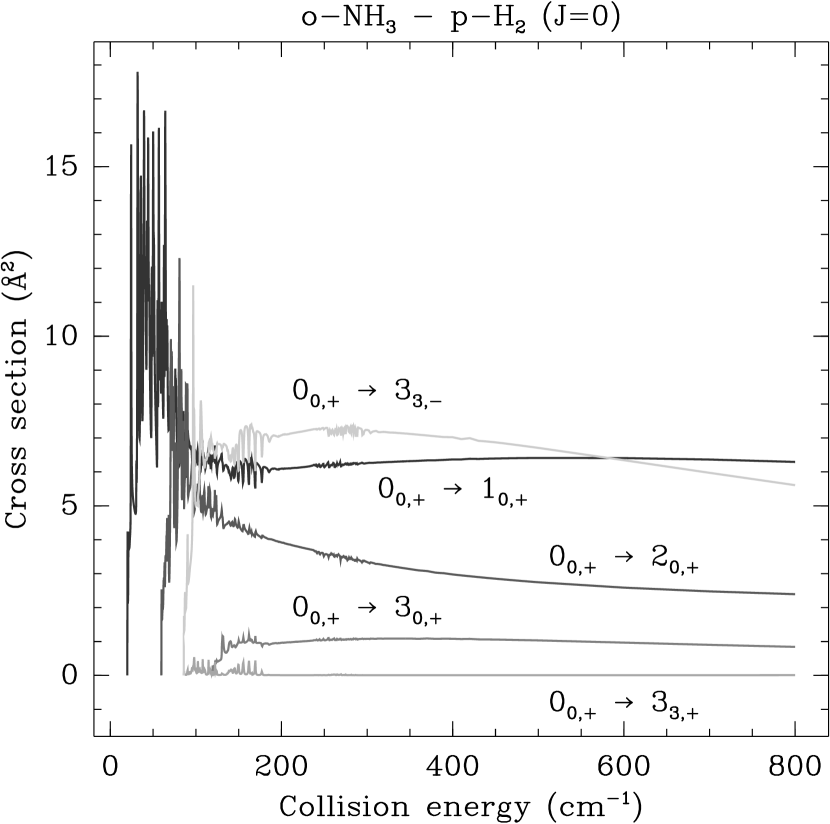
Excitation cross sections for o-NH3 are presented in Fig. 2 for rotation-inversion transitions out of the ground state of o-NH3. Prominent resonant features are observed in this plot. These are caused by both Feshbach and shape type resonances. It should be noted that only Feshbach type resonances are observed in NHHe collisions (e.g. Machin & Roueff, 2005). This difference between He and H2() reflects the deeper potential well of the NHH2 PES, as discussed in Sect. 2.1. Resonances are found to significantly increase the cross sections at low energy and, therefore, the rate coefficients at low temperature. For example, at 10 K, the NHH2 rate coefficient for the ground-state transition of o-NH3 is a factor of 20 larger than the NHHe rate of Machin & Roueff (2005). We note, however, that this factor reduces to 2.5 for the transition at the same temperature. Willey et al. (2002) also reported significant differences (up to a factor of 4) between p-H2 and He broadening cross sections. It is also noticed that the cross section for the transition is much lower than for . This propensity rule was already observed in earlier calculations (Offer & Flower, 1990; Rist et al., 1993) but, interestingly, it was found to be considerably weakened for collisions with o-H2 () and it was observed experimentally only to a slight extent (Schleipen et al., 1993). On the other hand, it was found to be preserved when including the state in the p-H2 basis set (Offer & Flower, 1990; Rist et al., 1993). This inclusion was also found to change the absolute values of the cross sections, at a few selected energies, by up to a factor of 3 (Offer & Flower, 1990; Rist et al., 1993). Its effect on the average cross sections and rate coefficients is however expected to be moderate, typically 2030 %. This was indeed checked in the case of ND2HH2 calculations employing the present PES (Scifoni et al., in preparation). As a result, the rate coefficients presented below are expected to be accurate within typically 30 %.
Cross sections were integrated over Maxwell-Boltzmann distributions of collisional velocities and collisional rate coefficients were obtained in the range 5100 K for all transitions involving ammonia levels with (the lowest levels with lie at 177 and 237 K above the ground states of p- and o-NH3, respectively). Higher levels and temperatures were not investigated in the present work because collisional rates with o-H2 are required in models considering temperatures above 100 K. These collisional rate coefficients are made available in the BASECOL555http://www.obspm.fr/basecol/ and LAMBA666http://www.strw.leidenuniv.nl/~moldata/ databases as well as at the CDS777http://cdsweb.u-strasbg.fr/.
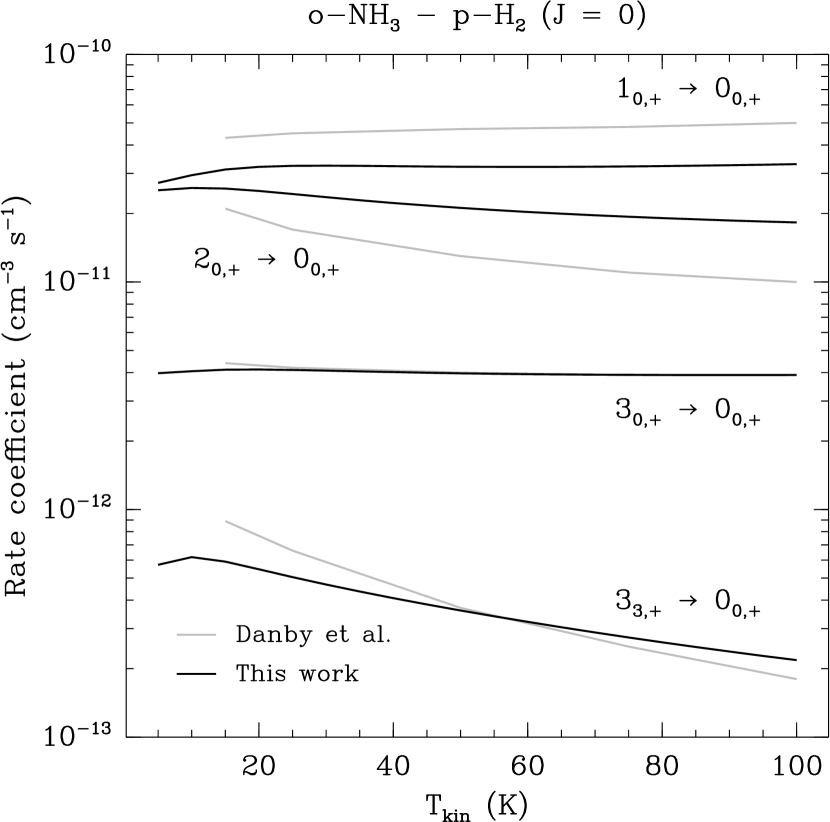
In Fig. 3, downward rate coefficients are presented for rotation-inversion transitions towards the ground state. The resonant features are found to be completely washed out by the thermal average. The present results are compared with the data of Danby et al. (1988). As expected from the comparison of the expansion angular coefficients (see Fig. 1), the new rates agree within a factor of 2 with those of Danby et al. (1988). We see, however, that there is no particular trend, although the present rates are generally larger.
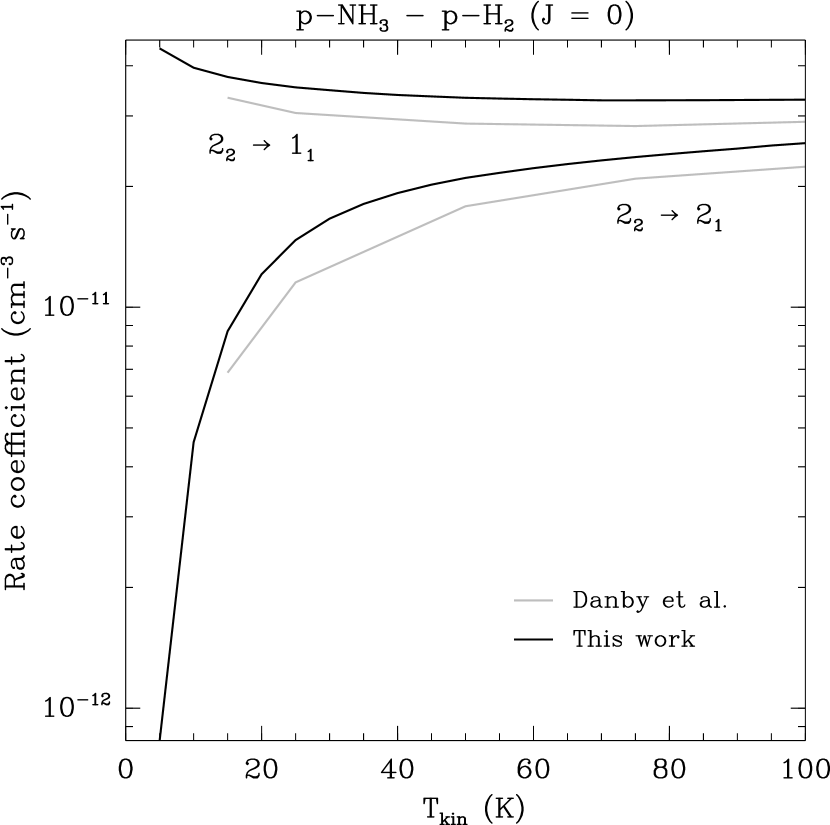
In Fig. 4, we show the symmetry-averaged rates and that appears in Eq. (1), as a function of the temperature. The new rates are found to be larger than those of Danby et al. (1988) by typically 15% but to follow closely the same temperature dependence. As a result, minor modifications of the ammonia thermometer are expected, as shown below.
3 Non-LTE excitation computations
In order to estimate the effect of the new collisional rates on the calibration of the ammonia thermometer, we have computed the excitation of both o-NH3 and p-NH3 using the large velocity gradient code of van der Tak et al. (2007). We have used the o-NH3 and p-NH3 collisional rates with p-H2 presented in the previous section, as well as those from Danby et al. (1988), for comparison. The latter were taken from the LAMBA database (Schöier et al., 2005). Collision between NH3 and He were neglected, because, in addition to H2 being more abundant than He by a factor of 5, NH3-H2 collision rates are typically a factor of 3 larger than the NH3-He rates (Machin & Roueff, 2005). Energy levels, statistical weights and Einstein coefficients were taken from the JPL database for molecular spectroscopy (Pickett et al., 1998). For the calculations using Danby et al. (1988) collisional rates, the first 24 levels of o-NH3 and the first 17 levels of p-NH3 were considered (corresponding to energy levels up to 416 and 297 cm-1, respectively). For the calculations using the new rates, only the first 6 levels of o-NH3 and the first 10 levels of p-NH3 were considered (up to 118 and 115 cm-1, respectively). In both cases, we have neglected the hyperfine structure of the molecule, i.e. we have considered that each hyperfine level within a given inversion level corresponds to the same energy level. While this hypothesis will lead to an overestimate of the line opacity for optical depths greater than a few, it is valid if the line is optically thin (Daniel et al., 2006). We have therefore chosen a column density to velocity gradient ratio that is large enough for this approximation to be valid (; the same value adopted by Walmsley & Ungerechts (1983)).

Fig. 5 shows the excitation temperature between the and metastable levels computed using both sets of collisional rates and as a function of the kinetic temperature. This excitation temperature is obtained by summing the populations of the and within each rotational state. A p-H2 density of 104 cm-3 was assumed. On this figure, we also show the excitation temperature computed from Eq. (1), i.e. assuming that only the first three rotational levels are populated. As seen on this figure, the excitation temperature computed using the rates of Danby et al. (1988) and the one computed using the rates presented in this paper agree extremely well; both values differ by less than 2%. We also notice that for kinetic temperatures lower than 20 K, the excitation temperature is well approximated by Eq. (1), but it underestimates it at larger temperature, because higher energy levels start to become populated. The good agreement between the kinetic temperature obtained using the rates of Danby et al. (1988) and those presented in this paper can be simply understood by examination of Eq. (1). In this approximation, the excitation temperature depends on . Although the rates computed in this paper differ by 15% with respect to those of Danby et al. (1988), their ratio (and a fortiori the logarithm of their ratio) differ much less. Therefore, the relation between the excitation temperature and the kinetic temperature – or in other words the calibration of the ammonia thermometer – appears to be robust.
| Species | Transition | |||
|---|---|---|---|---|
| (GHz) | (K) | (cm-3) | ||
| p-NH3 | 23.694496 | 1.1 | ||
| p-NH3 | 23.722633 | 42.3 | ||
| p-NH3 | 23.098819 | 58.3 | ||
| p-NH3 | 22.834185 | 128.1 | ||
| p-NH3 | 22.234506 | 144.0 | ||
| o-NH3 | 23.870129 | 123.6 | ||
| o-NH3 | 572.498068 | 27.5 |
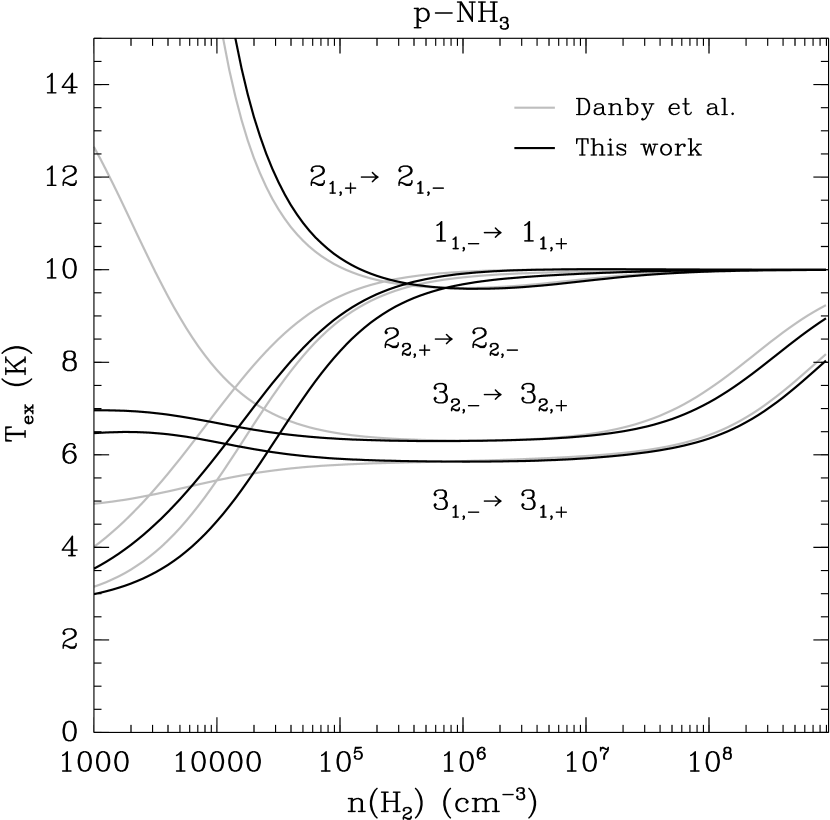
Fig. 6 shows excitation temperature of several p-NH3 inversion transitions, as a function of the density, for a kinetic temperature of 10 K and the same column density and line velocity than in Fig. 5. Spectroscopic data and critical densities are given in Table 1. For a multi-level system, the critical density can be defined (in the optically thin case) as the density at which the sum of the collisional de-excitation rates out of a given level is equal to the sum of the spontaneous radiative de-excitation rates:
| (3) |
where the summation is done over the levels (with energies smaller than that of the considered). With this definition, the critical density refer to a level, and not to a transition.
For densities lower than cm-3, the excitation temperature of the and inversion transitions computed using the rates presented here and those of Danby et al. show little differences. For these densities, collisional de-excitation is negligible, and the excitation temperature of these lines are close to the background temperature (2.73 K). For densities much greater than the critical density (i.e. cm-3), collisional de-excitation dominates, and lines are essentially thermalized. At intermediate densities, the and line excitation temperatures predicted using the rates from this work is slightly lower than the one predicted using those from Danby et al.. This is because the de-excitation rates from this work are smaller (by about a factor two) than those of Danby et al. for these lines. As a consequence, the critical densities of the corresponding levels is greater than previously estimated, and the transition thermalize at greater densities. Larger differences in the excitation temperatures of the and transitions – for which critical densities are a few cm-3 – are seen. For example, at a density of cm-3, the excitation temperature of the transition computed using the rates of Danby et al. is almost a factor two larger than the one computed with the rates obtained here. From the observer point of view, this has no consequences because the energy of the upper level of the transition is 123.6 K. At low densities, for the kinetic temperature considered here, the fractional population of this level is extremely small, and the predicted antenna temperature is essentially zero.
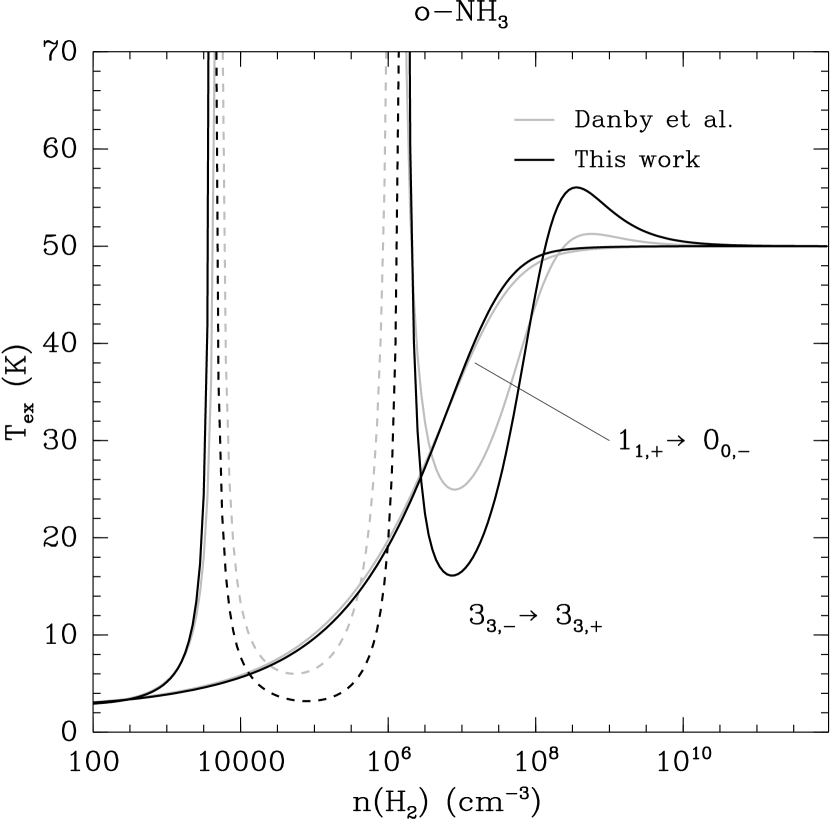
Fig. 7 shows the excitation temperature of the o-NH3 inversion transition as a function of the density, for the same column density to velocity gradient ratio than in Fig. 6, but – since the upper level of the transition lies at K above the ground level of o-NH3 – a kinetic temperature of 50 K 888The computations with the rates from the present work do not include the levels above . To make sure that these levels can be neglected at a kinetic temperature of 50 K, we have computed the excitation temperature for the transitions shown on Fig. 7 using Dandy’s rates, but without considering the levels above . These were found to be quasi-identical to those computed when the levels above are considered. The behavior of the excitation temperature is similar to that of p-NH3 inversion lines; at low density, it is close to the background temperature, while it is thermalized at densities greater than cm-3. We predict, in agreement with Walmsley & Ungerechts (1983), a population inversion for densities ranging between and cm-3 (note that the range in which the inversion occurs is slightly different for the two collisional rate sets). This population inversion was first predicted by Walmsley & Ungerechts (1983), and has been studied in detail by Flower et al. (1990). The corresponding maser transition has been since observed in several star forming regions, e.g. NGC 6334I (Beuther et al., 2007). As explained by Walmsley & Ungerechts (1983), the lower level of the transition () is de-populated by collisions to excited levels in the ladder, while it is populated by radiative transitions from the level. For densities greater than cm-3, the collisional de-population rate is greater than the radiative population rate of the lower level, and the inversion occurs. For densities greater than cm-3, excited levels in the ladder start to become populated and populate the level collisionally. This limits the maser gain to moderate values; for a density of cm-3, we predict a negative opacity of only .
Fig. 7 also shows the excitation temperature of the rotation-inversion transition of o-NH3. This line, at a frequency of GHz, was first detected towards OMC-1 with the Kuiper Airborne Observatory (Keene et al., 1983). It was also detected towards -Oph A with Odin space telescope (Liseau et al., 2003), and it will be soon observable with the Heterodyne Instrument for the Far Infrared (HIFI) on board the Herschel Space Observatory. This line is found to thermalize at densities of cm-3. Once again, little differences between the excitation temperatures computed using the rates of Danby et al. and those from this work are seen. No significant difference were found between the excitation temperatures of the other rotation-inversion transitions that will be observable with HIFI either.
4 Conclusions
We have presented new collisional excitation rates of p-NH3 and o-NH3 with p-H2(). With respect to older computations from Danby et al. (1988), the present rates were found to agree within a factor of 2. In order to investigate the effect of the new rates on the excitation of o-NH3 and p-NH3, we have computed the excitation of these species under physical conditions that are typical of dense molecular clouds, prestellar cores, as well as the outer envelopes of embedded protostars, using an LVG code. We found that the excitation temperature between the and levels computed using the new rates is almost identical to that computed using older rates at the low temperatures considered here ( K). Thus, the calibration of the ammonia thermometer appears robust. The effect of the new rates on the inversion transitions (at cm wavelenght) or the rotation-inversion transitions that will be observable with Herschel-HIFI are also found to be small.
Future works include extension of the present calculations to p-H2 and o-H2 as well as to higher ammonia levels and kinetic temperatures. Comparisons with double resonance (Daly & Oka, 1970), crossed beam (Schleipen et al., 1993) and pressure broadening (Willey et al., 2002) experiments will be also investigated, with the objective to establish the predictive ability of the present PES and to distinguish between the predictions of the available PES.
Acknowledgments
The authors wish to acknowledge their friend and colleague Pierre Valiron who initiated the work that lead to this paper. Pierre passed away on August, 31th 2008, and he is deeply missed. We also thanks Evelyne Roueff for her critical reading of this manuscript. This research was supported by the CNRS national program “Physique et Chimie du Milieu Interstellaire” and by the FP6 Research Training Network “Molecular Universe” (contract number MRTN-CT-2004-512302).
References
- Barrett et al. (1977) Barrett A. H., Ho P. T. P., Myers P. C., 1977, ApJ, 211, L39
- Beuther et al. (2007) Beuther H., Walsh A. J., Thorwirth S., Zhang Q., Hunter T. R., Megeath S. T., Menten K. M., 2007, A&A, 466, 989
- Cheung et al. (1969) Cheung A. C., Rank D. M., Townes C. H., Welch W. J., 1969, Nature, 221, 917
- Daly & Oka (1970) Daly P. W., Oka T., 1970, J. Chem. Phys., 53, 3272
- Danby et al. (1986) Danby G., Flower D. R., Kochanski E., Kurdi L., Valiron P., 1986, Journal of Physics B Atomic Molecular Physics, 19, 2891
- Danby et al. (1988) Danby G., Flower D. R., Valiron P., Schilke P., Walmsley C. M., 1988, MNRAS, 235, 229
- Daniel et al. (2006) Daniel F., Cernicharo J., Dubernet M.-L., 2006, ApJ, 648, 461
- Davis & Boggs (1978) Davis S. L., Boggs J. E., 1978, J. Chem. Phys., 69, 2355
- Davis & Boggs (1981) Davis S. L., Boggs J. E., 1981, J. Chem. Phys., 75, 3937
- Faure et al. (2005) Faure A., Valiron P., Wernli M., Wiesenfeld L., Rist C., Noga J., Tennyson J., 2005, J. Chem. Phys., 122, 1102
- Flower et al. (1990) Flower D. R., Offer A., Schilke P., 1990, MNRAS, 244, 4P
- Green (1976) Green S., 1976, J. Chem. Phys., 64, 3463
- Green (1980) Green S., 1980, J. Chem. Phys., 73, 2740
- Ho et al. (1979) Ho P. T. P., Barrett A. H., Myers P. C., Matsakis D. N., Chui M. F., Townes C. H., Cheung A. C., Yngvesson K. S., 1979, ApJ, 234, 912
- Ho & Townes (1983) Ho P. T. P., Townes C. H., 1983, ARA&A, 21, 239
- Hodges & Wheatley (2001) Hodges M. P., Wheatley R. J., 2001, J. Chem. Phys., 114, 8836
- Hotzel et al. (2002) Hotzel S., Harju J., Juvela M., 2002, A&A, 395, L5
- Hutson & Green (1994) Hutson J. M., Green S., 1994, MOLSCAT computer code, version 14 (1994). distributed by Collaborative Computational Project No. 6 of the Engineering and Physical Sciences Re search Council UK
- Jankowski & Szalewicz (2005) Jankowski P., Szalewicz K., 2005, J. Chem. Phys., 123, 4301
- Keene et al. (1983) Keene J., Blake G. A., Phillips T. G., 1983, ApJ, 271, L27
- Liseau et al. (2003) Liseau R., Larsson B., Brandeker A., Bergman P., Bernath P., Black J. H., Booth R., Buat V., Curry C., Encrenaz P., Falgarone E., Feldman P., Fich M., Florén H., Frisk U., Gerin M., 2003, A&A, 402, L73
- Machin & Roueff (2005) Machin L., Roueff E., 2005, Journal of Physics B Atomic Molecular Physics, 38, 1519
- Manolopoulos (1986) Manolopoulos D. E., 1986, J. Chem. Phys., 85, 6425
- Mladenović et al. (2008) Mladenović M., Lewerenz M., Cilpa G., Rosmus P., Chambaud G., 2008, Chemical Physics, 346, 237
- Morris et al. (1973) Morris M., Zuckerman B., Palmer P., Turner B. E., 1973, ApJ, 186, 501
- Noga & Kutzelnigg (1994) Noga J., Kutzelnigg W., 1994, J. Chem. Phys., 101, 7738
- Offer & Flower (1990) Offer A., Flower D. R., 1990, J. Chem. Soc. Faraday. trans., 86, 1659
- Phillips et al. (1994) Phillips T. R., Maluendes S., McLean A. D., Green S., 1994, J. Chem. Phys., 101, 5824
- Pickett et al. (1998) Pickett H. M., Poynter R. L., Cohen E. A., Delitsky M. L., Pearson J. C., Müller H. S. P., 1998, JQSRT, 60, 830
- Rajamäki et al. (2004) Rajamäki T., Kállay M., Noga J., Valiron P., Halonen L., 2004, Molecular Physics, 102, 2297
- Rist et al. (1993) Rist C., Alexander M. H., Valiron P., 1993, J. Chem. Phys., 98, 4662
- Schleipen et al. (1993) Schleipen J., ter Meulen J. J., Offer A. R., 1993, Chem. Phys., 171, 347
- Schöier et al. (2005) Schöier F. L., van der Tak F. F. S., van Dishoeck E. F., Black J. H., 2005, A&A, 432, 369
- Scifoni et al. (2007) Scifoni E., Valiron P., Faure A., Rist C., 2007, in Molecules in Space and Laboratory, J.L. Lemaire & F. Combes (eds.)
- Troscompt et al. (2009) Troscompt N., Faure A., Wiesenfeld L., Ceccarelli C., Valiron P., 2009, A&A, 493, 687
- Valiron et al. (2008) Valiron P., Wernli M., Faure A., Wiesenfeld L., Rist C., Kedžuch S., Noga J., 2008, J. Chem. Phys., 129, 134306
- van der Sanden et al. (1992) van der Sanden G. C. M., Wormer P. E. S., van der Avoird A., Schleipen J., Ter Meulen J. J., 1992, J. Chem. Phys., 97, 6460
- van der Tak et al. (2007) van der Tak F. F. S., Black J. H., Schöier F. L., Jansen D. J., van Dishoeck E. F., 2007, A&A, 468, 627
- Walmsley & Ungerechts (1983) Walmsley C. M., Ungerechts H., 1983, A&A, 122, 164
- Willey et al. (2002) Willey D. R., Timlin Jr. R. E., Merlin J. M., Sowa M. M., Wesolek D. M., 2002, ApJSS, 139, 191