The radio counterpart of the likely TeV binary HESS J0632+057
Abstract
The few known -ray binary systems are all associated with variable radio and X-ray emission. The TeV source HESS J0632057, apparently associated with the Be star MWC 148, is plausibly a new member of this class. Following the identification of a variable X-ray counterpart to the TeV source we conducted GMRT and VLA observations in June-September 2008 to search for the radio counterpart of this object. A point-like radio source at the position of the star is detected in both 1280 MHz GMRT and 5 GHz VLA observations, with an average spectral index, , of 0.6. In the VLA data there is significant flux variability on month timescales around the mean flux density of 0.3 mJy. These radio properties (and the overall spectral energy distribution) are consistent with an interpretation of HESS J0632057 as a lower power analogue of the established -ray binary systems.
keywords:
radio-continuum: stars, X-rays: binaries1 Introduction
There are three firmly established GeV emitting binaries; PSR B125963 (Aharonian et al., 2005b), LS 5039 (Aharonian et al., 2005a) and LS I +61 303 (Albert et al., 2006), all systems composed of a compact object and a high-mass star. LS 5039 harbours an O6.5V type star in a 3.9 day orbit, the massive star in the other systems is of Be type. PSR B125963 is the only one of these systems in which the nature of the compact companion (a 48 ms period radio pulsar in a 3.4 year orbit around the star) has been identified. All three systems display similarities in their radio to TeV -ray spectral energy distributions (SEDs) including a hard X-ray spectrum and a softer TeV spectrum, radio emission above 1 GHz and variability in all bands. There is also evidence for a single TeV flare from the luminous X-ray binary Cygnus X-1 (Albert et al., 2007), a system of a black hole and an O9.7 Iab star in a 5.6 day circular orbit.
The point-like TeV source HESS J0632+057 (Aharonian et al., 2007), has been suggested as a new member of this class of objects. This suggestion was based on associations with the massive star MWC 148 (HD 259440) and the unidentified ROSAT and EGRET sources 1RXS J063258.3+054857 and 3EG J0634+0521, and would imply that MWC 148 has a hidden compact companion. X-ray observations of this source with XMM-Newton in 2007 revealed a point-like, hard spectrum (1.26), X-ray source at the position of MWC 148 (Hinton et al., 2009). Significant variability was detected on timescales of a few hours. The association of this X-ray source with the TeV source (and both sources with MWC 148) seems highly likely and the spectral properties of the X-ray/-ray source are consistent with the known -ray binaries. Very recently the VERITAS collaboration have published flux upper limits which imply variability in the TeV emission of this object (Acciari et al., 2009).
Historical studies of MWC 148 have determined the star to be of spectral type B0pe (Morgan et al., 1955). Be stars are classified by the presence of Balmer emission lines. MWC 148 was rejected as a Herbig AeBe star due to a non-detection during the IRAS survey (The et al., 1994) and thus is believed to represent one of the ‘classical’ Be stars. These stars are fast rotators, thought to be spinning at 50-90% of their critical velocity (note Gutiérrez-Soto et al. (2007) give sin of MWC 148 to be 430 km s-1) with a large stellar wind and a high mass loss rate. The flattening of the circumstellar envelope produces a global polarisation of the envelope of a few percent. The most recent measured values of the polarisation of MWC 148 are 3-4% (Yudin & Evans, 1998). The star also exhibits a significant infrared excess (see 2MASS, Skrutskie et al., 2006) consistent with the existence of an extended envelope. The source lies between the Monoceros Loop supernova remnant and the star forming regions of the Rosetta Nebula (1.4 kpc). A compatible distance estimate of 1.5 kpc is calculated using the apparent visual magnitude of MWC 148, = 9.1 (Høg et al., 2000), as described in Hinton et al. (2009). No variability was detected from the star during the ASAS-3 optical survey (Gutiérrez-Soto et al., 2007). Bp stars are defined by their unusual surface abundances and strong (up to kG, see e.g. Borra & Landstreet, 1979) surface magnetic fields (Phillips & Lestrade, 1988). The confinement of the stellar wind in these strong fields is thought to lead to strong shock heating and variable X-ray emission. Townsend et al. (2007) speculate that such a process may be capable of accelerating particles up to TeV energies.
All of the known binaries have been detected at radio wavelengths at flux levels of 10–100 mJy (see Dubus, 2006, and references therein). The radio spectra of LS 5039 and LS I +61 303 have spectral indices close to = 0.5 (where ). In LS I +61 303 the radio flux is modulated with the orbital period, whereas in LS 5039, the radio emission (unlike the X-ray and TeV emission) is not (see e.g. Clark et al., 2001). No targeted radio observations of MWC 148 had previously been conducted. Here we present new radio observations resulting in a detection of the system with both the VLA and the GMRT.
2 The new radio data
2.1 VLA data
HESS J0632+057 was observed for 6 hours at 5 GHz with the Very Large Array111The National Radio Astronomy Observatory is a facility of the National Science Foundation operated under cooperative agreement by Associated Universities, Inc. (VLA) in D-configuration (angular resolution 14′′) during July – September 2008 (program AS944). The time was divided into three 2 hour observations separated by 1 month. The data were calibrated using the NRAO AIPS (Astronomical Image Processing System; Bridle & Greisen, 1994) software package and then loaded into DIFMAP(Shepherd et al., 1994) for additional editing and imaging. The flux density scale was set using a scan of 3C 147 at the end of each observation and the phase was monitored with scans of the calibration source 0632+103. The off-source rms in each observation (0.03 – 0.04 mJy/beam) was estimated from large sourceless boxes, far from the phase centre and was found to be close to the thermal noise limit for a 2 hour observation of 0.03 mJy/beam.
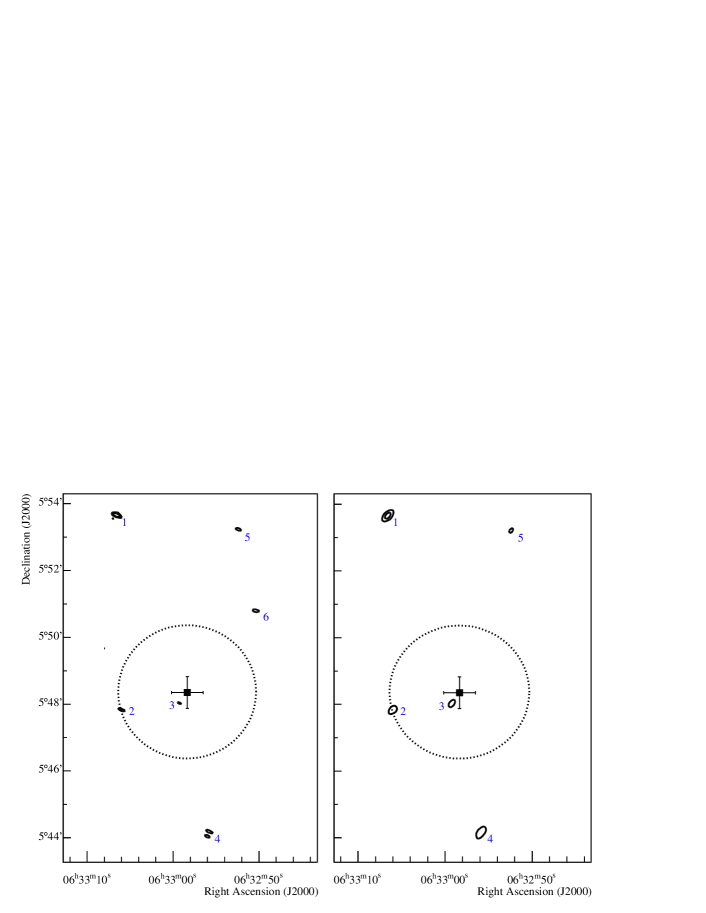
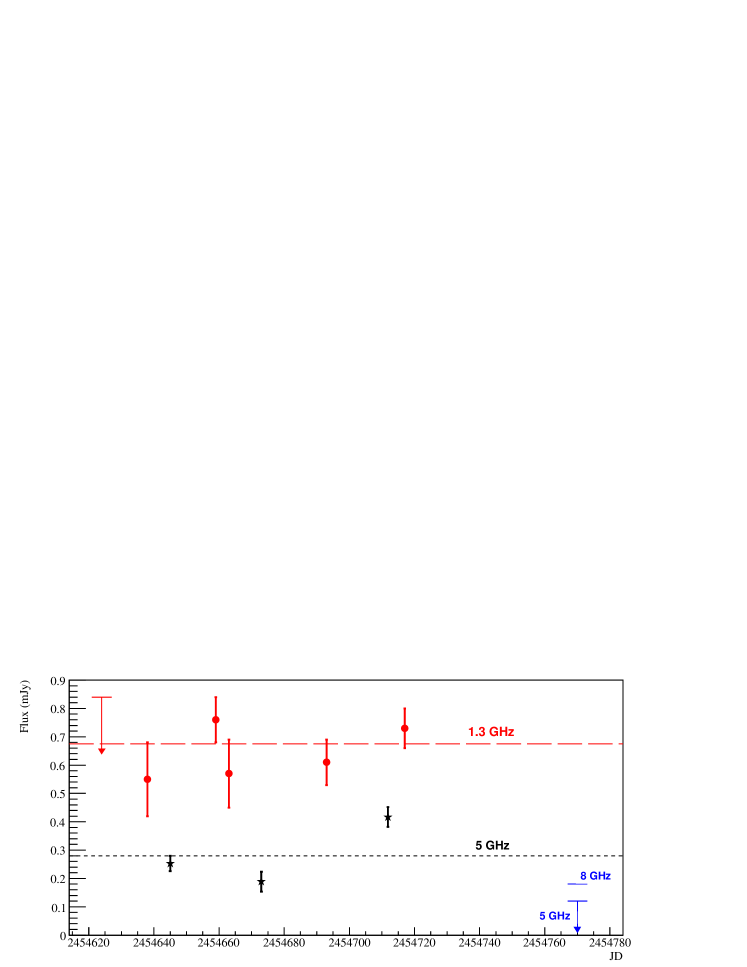
Five unresolved sources were found above 5 within the 9′ primary beam radius of the best fit position of HESS J0632+057. One of these sources (hereafter source #3) is located at 06h32m59.24s 0.3′′, +05∘48’00.8” 0.3′′, consistent with the position of MWC 148. This position was derived from a two-dimensional Gaussian fit to the brightest single VLA observation. The error on this measurement is statistical only. Emission is detected from this source in all three observations and the measured flux varies significantly from observation to observation: from mJy to mJy (/dof for a constant fit = 19.4/2, chance probability = 6.110-5), see Fig. 3. Additionally, since each 2 hour observation consisted of four 21 minute scans of the region surrounding HESS J0632+057, we searched for shorter timescale (intrahour) variability. No evidence was found for short-term (1 hour) variability of source #3 in the scan-by-scan light-curves. Source #3 was modelled with an elliptical 2D Gaussian in the map plane resulting in a size of 7′′ by 4′′ (1), consistent with an unresolved source.
A further 3 hour observation at 5 and 8.5 GHz with the VLA in the high resolution A-configuration (program AS967) was taken in October 2008. However, source #3 was not detected during this observation, presumably due to a low flux state of this object. A plausible alternative reason for the non-detection is that the source is extended on scales significantly larger than the beam (but smaller than the 2′′ 1.28 GHz GMRT beam), reducing the signal/noise achievable in this configuration. To circumvent this issue, the A configuration data were tapered to match the 2′′ 1.28 GHz GMRT beam and rms point source limits at 5 and 8 GHz were measured and plotted in Fig. 3. All four of the field sources detected during the D configuration observations were also present in the A configuration observations.
The next closest source to MWC 148 (source #2) lies on the edge of the rms size limit of the TeV emission, at 06h33m06.01s 0.3′′, 05∘47′49.63′′ 0.3′′. The source displays a power-law spectrum with and has a flux density at 5 GHz of 0.7 0.2 mJy/beam. A multi-wavelength catalogue search resulted in no counterparts at this position. One of the field sources (source #1) shows significant variability both on the month separation timescale of these observations and on shorter (hour) timescales. This source is located at 06h33m06.59s 0.3′′, +05d53′39′′24 0.3′′, and is visible both in the NVSS archive (1.4 GHz, Condon et al., 1998) with a flux of 15 mJy (cf 12 mJy in the GMRT 1.28 GHz observations) and in the XMM-Newton image of this field. Constant fluxes were recorded for all remaining field sources in all observations.
2.2 GMRT data
We also observed the field of HESS J0632+057, using the Giant Metrewave Radio Telescope222GMRT is run by the National Centre for Radio Astrophysics of the Tata Institute of Fundamental Research. (GMRT) (Swarup et al., 1991) during June – September 2008. The GMRT array has 30 antennas, arranged in roughly a ‘Y’ configuration over 25 km area. The target field was observed for a total of 36 hours with 6+6 slots of 3 hours each at 1280 and 610/235 MHz. We observed simultaneously at 235 and 610 MHz, using synthesised bandwidths of 6 and 16 MHz, respectively. The 1280 MHz observation was carried out with a bandwidth of 16 MHz in each of the two available sidebands. Each frequency channel is 125 kHz in width, enabling the removal of narrow-band radio frequency interference (RFI). The sources 3C 147 and 3C 48 were observed at the beginning and end of the observations and used as amplitude and bandpass calibrators to set the flux density scale. The sources 0632+103 and 0521+166 were used as phase calibrators at 1280 and 610/235 MHz respectively. All frequency channels affected by strong narrow-band RFI were flagged and removed from the entire data set using the AIPS software package.
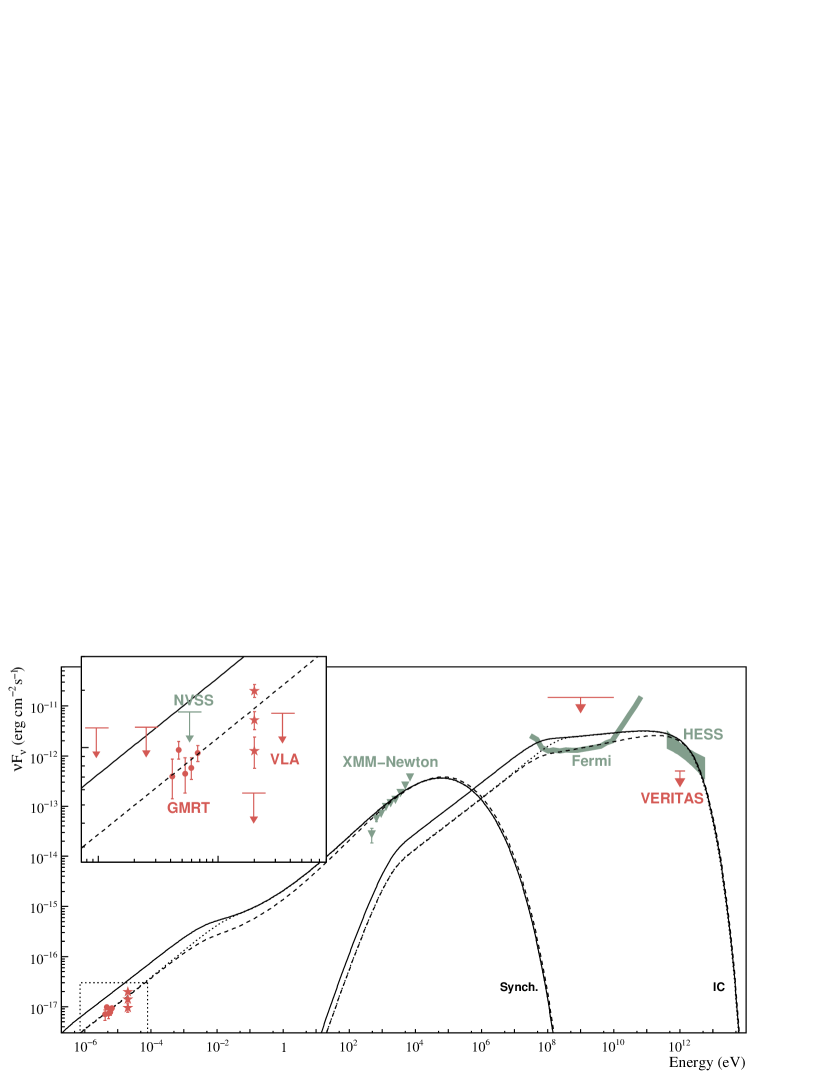
A faint, unresolved radio source is detected at the position of MWC 148 (see Fig. 1) in five of the six 1280 MHz observations, with an average flux of 0.68 0.04 mJy (see Fig. 3). The best fit position of this source from the full data set is 06h32m59.29s 0.5′′, +05∘48’01.2” 0.5′′. There is no significant evidence for variability in these data over the week to month timescales of the observations. MWC 148 was not detected above the 3 level in the lower frequency observations. Upper limits on the flux at 610 MHz and 235 MHz have been calculated and included on the SED shown in Fig. 4. The typical noise levels at 610 and 235 MHz were 0.74 and 1.82 mJy/beam respectively, the 1 GHz data were more strongly affected by RFI, resulting in a substantial increase in the rms noise.
3 Discussion
| Name | (kpc) | ∗ | r | X | γ | |||
|---|---|---|---|---|---|---|---|---|
| LS 5039 | 2.5 | 1.3 | 5–50 | 70 | 4–11 | 0.46⊕ | 0.45 – 0.6⊘ | 0.9 – 1.5⋈ |
| LS I +61 303 | 2.0 | 1–17 | 3–9 | 60 | 8 | -0.6 – 0.45† | 0.53‡ | 1.6 0.2♯ |
| PSR B1259-63 | 1.5 | 0.02–0.3 | 0.3–6 | …! | 2.3 | -2.2 – 0.3∐ | 0.78∙ | 1.7 0.2+ |
| Cygnus X-1 | 2.2 | 0.3 | 104 | …! | 12 | 0.1⋄ | 0.8⋆ | 2.2 0.6 |
| HESS J0632+057 | 1.5 | 0.003 | 0.13△ | 9 | 0.9⊗ | 0.6 | 0.26△ | 1.5 0.3⊗ |
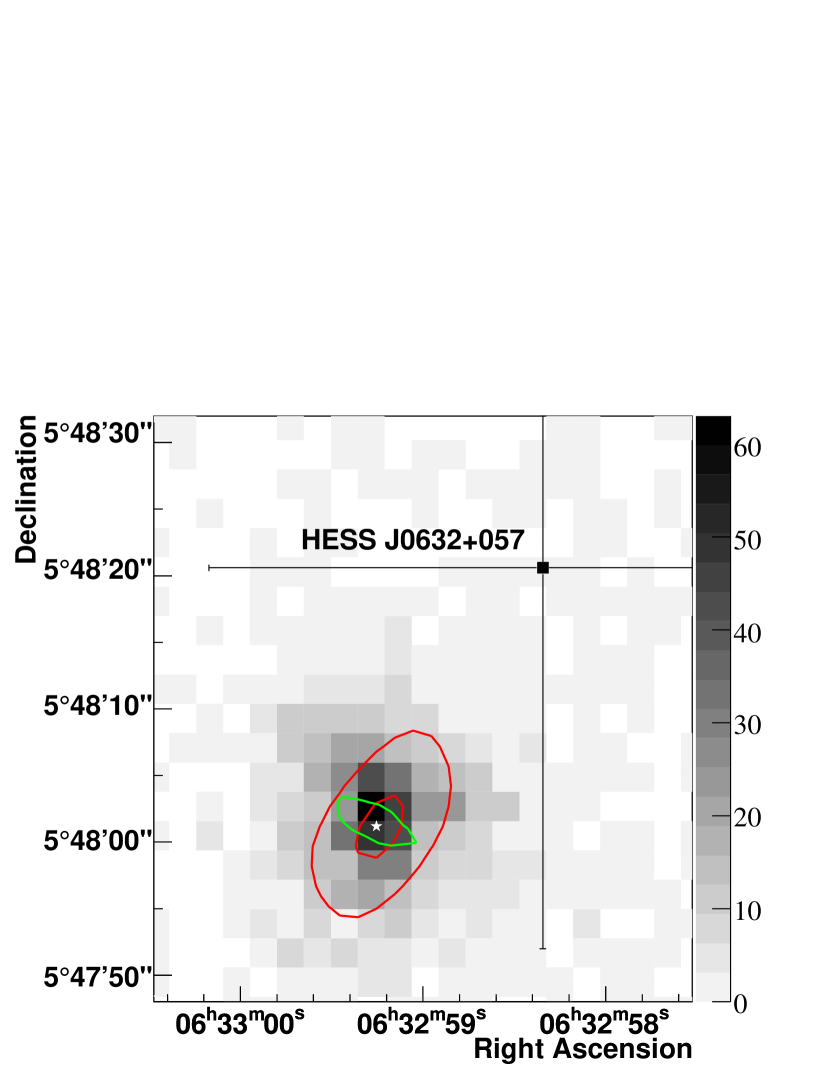
The radio properties of source #3 can be summarised as follows. The best fit positions of source #3 measured with the VLA and GMRT are consistent both with each other and with the position of MWC 148 (06h32m59.236s, +05∘48’01.04”; Høg et al., 2000). The new GMRT data provides the best constraint on the size of the radio emitting region in MWC 148. The upper limit on the source size (along the short axis of the GMRT beam) is 2′′. Assuming a distance to the star of 1.5 kpc, this corresponds to an upper limit on the emission region of 3000 AU. Significant variability was detected in the 5 GHz emission from MWC 148 at the 5 level. Variability at the same level may be present in the 1.28 GHz data but not detectable above the noise. The non-detection during the VLA A configuration observations further demonstrates the variable nature of the source. The variability timescale must be longer than the 2 hour scans and shorter than the month timescale separation of the observations. An estimate of the spectral index, based on the average flux at 1.28 GHz and 5 GHz, was calculated for source #3 to be = 0.6 0.2. However, this value should be treated with caution due to the non-simultaneous nature of the 1.28 GHz and 5 GHz observations.
The new radio source lies less than 1′′ from the centroid of the X-ray emission (Hinton et al., 2009), and within the 1 error box of HESS J0632+057 (see Fig. 2). Thus we confidently identify this emission as the radio counterpart to MWC 148. It seems very likely that all these objects are associated and therefore we can create an SED as shown in Fig. 4. The recent publication of the Fermi Bright Source List (Abdo et al., 2009) allows us to place constraints on the GeV emission from HESS J0632+057. As no source was detected (above 10 in the first 3 months of operation) at the position of HESS J0632+057, the EGRET source 3EG J0634+0521 can be ruled out as a potential counterpart. Limits for the GeV emission after 3 months, and 1 year of Fermi data have been added to the SED.
The detection of TeV emission implies particle acceleration is taking place in the source. The most natural explanation for the observed radio emission is then optically thin synchrotron emission from accelerated electrons. Synchrotron radiation with a spectral index 0.5 implies an underlying electron spectrum with . This can be interpreted as the injection spectrum. IC cooling in the Thomson regime is hard to avoid for these electrons. If the observed spectrum is cooled, then this implies a very hard injection spectrum. This scenario was the one presented in Hinton et al. (2009), in which there is a low energy cut-off in the injection spectrum, resulting in an effectively mono-energetic injection for electrons below this cut-off energy. Synchrotron cooling of such an injection will produce a time averaged electron spectral index of 2 and an emission spectrum with =0.5. The simple one-zone model presented in Hinton et al. (2009) and adjusted to fit the X-ray and TeV data, results in a radio spectrum remarkably similar to that observed. A better fit to the radio data can be achieved by adjusting the low-energy cut-off or a change in injection index from 2.0 to 1.9 (see Fig. 4). Assuming a one-zone model with the parameters described in Hinton et al. (2009), = 70 mG, = 1 erg cm-3, the radio emission at 5 GHz would be produced by 90 MeV electrons having a characteristic cooling time due to IC losses of 2 days. Similarly, 1.3 GHz emission would be produced by 50 MeV electrons with a cooling time of 4 days. The observed variability timescale, in common with that seen in X-rays, is comparable with the expected cooling times, even if the radio emission region is somewhat larger than the few AU assumed. We note that if the emission region was considerably smaller than this both significant free-free absorption at 1 GHz in the stellar wind and - absorption at a few hundred GeV on stellar photons would likely become apparent at some orbital phases. At this stage neither effect can be excluded. Strictly simultaneous multi-frequency radio data would be required to check for radio absorption features.
There are two main scenarios that could plausibly explain the observed emission from HESS J0632+057; firstly that the star is isolated, with a magnetically confined wind region and secondly that the star is in a binary system with an unseen compact companion. Although there are some interesting similarities between MWC 148 and the archetypal isolated magnetic Bp star Ori E, including similar X-ray variability timescales (Skinner et al., 2008; Aharonian et al., 2007), there are also significant differences. The X-ray emission from Ori E can be well fit by a two-temperature apec model with a hot component of 2.6 keV whereas the X-ray emission from MWC 148 can only be fit with such a model if the temperature of the hot component is well above 10 keV, due to the substantial flux in the 5–10 keV band. At radio wavelengths Ori E displays a flat spectrum ( 0)between 2–20 GHz, whereas the emission from MWC 148 appears to have a negative spectral index. The radio light-curve of Ori E is strongly modulated with the orbital period. This may also be the case with MWC 148, but further observations are clearly needed to characterise its radio variability.
As can be clearly seen in Tab. 1 there is a strong resemblance between the known -ray binaries and HESS J0632+057. Although HESS J0632+057 is a much weaker source in all wavelengths, the similar spectral properties make a convincing argument that this object does indeed represent a new -ray emitting binary system. The apparent variability in the TeV emission of HESS J0632+057, as inferred by the VERITAS collaboration (Acciari et al., 2009), is also consistent with the properties of the known -ray binary systems. All objects in Tab. 1 exhibit a hard ( 1) spectrum in the X-ray domain, with HESS J0632+057 having a particularly hard spectrum. The TeV spectral indices of all objects are consistent with each other and all considerably softer than the corresponding X-ray spectrum. All objects appear to have their peak energy output in the MeV to GeV range. Note that GeV emission has only been detected using Fermi coincident with LS I +61 303 and LS 5039 (Abdo et al., 2009). Upper limits for the other sources have been estimated using detected sources close to the objects of interest to determine the local detection threshold. The -ray binaries all display variable radio emission with a wide range of spectral properties including low energy spectral turnovers (see e.g. Godambe et al., 2008). The clear outlier in this group is Cygnus X-1, for example, although the radio and VHE -ray luminosities are similar, the X-ray luminosity of Cygnus X-1 is orders of magnitude greater than the other objects. Resolved radio emission has been detected in both LS I +61 303 and LS 5039 (Paredes et al., 1998; Ribó et al., 2008) with emission regions of the order of 10 AU. Our current observations are unable to probe such small scales and more data is required in order to resolve or further constrain the size of the emitting region and move towards a better understanding of this source. Whilst the detection of variable radio emission from MWC 148 further strengthens the case that HESS J0632+057 is indeed a TeV binary, the scenario that this object is an (extremely unusual) isolated massive star remains an intriguing possibility.
Acknowledgments
We thank the staff of the GMRT who made these observations possible. We thank Dr. S. Roy and Prof. V. Kulkarni of NCRA, for the help provided during the GMRT observation and data transmission to the Leiden Observatory, H. E. Wheelwright and J. J. Stead for useful discussions and an anonymous referee for helpful comments. J.A.H. is supported by a UK Science and Technology Facilities Council (STFC) Advanced Fellowship. C. C. C. is supported by an appointment to the NASA Postdoctoral Program at Goddard Space Flight Center, administered by Oak Ridge Associated Universities through a contract with NASA. G.D. is supported by European Community contract ERC-StG-200911.
References
- Abdo et al. (2009) Abdo, A. A., Ackermann, M., Ajello, M., et al. 2009, ArXiv e-prints, 0902.1340
- Acciari et al. (2009) Acciari, V. A., Aliu, T., Arlen, M., et al. 2009, ArXiv e-prints, 0905.3139
- Aharonian et al. (2005a) Aharonian, F., et al. (H.E.S.S. Collaboration) 2005a, Science, 309, 746
- Aharonian et al. (2005b) Aharonian, F., et al. (H.E.S.S. Collaboration) 2005b, A&A, 442, 1
- Aharonian et al. (2006) Aharonian, F., et al. (H.E.S.S. Collaboration) 2006, A&A, 460, 743
- Aharonian et al. (2007) Aharonian, F., et al. (H.E.S.S. Collaboration) 2007, A&A, 469, L1
- Albert et al. (2009) Albert, J., Aliu, E., Anderhub, H., et al. 2009, ApJ, 693, 303
- Albert et al. (2006) Albert, J., Aliu, E., Anderhub, H., et al. 2006, Science, 312, 1771
- Albert et al. (2007) Albert, J., Aliu, E., Anderhub, H., et al. 2007, ApJ, 665, L51
- Borra & Landstreet (1979) Borra, E. F. & Landstreet, J. D. 1979, ApJ, 228, 809
- Bridle & Greisen (1994) Bridle, A. H. & Greisen, E. W. 1994, AIPS memo 87; Charlottesville: NRAO
- Clark et al. (2001) Clark, J. S., Reig, P., Goodwin, S. P., et al. 2001, A&A, 376, 476
- Condon et al. (1998) Condon, J. J., Cotton, W. D., Greisen, E. W., et al. 1998, AJ, 115, 1693
- Dubus (2006) Dubus, G. 2006, A&A, 456, 801
- Esposito et al. (2007) Esposito, P., Caraveo, P. A., Pellizzoni, A., et al. 2007, A&A, 474, 575
- Godambe et al. (2008) Godambe, S., Bhattacharyya, S., Bhatt, N., & Choudhury, M. 2008, MNRAS, 390, L43
- Gregory (2002) Gregory, P. C. 2002, ApJ, 575, 427
- Gutiérrez-Soto et al. (2007) Gutiérrez-Soto, J., Fabregat, J., Suso, J., et al. 2007, A&A, 476, 927
- Hinton et al. (2009) Hinton, J. A., Skilton, J. L., Funk, S., et al. 2009, ApJ, 690, L101
- Høg et al. (2000) Høg, E., Fabricius, C., Makarov, V. V., et al. 2000, A&A, 355, L27
- Johnston et al. (2005) Johnston, S., Ball, L., Wang, N., & Manchester, R. N. 2005, MNRAS, 358, 1069
- Marti et al. (1998) Marti, J., Paredes, J. M., & Ribo, M. 1998, A&A, 338, L71
- Miller et al. (2005) Miller, J. M., Wojdowski, P., Schulz, N. S., et al. 2005, ApJ, 620, 398
- Morgan et al. (1955) Morgan, W. W., Code, A. D., & Whitford, A. E. 1955, ApJS, 2, 41
- Pandey et al. (2007) Pandey, M., Rao, A. P., Ishwara-Chandra, C. H., Durouchoux, P., & Manchanda, R. K. 2007, A&A, 463, 567
- Paredes (2008) Paredes, J. M. 2008, in AIP Conference Series, Vol. 1085, 157–168
- Paredes et al. (1998) Paredes, J. M., Massi, M., Estalella, R., & Peracaula, M. 1998, A&A, 335, 539
- Phillips & Lestrade (1988) Phillips, R. B. & Lestrade, J.-F. 1988, Nature, 334, 329
- Ribó et al. (2008) Ribó, M., Paredes, J. M., Moldón, J., Martí, J., & Massi, M. 2008, A&A, 481, 17
- Shepherd et al. (1994) Shepherd, M. C., Pearson, T. J., & Taylor, G. B. 1994, in BAAS, Vol. 26, 987–989
- Skinner et al. (2008) Skinner, S. L., Sokal, K. R., Cohen, D. H., et al. 2008, ApJ, 683, 796
- Skrutskie et al. (2006) Skrutskie, M. F., Cutri, R. M., Stiening, R., et al. 2006, AJ, 131, 1163
- Swarup et al. (1991) Swarup, G., Ananthakrishnan, S., Kapahi, V. K., et al. 1991, Current Science, 60, 95
- Takahashi et al. (2009) Takahashi, T., Kishishita, T., Uchiyama, Y., et al. 2009, ApJ, 697, 592
- The et al. (1994) The, P. S., de Winter, D., & Perez, M. R. 1994, A&AS, 104, 315
- Townsend et al. (2007) Townsend, R. H. D., Owocki, S. P., & Ud-Doula, A. 2007, MNRAS, 382, 139
- Yudin & Evans (1998) Yudin, R. V. & Evans, A. 1998, A&AS, 131, 401