Dwarf galaxies in the NGC 1023 Group
Abstract
We present a compilation of galaxies in the NGC 1023 Group, an accumulation of late-type galaxies at a distance of 10 Mpc. Members at high and intermediate luminosities were identified from their spectroscopic velocities. Members at low luminosities were identified from their morphologies on wide-field CCD images. The faint-end slope is in the range . There is evidence for two dwarf galaxy populations: one in the halo of NGC 1023 that is dominated by dwarf elliptical galaxies, and one in the infall region surrounding NGC 1023 that contains mainly dwarf irregular galaxies. Similar distinctive populations are observed in the Local Group.
Through our imaging surveys, a picture has emerged of the distributions and types of dwarf galaxies over a wide range of environments. Of greatest interest is a correlation between dwarf galaxy population and parent halo mass. The number of dwarfs per unit mass is constant over the range of halo masses . There are small but significant variations in luminosity functions with location. These variations can be attributed to differences in the bright and intermediate luminosity populations. In less evolved regions marked by substantial populations of spirals, galaxies with intermediate luminosity are relatively common, and such regions have low mass-to-light ratios. In more evolved regions where spirals are absent there is relative depletion at intermediate luminosities and, overall in such places, mass to light ratios are high. Statistics are still poor for regions outside of massive halos but the faint end slope of the luminosity function is comparable in the field with what is found in the massive halos. Everywhere that has been studied, the faint end slope is unequivocally shallower than the slope at low masses anticipated by hierarchical clustering theory. Though the slope is shallow, there is no hint of a cutoff down to an observational limit of .
keywords:
galaxies: photometry – galaxies: clusters: individual: NGC 1023 Group – galaxies: luminosity function – galaxies: mass function1 Introduction
In this paper we continue our study of the dwarf galaxy population in various environments within the Local Supercluster. This project was motivated by the observation that in dense environments like the Virgo (Sandage et al. 1985) and Fornax (Ferguson & Sandage 1988) Clusters there are many dwarf elliptical galaxies, many of which are nucleated, yet dwarf galaxies are rare in diffuse spiral-rich environments like the Ursa Major Cluster (Trentham et al. 2001). A program was begun to look down to very faint magnitudes in groups of galaxies of differing size and composition. If large numbers of dwarf galaxies exist in any environment, their detection could relieve the missing satellite problem (Moore et al. 1999, Klypin et al. 1999) in that environment – a difficulty for the generally successful CDM galaxy formation models.
A first look (Trentham & Tully 2002) suggested that differences do exist between environments and encouraged a more detailed study. It soon became clear that the main limitation in determining the dwarf galaxy properties in nearby groups of galaxies was not so much in detecting low-luminosity low-surface brightness (LSB) galaxies as it was in establishing their distances. If we could not determine a distance with any accuracy, it would not be possible to establish group membership. The emphasis in the project then turned towards finding methods to distinguish low-surface brightness dwarfs from background galaxies. Background (luminous) low-surface brightness galaxies are rare, but they exist in enough number to be a problem.
We found that the most productive way to discriminate group members from LSB background galaxies is using morphological features. For example, weak spiral structure or a sharp discontinuity in the light profile are symptomatic of a distant, luminous galaxy, not a nearby dwarf. On the other hand, a galaxy with a central nucleation in an otherwise diffuse and symmetric ellipsoid is almost certainly a dwarf of class dE,N. In order to make these judgments, deep optical images were required. With large-format mosaic CCDs we could survey large areas of the sky and obtain meaningful counting statistics for relatively small groups of galaxies. The best instrument–telescope combination for the study was the square-degree MegaCam detector (Boulade et al. 1998) on the 3.6 m Canada-France-Hawaii Telescope (CFHT).
The first two environments we studied were the dense elliptical-rich concentrations of galaxies around the gE galaxies NGC 5846 and NGC 1407 (Mahdavi et al. 2005, Trentham et al. 2006). In both cases, we detected many dwarf elliptical galaxies, similar to those observed in the Virgo Cluster. The luminosity function had a logarithmic slope over the magnitude range , subtly but significantly steeper than the values seen in the Local Group (van den Bergh 2000) and in the field (Blanton et al. 2003, Norberg et al. 2002).
The next group given attention was around the luminous Sb galaxy NGC 5371 (Tully & Trentham 2008). This group has a considerably larger spiral fraction than either of the groups discussed in the previous paragraph so might have provided a sample in an environment common to most galaxies. It turned out that there is a significant dwarf galaxy population in this group but centered on the interacting S0 pair NGC 5353/4. We thought we would be studying a spiral-rich, presumably unevolved, group, but found a more complicated situation. The group has a red, dead core that had recently received an influx of gas-rich systems.
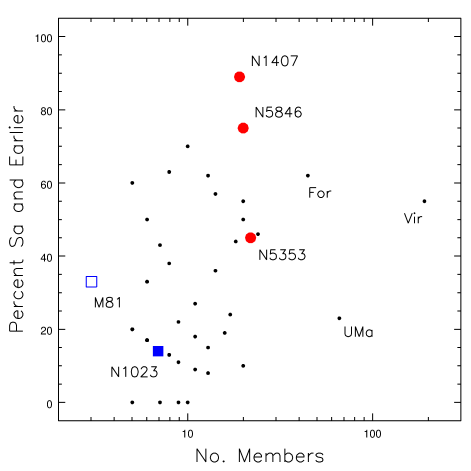
A characterization of nearby clusters and groups of galaxies is shown in Figure 1. The abscissa gives a measure of the group richness and the ordinate gives a measure of the degree of evolution, marked by the transformation of galaxies from gas-rich to gas-poor (see the discussion in Kormendy & Bender 1996). The small black symbols are drawn from a complete high latitude sample of groups within 25 Mpc discussed by Tully (1987, 2005). The first two groups that we studied, those around NGC 1407 and NGC 5846, are both modest in richness but among the most highly evolved of local structures. The group around NGC 5353 was selected for its spiral content but turns out to be a composite of evolved and unevolved components. In a companion program, Chiboucas, Karachentsev, and Tully (2009) have completed a study of the sparse, spiral-dominant M81 Group.
This paper extends the project with a study of the group around NGC 1023. This is a spiral-rich group of low enough density that it is representative of the environments in which most galaxies in the Universe reside. At 10 Mpc (Tully et al. 2009), it is considerably closer than the other groups, except M81. Therefore, we might expect to probe further down the luminosity function. Being so nearby, it was necessary to image a substantial area of the sky. As the group is so sparse, it can be anticipated that the confusion between group members and contaminants might be intimidating. The groups studied earlier gave us training to tackle this more difficult case.
A concern of studies of poor groups such as this one is that of counting statistics. The group contains only a few luminous galaxies, and this leads to severe Poisson uncertainties. This is the inevitable consequence of an attempt to study an environment common to most galaxies. Spiral-rich environments are typically diffuse groups. Large accumulations of spiral galaxies like the Ursa Major Cluster (Tully et al. 1996, Trentham et al. 2001) are rare. The Ursa Major Cluster is sufficiently distant that we cannot probe the luminosity function down to the the faint levels studied in this paper.
Another interesting comparison will be with the Local Group (van den Bergh 2000). This environment is the one where the luminosity function has been extended to the faintest known representatives of galaxies in the Universe (Koposov et al. 2008). The Local Group consists of two large halos in the process of virializing, embedded in a common infall region. The luminosity function of the ensemble is numerically dominated by the populations in the virializing regions. The statistics offered by the Local Group are insufficient to reveal a difference in the luminosity functions of the infall and collapsed regions. The observations discussed here include the collapsed core and infall region around NGC 1023, so provide some enlightenment regarding the luminosity function at the extremely low densities of the infall domain.
In Section 2 we describe the NGC 1023 environment and in Section 3 we describe our observations. In Section 4 we present the sample. In Section 5 we discuss the results of a dynamical analysis and in Section 6 we present the luminosity function. In Section 7 we place these results into a consistent framework and Section 8 is a summary.
2 The Choice of Survey Area
We wanted to study a region with a concentration of spirals but otherwise as isolated as possible. The target should be nearby so the luminosity function could be accessed to faint levels. As a consequence of the topology of local structure, most nearby groups are confused. Unless accurate distances are available, problems arise from contamination between separate structures in the line of sight.
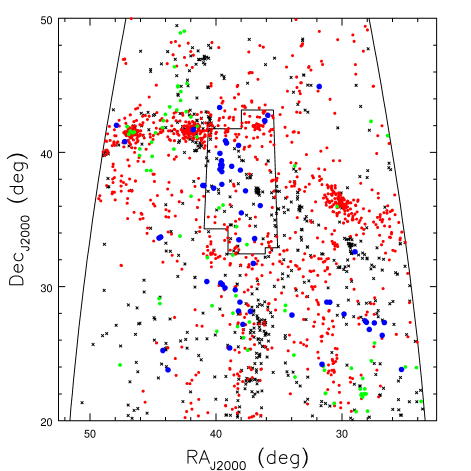
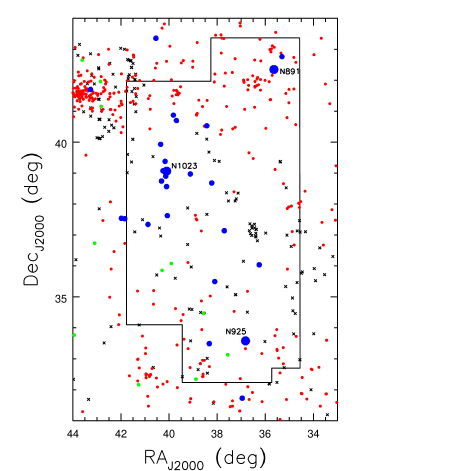
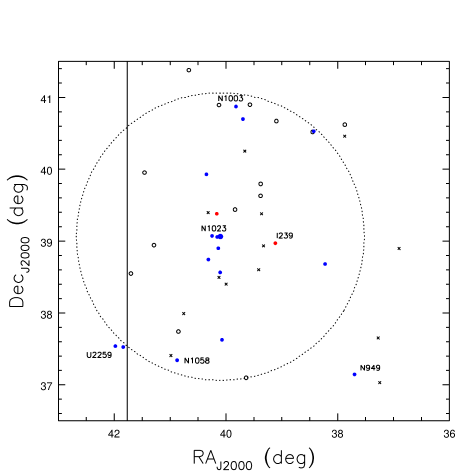
The group around NGC 1023 is reasonably well disposed with regard to these concerns. Figure 2 provides the big picture. Symbol color, shape, and size provides depth discrimination for galaxies with known velocities in the region of interest. The dominant structure, coded red, is the Perseus–Pisces filament (Haynes & Giovanelli 1988) at . Our interest is in a grouping of the objects in blue at . Figure 3 is a blow up of the central part of Fig. 2. The blue symbols cluster around NGC 1023, the brightest galaxy in the region. The CFHT MegaCam survey was undertaken in the area bounded by the irregular box. The second and third brightest galaxies in the region, NGC 891 and NGC 925, are included within the survey.
We wanted to study a volume rich in spirals but it must be noted that NGC 1023 is a lenticular galaxy. However, all the other 26 galaxies with velocities less than 1000 plotted in Fig. 3 are spirals or magellanic irregulars.
Histograms of heliocentric velocities are given in Figure 4; open for the larger region of Fig. 2 and filled for the restricted region of the CFHT survey. Peaks in the distribution occur at 600, 5000, and 10,000 . In the immediate field of the survey, there are no known galaxies between 1000 and almost 3000 . If one views the distribution of galaxies in three dimensions, it is found that a continuous filament runs from the Local Group through the NGC 1023 Group and all the way to the Perseus–Pisces structure. Members of this connecting filament are seen in green in Figs. 2 and 3. There is possible contamination from this structure in the extreme bottom–left corner of the survey. The area of the survey includes most of the known galaxies associated with NGC 1023 and is otherwise devoid of galaxies until the distance of the Perseus–Pisces complex.
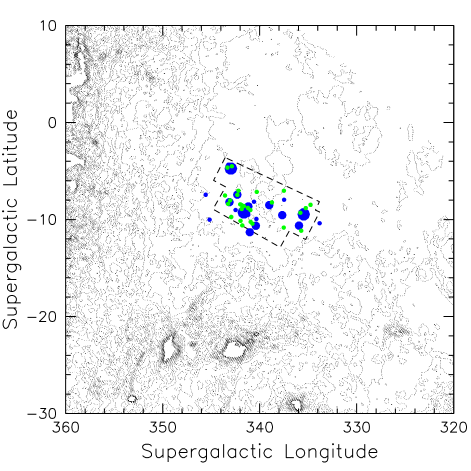
It is to be acknowledged that the Galactic latitude of the NGC 1023 Group is uncomfortably low at . However, obscuration is low across the survey region at (Figure 5). The situation is not ideal, but the NGC 1023 Group is the most suitable target for our study.

3 Observations
3.1 The Imaging Survey
Observations were made with the MegaCam mosaic CCD camera (Boulade et al. 1998) on the Canada–France–Hawaii 3.6 m telescope on Mauna Kea. Exposures were taken in queue mode under approximately photometric condition in July-December 2003. The median seeing was 0.7 arcseconds. The MegaCam detector is a mosaic of 36 CCDs, providing a field of view of 60′ x 60′. Images were made with a dither of half a field of view of the camera so that gaps were filled in and so that every piece of the sky was observed twice, allowing us to establish that the data were taken under photometric conditions. The data were reduced and calibrated using the Terapix (Bertin et al. 2002) pipeline. A total of 109 x 5 minute exposures were taken, all using the Gunn -band. As in the previous paper in this series (Tully & Trentham 2008) magnitudes have been transformed to the Cousins system defined by Landolt (1992). A total area of 60.7 deg2 was covered down to a limiting surface brightness of 1 = 27 mag arcsec2 within an aperture of FWHM = 2 arcsec.
In an earlier study (Trentham & Tully 2002, hereafter TT02) we presented deep observations of the core of the NGC 1023 group taken with the mosaic CCD SuprimeCam detector on the 8.2 m Subaru Telescope. The current survey of 60 times the area covers much of the infall region around the central galaxy. The large angular size of this survey is also useful in establishing the morphological characteristics and density of field LSB galaxies. This is particularly important in the current study because the NGC 1023 group is very diffuse and counting statistics are a problem. Therefore minimizing other sources of uncertainty, such as contamination in the sample from field LSB galaxies, is particularly important.
3.2 Subaru spectroscopic observations
|
Optical spectra were obtained for a small number of galaxies in the area of NGC 1023 as a secondary program. Observations were made with the Faint Object Camera and Spectrograph (FOCAS; Saito et al. 2003) at the Cassegrain focus of Subaru Telescope over the nights 21–23 November, 2006. Kristin Chiboucas and Andisheh Mahdavi participated in the observations as co-investigators in the primary program (discussed elsewhere). The instrumental set-up involved the 600-450 grism providing a dispersion of pix-1 over the spectral range 3765–5260 Å. A slit was used to maximize the signal received from low surface brightness candidates.
Five targets were successfully observe. Two of these were high surface brightness early-type systems that we suspected are giant galaxies in the background but, on morphological grounds, could be small nearby ellipticals. It was not a surprise to find that these two objects are indeed in the background. The other three targets were suspected to be group members and were confirmed to be so from their observed velocities. They are identified by the ID numbers introduced in Table 2. In all cases, the only identifiable spectral features are absorption lines. Candidate ID 42 is extremely faint and the velocity assignment is uncertain.
3.3 Neutral Hydrogen observation
The extremely large, low surface brightness object Candidate ID 38 was observed in the 21cm line of HI by Hélène Courtois on 2007 December 2 with the 100m Green Bank Telescope. The target was not detected at the level of 1 Jy km s-1.
4 Membership considerations and the catalog
|
|
Within the area of this survey, there are about 100,000 galaxies detected by the Terapix pipeline. Roughly 99.9% are in the background. We are interested in the 0.1% of low luminosity galaxies that are in the group. These normally have the distinguishing property that they have low surface brightnesses.
We performed an initial cut from the 100,000 galaxies that are detected to a much smaller number for more detailed study. Following previous studies, galaxies are considered with inner and outer concentration parameters (ICP and OCP)
| (1) |
| (2) |
Faint galaxies () are given consideration if they extend across more than 2 arcsec2 with surface brightness mag arcsec-2. These criteria reduce the number of objects in the sample from 100,000 to about 250.
The sample derived from these criteria contains most group dwarfs (the exceptions being compact ellipticals like M32; de Vaucouleurs 1961) but it admits background galaxies. Some are distinguished on the basis of morphology. Background galaxies that pass the surface brightness test frequently have central high surface brightness components, or hints of spiral structure, or indications of tidal interactions. We qualitatively rate all the candidates as (1) probable members, (2) possible members, (3) plausible members, and (4) probable background. Our terminology has turned out to be conservative in our previous studies of this series. Two-point correlation analyses and spectroscopic follow-ups provided evidence that galaxies rated 1 and 2 (probable/possible) were almost always group members, galaxies rated 3 (plausible) were members about 50% of the time, and galaxies rated 4 were background. While these numbers provide a useful guide for the current project, the fact that we may be dealing with later type dwarf galaxies means that we need an internally consistent way of assessing the ratings. The strategy described below in which we use galaxies whose positions near NGC 1023 suggest a high probability of membership to construct a training set reflects this need.
There were additional pieces of information we needed to take into account when compiling the sample. Point sources as faint as resolve in each 5 minute exposure so, at distance modulus 30.0, individual very bright supergiant stars are seen and current star formation regions can be identified. The problem is with systems with no young stars. In the earlier studies of the NGC 5846, NGC 1407, and NGC 5353/4 groups the surface densities of the dwarf populations were high and the groups had minimal line-of-sight contamination. In the current case of the NGC 1023 Group, the line-of-sight confusion only becomes severe with the profusion of objects in the Perseus–Pisces filament at 60 Mpc. Indeed, after we had established a tentative list of candidates based on the criteria used previously it was found that, while the galaxies with membership probability ratings 1 or 2 (probable/possible) were strongly correlated with the position of NGC 1023, the galaxies rated 3 (plausible members) were very poorly correlated with NGC 1023 and were better correlated with the Perseus–Pisces structure at 5,000 km s-1. A galaxy of given intrinsic properties in the Perseus–Pisces filament is offset with respect to its appearance in the NGC 1023 Group by 4 magnitudes in brightness and a factor 6 in size. A dE galaxy in the NGC 1023 Group with to has no self-similar counterpart 4 mag brighter at to in the Perseus–Pisces filament.
The problem is to distinguish a dE at in the NGC 1023 Group from a dE at at 5,000 km s-1. We can be confident that galaxies with appropriate velocities or rated 1–2 are in the nearby group but the location of so many marginal candidates in the Perseus–Pisces filament suggests that we have many near–background contaminants. Using the high confidence members as a training set, we used stricter morphological screening to arrive at the list of candidates given in Table 2. We consider that the list is comprehensive at the level of 90% down to (the brightest 40 candidates). Faintward, the list is incomplete and probably confused with contaminants. Candidates can easily be identified from our images at and even fainter but they cannot be confirmed as group members.
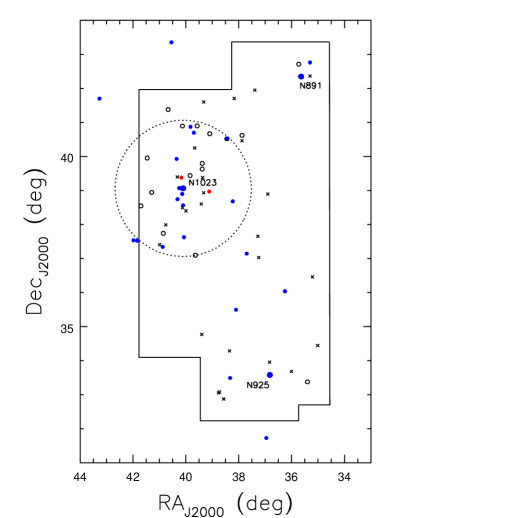
Table 2 provides information on 65 candidates within the wide-field imaging survey region. These candidates either have known velocities consistent with the group (hence given a membership probability rating 0) or they have membership ratings 1-3. In the table we list for each galaxy its type, rating, coordinates, distance from NGC 1023 in arcminutes, ID in TT02, apparent magnitude, and absolute magnitude. The absolute magnitude was calculated from the apparent magnitude using the equation
| (3) |
where is the Galactic extinction (Schlegel et al. 1998) and DM is the distance modulus, assumed to be 30.0 for the NGC 1023 Group.
The magnitudes presented in the table for all but the brightest galaxies are aperture magnitudes where the aperture size is set to equal a radius larger than that at which the galaxy blends into the sky. This method was motivated by the comparison between MegaCam and deep SuprimeCam data described by Trentham et al. (2006). For the brightest 7 galaxies which are saturated in the MegaCam images, magnitudes are taken from the compilation in the Homogenized Photometry catalog found in the Extragalactic Distance Database111http://edd.ifa.hawaii.edu (Tully et al. 2009). An band magnitude is directly available for NGC 925 but in the other cases the magnitude is inferred from the magnitude assuming . These luminous galaxies are affected by internal dust obscuration. Corrections to face-on orientation are made following the recipe in Tully et al. (1998). The magnitudes given in Table 2 include corrections for internal obscuration for the brightest seven galaxies; such corrections are negligible for the fainter galaxies.
The five unnumbered galaxies at the bottom of Table 2 identify systems with known velocities that give an association with the NGC 1023 Group but which lie outside the boundaries of the CFHT MegaCam survey.
5 Group Structure and Dynamics

It is evident from Fig. 6 and Fig. 7 that candidate group members are strongly concentrated to the region around NGC 1023. By analogy with what is known about other groups and clusters, it can be anticipated that galaxies in close proximity to NGC 1023 are in bound orbits within a massive halo while galaxies at a large distance are infalling.
This simple picture is supported by both velocity and density information. The velocity information is presented in Figure 8. Close to NGC 1023 velocity dispersions are high, but farther away they are moderate. A consistent picture emerges if is taken to be the radius about NGC 1023 of the surface of second turnaround of infalling galaxies (see Mahdavi et al. 2005 for a definition and description of this parameter). There are 17 galaxies with established velocities within kpc (with the distance to the group assumed to be 10 Mpc). The mean heliocentric velocity of these 17 galaxies is km s-1 with a dispersion of km s-1 and a standard deviation of 33 km s-1. The harmonic mean (virial) radius is 315 kpc and the virial mass is M⊙. The luminosity of the 41 galaxies within this same radius around NGC 1023 is L⊙ so the mass to light ratio is = 317 M⊙/L⊙. These calculations follow the procedures of the earlier papers in this series. As summarized in Tully & Trentham (2008), the radius of second turnaround can be described by two alternative relations:
| (4) |
| (5) |
From the derived values of , the mass in units of M⊙, and , the velocity dispersion, the NGC 1023 radius of second turnaround from these two alternative relations is 358 kpc and 349 kpc, respectively.

The fall-off in the surface density of galaxies with distance from NGC 1023 seen in Figure 9 provides confirmation of a transition at roughly . The discontinuities in velocity dispersion and density and the concurrence with expectations of Eqs. 4 and 5 give a consistent picture. The second turnaround surface around NGC 1023 lies at about kpc. Outside, the galaxies with known velocities in our sample have very close to the mean group velocity and must be bound, on first infall. They have slightly lower velocities than the mean so it can be anticipated that these infalling galaxies are slightly more distant than NGC 1023 and infalling with line-of-sight components toward us.
Figure 10 adds further details. All the confirmed and suspected candidates are represented. Symbol shapes and colors indicate morphological types: early in red, late in blue, and transition or ambiguous in green. There is an evident enhancement of the early types in close proximity to NGC 1023, within the circle. The late types are more dispersed. This visual impression is quantitatively confirmed with Figure 11. Seventy–two percent of the early type galaxies within the MegaCam survey region lie within the second turnaround radius and the median projected radius from NGC 1023 of these is kpc. By comparison, 55% of late types lie within and the median projected radius of these is kpc. The difference is marginal but there are enough galaxies that it is significant.
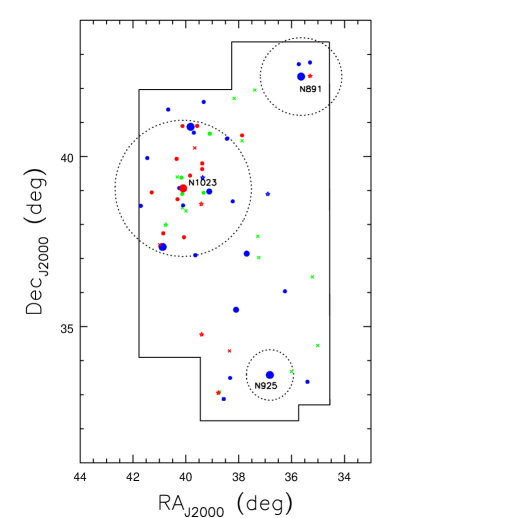
Circles are also plotted in Figure 10 around the second and third brightest galaxies, NGC 891 and NGC 925. In the case of NGC 891, the HI linewidth implies a rotation velocity of 220 km s-1 which suggests this system is similar in mass to the Milky Way, hence is expected to have a halo mass and dimension kpc = . From its HI linewidth, NGC 925 rotates at 115 km s-1 so would be a factor 3 less massive and have . It is seen that there are significantly fewer galaxies within either of these two domains than within the second turnaround radius of NGC 1023.
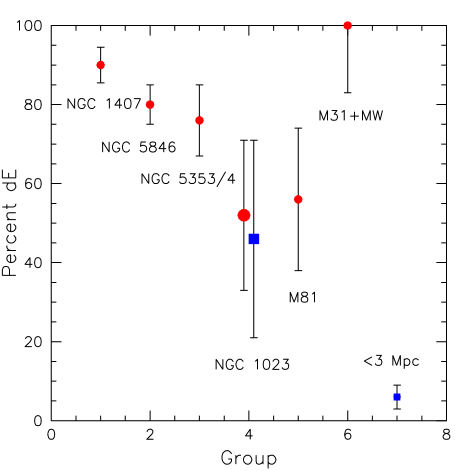
The tendency for dwarf galaxies to be dE rather than dI within the second turnaround radius is seen in Figure 12. Data from the earlier papers in this series are brought forward. In addition, there is information drawn from local neighborhood samples. Here, dwarfs are defined as galaxies with . The Local Group aside (where we have very good information but poor statistics), the lower mass, presumably less evolved places (NGC 1023 and M81 groups) have lower fractions of early type dwarfs than the higher mass and more evolved environments. Nonetheless, the early fractions are above half in all the second infall regions that have been observed in the course of this program.
In some environments. many dwarf ellipticals have a central nucleation. A substantial range of conditions have been probed over the series of papers describing our CFHT MegaCam observations. Morphological classifications dE,N (nucleated) and dE (non-nucleated) are given based on homogeneous image material and consistent criteria. Variations in the ratio of nucleated to non-nucleated dE are seen with Figure 13. The NGC 1407 and NGC 5846 groups are dense, dynamically evolved groups containing few late type systems. As seen in Fig. 12, most dwarfs in these groups are dE rather than dI. Now as seen in Fig. 13, roughly a third of these dE are nucleated. The NGC 5353/4 Group is an intermediate case with a core of early type galaxies, including a high fraction of dE rather than dI, but it is a group apparently receiving an influx of spiral and irregular systems. The fraction of nucleated dE is lower. The environments given attention here, around NGC 1023, M81, and the Local Group giants, are less evolved. Though the statistics are poor, a trend is emerging of a lower fractional population of nucleated dE in less dense, less dynamically evolved regions.

6 Luminosity function

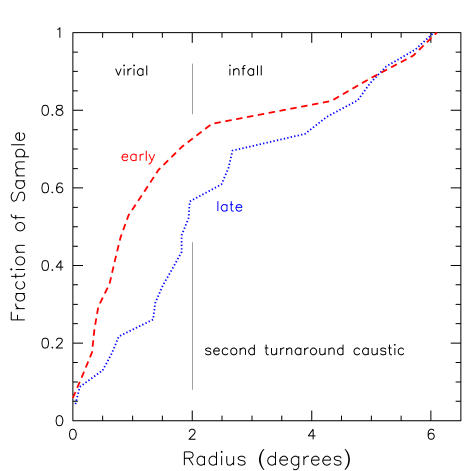
The luminosity function for galaxies in the NGC 1023 survey region is presented in the standard differential form in Figure 14. It is seen that statistics even with 1 mag binning are desperately poor. The cumulative luminosity function is more suited to a situation with small numbers. In Figure 15, one sees the separate cumulative luminosity functions for the regions within and beyond the second turnaround caustic inferred to lie about NGC 1023.
A ‘credibility limit’ is indicated at . It is seen that the luminosity function flares upward at fainter magnitudes, especially in the sample beyond the second turnaround caustic. The surface density of this sample is sparse, creating an acute susceptibility to confusion from background contaminants. The issue described earlier about contamination from dwarfs in the Perseus–Pisces background filament is evident. Candidates at least two magnitudes fainter than can be identified but they cannot reliably be distinguished from dwarfs in the filament.
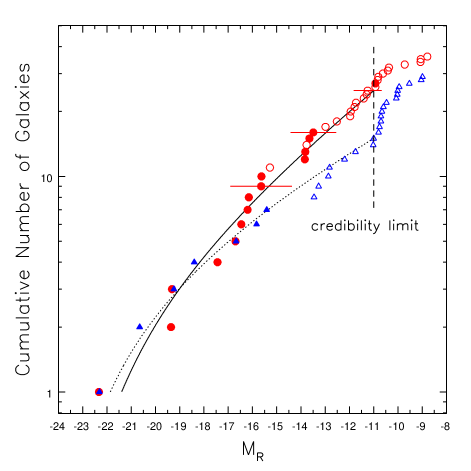
The situation brightward of is reasonably secure. Velocity measurements exist that confirm membership assignments for almost all candidates brighter than . Candidates without known velocities but brighter than are strongly clustered around NGC 1023 and a high fraction have morphological ratings 1 and 2, hence they are very probable members. In summary, the 40 galaxies in the survey region with are taken to be associated with the NGC 1023 Group, 25 of these within the second turnaround caustic and 15 within the larger infall domain. The least squares best fit Schechter (1976) luminosity functions for the two separate samples are illustrated by the solid and dotted curves in Fig. 15.
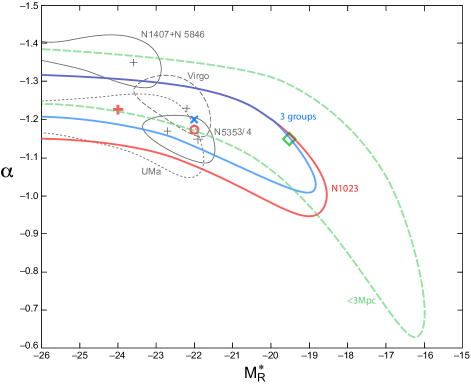
There is a coupling between the Schechter parameters , describing the faint end power law, and , describing the bright end exponential cutoff. The 95% probability limits of the least squares fits are shown in Figure 16. Give attention to the solid red contour labeled N1023. The red cross locates the best fit at , . The contour is open at large negative . A fit with , (a power law with no break) is negligibly worse than the optimal fit. The counts are too small to constrain a bright end cutoff. From knowledge gleaned from better populated samples it can be anticipated that a cutoff is appropriate. If a cutoff with is specified then a fit only worse than optimal is found with . The uncertainty with the constrained fit is . The location of this preferred fit is shown by the red circle in Fig. 16.
The M81 and Local groups provide samples that are useful for comparison. Chiboucas et al. (2009) describe a related program of observations with CFHT MegaCam of the second turnaround caustic region around M81. Information pertinent to the Local Group is gathered from the literature (Mateo 1998; van den Bergh 2006). The Local Group is a dumbbell system with separate halos and caustics on scales of 200 kpc around M31 and the Milky Way and an infall region extending to a first turnaround surface at Mpc (Karachentsev et al. 2009).
The blue contour in Fig. 16 labeled ‘3 groups’ illustrates the 95% probability limits of fits to the sum of the NGC 1023, M81, and Local Group samples restricted in each case to the domains within the respective second turnaround caustics. The combined sample contains 63 galaxies with , 25 from the NGC 1023 Group, 23 from the M81 Group, and 15 from the Local Group. A power law fit without a break is disfavored at the level of . The value of is poorly constrained but a best fit is found at . The slope is well constrained, though weakly coupled to the uncertain .
|
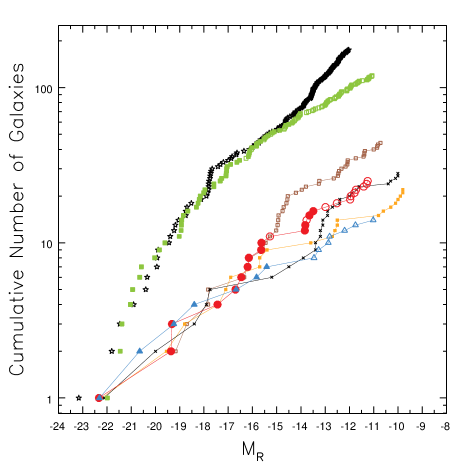
The cumulative luminosity functions for these distinct samples are seen in Figure 17. There are not significant differences between the core regions around NGC 1023, M81, and the Local Group centers M31 and the Milky Way. A curious deficiency of objects in the interval is seen in the ensemble sample. Equivalent information from our earlier studies are brought across: for the NGC 5353/4 Group (Tully & Trentham 2008) and for the NGC 1407 Group (Trentham et al. 2006). Schechter function 95% probability constraints for these samples are carried over to Fig. 16. See Table 3 for summary information on the various groups given attention to date with this program.
Almost exclusively, the environments that have been considered up to now in this discussion lie within massive halos limited by the radii of second turnaround for spherical collapse. The exception is the more extended region around NGC 1023 that we described as the infall domain. That region alone is too limited to give useful statistics regarding the luminosity function outside of massive collapsed halos. In order to provide a better comparison, we turn to the immediate region around our Galaxy. There is now reasonable completion brighter than in a volume extending to 3 Mpc (Karachentsev et al. 2004). This volume contains 39 known galaxies brighter than the magnitude limit once regions of 250 kpc radius around each of M31 and the Milky Way are excluded. The 95% probability limits of Schecter luminosity function fits for this sample are included in Fig. 16. The optimal fit is with the parameters at . It is seen, though, that the constraints on are weak. is disfavored by only . There is too little representation at bright magnitudes to constrain a cutoff. Within the uncertainties, the luminosity function for the volume outside collapsed cores resembles what is seen in the denser environments. Certainly, though, as seen in Fig 12, the galaxy morphologies are different. Almost all dwarfs are gas–rich dI in the places that have not merged with major () halos.
As a final point regarding luminosity functions, it can be seen from those shown in Fig. 17 that there is no hint of a turndown within the limit .
7 Discussion
A major goal when this series of papers began was to determine if there are significant variations in the luminosity function of galaxies with environment. It was suspected that there were (Tully et al. 2002). The admittedly poor evidence at the time suggested that denser, more dynamically evolved environments have more dwarf galaxies and maybe steeper faint end slopes. The most evolved environments that we have studied, the NGC 1407 and NGC 5846 groups, have significantly steeper faint end slopes, with a joint best fit . It is seen in Fig. 16 that the 95% probability surfaces almost do not overlap with those of the other targets of this study. The lowerer mass halo environments have an average value for the slope parameter of after normalizing to to give a fair comparison. It can be seen in Table 3 that the two evolved groups have significantly the highest ratio of dwarfs per giant. However, there is Figure 18 to interpret.
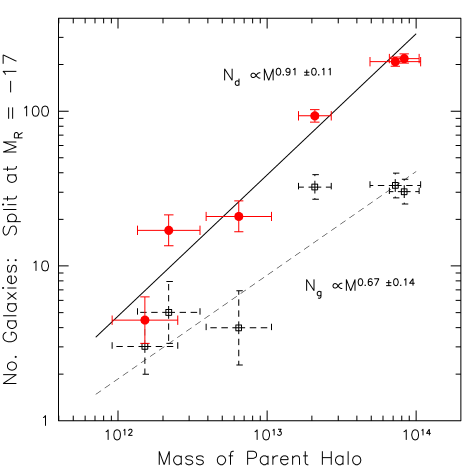
Contributions to this plot come from the earlier studies in this series (of the NGC 5846, NGC 1407, NGC 5353/4, and M81 groups), for the Local Group from the literature, and for the NGC 1023 Group with this work. The parent halo masses are derived from the velocities of group members through the virial theorem. The ordinate records, alternatively, the number of giant galaxies residing in the halo and the number of dwarfs. It is seen that the number of giants () is only loosly correlated with the halo mass while the number of dwarfs () is quite tightly correlated. The slope of a linear fit to the dwarf constituents is compatible with unity within the uncertainty. That is, the number of dwarf galaxies per unit halo mass is roughly constant. Count the number of dwarfs and one has a good estimate of the mass of the halo:
| (6) |
where is the number of dwarfs and is the mass of the halo in solar units. We have established that there are statistically significant differences in luminosity functions in distinct environments but the frequencies of dwarf galaxies normalized by the parent halo mass are statistically equal for these same environments. The differences are in the giant galaxy populations.
Giant galaxy deficiencies are most convincingly seen in the NGC 1407 and NGC 5846 groups. These two groups are considerably more dynamicaly evolved than the other environments, to the degree in the case of NGC 1407 that it almost qualifies as a ‘fossil group’ (Ponman et al. 1994). These groups contain one or two very bright members but a relative deficiency of intermediate luminosity giants. It is expected that galaxy mergers have built up the dominant galaxies and depleted the reservoir of intermediate-sized systems (Jones et al. 2003).
Although only weak differences have been found in the luminosity function faint end slopes in different environments there are strong differences in galaxy morphologies. There is a dramatic difference in the ratio of dI to dE depending on whether one is considering a collapsed halo region (i.e. one in which the dark matter particles are bound on long timescales) or a low density region outside of a large parent halo. There is a more subtle dependence of the ratio of dE,N to dE, nucleation versus non-nucleation, on the degree of dynamic evolution of the host parent halo.
8 Conclusions
With the present study we have given consideration to a relatively low density environment, the sort of place where most gas-rich galaxies lie. Over the course of a series of papers, we have discussed an interesting range of conditions in galaxy groups (UMa: Trentham et al. 2001; NGC 5846: Mahdavi et al. 2005; NGC 1407: Trentham et al. 2006; NGC 5353/4: Tully & Trentham 2008; M81: Chiboucas et al. 2009; NGC 1023: this paper). The wide field and deep imaging with CFHT MegaCam has revealed the nature and extent of the regions of collapse in halos over the range . These regions can be characterized by the parameter , the radius of second turnaround with spherical collapse.
Almost everything that we have learned so far in this series pertains to the regions within the caustic delimited by . Even in the present case of the NGC 1023 Group, which was chosen because all the known members save NGC 1023 itself are spirals or gas-rich irregulars, a CCD mosaic survey has revealed that a swarm of dwarfs lies about the principal galaxy and a subsequent analysis of the pattern of velocities tells us that there is a massive halo about that galaxy.
Interestingly, in this group there is a second galaxy, NGC 891, that is almost as luminous as NGC 1023 but this second most important galaxy does not have an appreciable entourage of dwarfs. The early type S0 system NGC 1023, though barely more luminous than NGC 891, evidently lies within a much more massive halo. A similar situation was found in the NGC 5353/4 Group studied earlier (Tully & Trentham 2008). The brightest galaxy in that group is NGC 5371 but this spiral has few dwarf companions. The large number of dwarfs congregate around the merging pair of S0 galaxies NGC 5353 and NGC 5354.
The most original discovery of the present paper is illustrated in Fig. 18. There is a tight correlation between halo mass and dwarf galaxy abundance. The slope of the correlation is consistent with a constant number of dwarfs per unit halo mass. The implication is that the efficiency of dwarf production is not dependent on environment, at least across the spectrum of collapsed regimes we have explored.
Yet there are significant, although subtle, variations in luminosity functions. The locations with few spirals, like the NGC 1407 and NGC 5846 groups, are relatively depleted in intermediate luminosity systems. There is a suggestion of a dip at intermediate luminosities in the luminosity function of the NGC 5846 Group, a feature seen in several rich clusters (Chiboucas & Mateo 2009; McDonald et al. 2009). An environment with spirals like the NGC 5353/4 Group retains (has not lost through merging?) its mid luminosity systems. The ratio of dwarfs to giants given in Table 3 provides a crude but robust characterization.
The mass to light ratio is another characterization. This ratio, also recorded in Table 3, is high in groups of dominantly early types and with high dwarf/giant ratios. It is low in groups with substantial spiral fractions and low dwarf/giant ratios. The correlation between dwarf–giant ratio and mass–light ratio is shown in Figure 19. Those intermediate spirals are contributing both to a boost of the bright end of the luminosity function and to a reduction of the mass to light ratio. The correlation of mass to light ratio with parent halo mass was already demonstrated with a large sample by Tully (2005).

There is not yet sufficient information to quantify luminosity function differences between collapsed regions and the low density regions beyond second turnaround caustics. We have given attention to the 3 Mpc region around the Local Group but it provides limited statistics. Effectively by definition, a low density region outside a massive halo cannot contain a major galaxy, so a comparison of luminosity functions is meaningless at the bright end. The coupling between the parameters and in the standard Schechter formulation creates an ambiguity in making comparisons. The preliminary information shown in Fig. 16 suggests a similarity of faint end slopes between the field and groups.
Certainly, the morphologies of dwarfs are different outside of collapsed massive halos. Dwarfs () are dE in the majority if found within the second turnaround caustic. The early types are inevitably more highly concentrated within the parent halo than late types. In the most dynamically evolved halos there is a greater propensity for dE to be nucleated. By contrast, the dwarfs within 3 Mpc in the field are overwhelmingly late types. Presumably gas-rich dwarfs that fall into a massive halo are transformed to dE. There is evidence that such a transformation is happening today to dwarfs in the NGC 5353/4 Group.
It has become clear that the numbers of dwarfs are lower by a large factor from the numbers of low mass halos anticipated by Cold Dark Matter hierarchical clustering theory (Sheth & Torman 1999). As a point of comparison, if the faint end slope were with then the ratio of dwarfs to giants would be 90.
The observations of groups within the Local Supercluster reach limits of in the range –12 to –10. The inventories of group members may be incomplete for compact M32 type dwarfs in the more distant groups but there is no indication that such objects make an important numeric contribution. Dwarf galaxies exist but not in the huge numbers once anticipated by theory. Dwarf galaxies will continue to be found with more sensitive surveys. There is no hint of a turndown in the luminosity function to a limit of .
Acknowledgements
The major part of the observing program was performed at the Canada–France–Hawaii Telescope in queue mode with the wide field imager MegaCam. A substantial contribution to the initial analysis was made by Yannick Mellier and the Terapix team at the Institut d’Astrophysique de Paris. Spectroscopy was undertaken with Subaru Telescope with the collaboration of Andishai Mahdavi and Kristin Chiboucas. Hélène Courtois made an HI observation of a candidate with the Green Bank Telescope. RBT has been supported in his research with the US National Science Foundation grant AST 0307706. This research has made use of the NASA/IPAC Extragalactic Database (NED) which is operated by the Jet Propulsion Laboratory, Caltech, under agreement with the National Aeronautics and Space Association.
References
- [1]
- [2] Bertin E., Mellier Y., Rapovich M., Missonnier G., Didelon P., Morin B., 2002, ASPC, 281, 228
- [3]
- [4] Blanton M. R. et al., 2001, AJ, 121, 2358
- [5]
- [6] Boulade O. et al., 1998, SPIE, 3355, 614
- [7]
- [8] Chiboucas K., Karachentsev I. D., Tully R. B., 2009, AJ, 137, 3009
- [9]
- [10] Chiboucas K., Mateo M.L., 2009, in preparation
- [11]
- [12] de Vaucouleurs G., 1961, ApJS, 5, 233
- [13]
- [14] Ferguson H. C., Sandage A., 1988, AJ, 96, 1520
- [15]
- [16] Haynes M. P., Giovanelli R., 1988, in Large-scale Structure in the Universe, Princeton University Press, Princeton, p. 31
- [17]
- [18] Jones L.R., Ponman T.J., Horton A., Babul A., Ebeling H., Burke D.J., 2003, MNRAS, 343, 627
- [19]
- [20] Karachentsev I.D., Karachentseva V.E., Huchtmeier W.K., Makarov D.I., 2004, AJ, 127, 2031
- [21]
- [22] Karachentsev I.D., Kashibadze O.G., Makarov D.I., Tully R.B., 2009, MNRAS, 000, 000 (arXiv:0811.4610)
- [23]
- [24] Klypin A., Kravtsov A.V., Valenzuela O., Prada F., 1999, ApJ, 522, 82
- [25]
- [26] Koposov S. et al., 2008, ApJ, 686, 279
- [27]
- [28] Kormendy J., Bender R., 1996, ApJ, 464, L119
- [29]
- [30] Landolt A. U., 1992, AJ, 104, 340
- [31]
- [32] Mahdavi A., Trentham N., Tully R.B., 2005, AJ, 130, 1502
- [33]
- [34] Mateo M.L. 1998, ARA&A,36, 435
- [35]
- [36] McDonald M., Courteau S., Tully R.B., 2009, MNRAS, in press (arXiv:0901.3554)
- [37]
- [38] Moore B., Ghigna S., Governato F., Lake G,. Quinn T., Stadel J., Tozzi P. 1999, ApJ, 524, L19
- [39]
- [40] Norberg P. et al., 2002, MNRAS, 336, 907
- [41]
- [42] Ponman T.J., Allan D.J., Jones L.R., Merrifield M., McHardy I.M., Lehto H.J., Luppino G.A., 1994, Nat., 369, 462
- [43]
- [44] Saito Y. et al., 2003, 4841, 1180
- [45]
- [46] Sandage A., Binggeli B., Tammann G. A., 1985, AJ, 90, 1759
- [47]
- [48] Schechter P.L., 1976, ApJ, 203, 297
- [49]
- [50] Sheth R.K., Torman G. 1999, MNRAS, 308, 119
- [51]
- [52] Schlegel D. J., Finkbeiner D. P., Davis M., 1998, ApJ, 500, 525
- [53]
- [54] Trentham N., Tully R. B., Verheijen M. A. W, 2001, MNRAS, 325, 385
- [55]
- [56] Trentham N., Tully R.B., 2002, MNRAS, 335, 712 [TT02]
- [57]
- [58] Trentham N., Tully R. B., Mahdavi A., 2006, MNRAS, 369, 1375
- [59]
- [60] Tully R. B., 1987, ApJ, 321, 280
- [61]
- [62] Tully R. B., 2005, ApJ, 618, 214
- [63]
- [64] Tully R.B., Pierce M.J., Huang J.S., Saunders W., Verheijen M.A.W., Witchalls P.L., 1998, AJ, 115, 2264
- [65]
- [66] Tully R.B., Somerville R.S., Trentham N., Verheijen M.A.W., 2002, ApJ, 569, 573
- [67]
- [68] Tully R. B., Trentham N., 2008, AJ, 135, 1488
- [69]
- [70] Tully R.B., Rizzi L., Shaya E.J., Courtois H.M., Makarov D.I., Jacobs B.A. 2009, arXiv:0902.3668
- [71]
- [72] Tully R. B., Verheijen M. A. W., Pierce M. J., Huang J. S., Wainscoat R. J., 1996, AJ, 112, 2471
- [73]
- [74] van den Bergh S., 2000, PASP, 112, 529
- [75]
- [76] van den Bergh S., 2006, AJ, 132, 1571
- [77]