Science with VO tools: the AstroGrid VO Desktop
Abstract
We introduce a general range of science drivers for using the Virtual Observatory (VO) and identify some common aspects to these as well as the advantages of VO data access. We then illustrate the use of existing VO tools to tackle multi wavelength science problems. We demonstrate the ease of multi mission data access using the VOExplorer resource browser, as provided by AstroGrid (http://www.astrogrid.org) and show how to pass the various results into any VO enabled tool such as TopCat for catalogue correlation. VOExplorer offers a powerful data-centric visualisation for browsing and filtering the entire VO registry using an iTunes type interface. This allows the user to bookmark their own personalised lists of resources and to run tasks on the selected resources as desired. We introduce an example of how more advanced querying can be performed to access existing X-ray cluster of galaxies catalogues and then select extended only X-ray sources as candidate clusters of galaxies in the 2XMMi catalogue. Finally we introduce scripted access to VO resources using python with AstroGrid and demonstrate how the user can pass on the results of such a search and correlate with e.g. optical datasets such as Sloan. Hence we illustrate the power of enabling large scale data mining of multi wavelength resources in an easily reproducible way using the VO.
keywords:
Virtual Observatory, archives, services, data, metadata, registry, catalogs, cross-match techniques, searching, visualization, X-ray, clusters of galaxies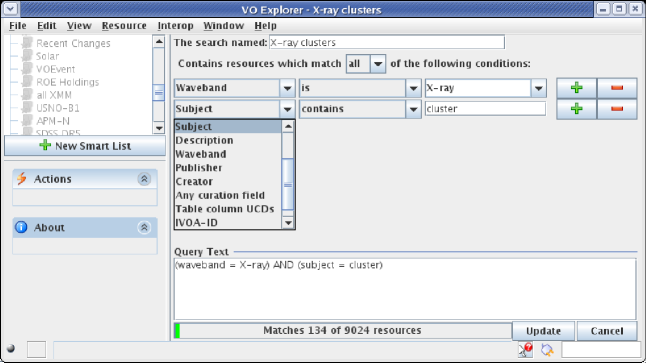
1 Science drivers and the advantages of VO access
For many years one of the primary aims of the Virtual Observatory movement has been to better enable multi wavelength astronomy. Example science drivers include finding all the information on a given set of objects which may be defined by positions, colours or morphology. It is common to study not just the resultant correlations but to identify the so-called “outlier” objects, which have unusual properties and which may offer new insight to the astrophysical processes driving the observed emission. Another requirement may be to build a spectral energy distribution from multi archive data while accounting for instrumental, sensitivity and aperture effects. A longer term goal is to compare such correlations on-the-fly with numerical simulations as the latter become available in a more standardised way.
Common aspects to the above use cases include the requirement to browse, search and manage large amounts of distributed heterogeneous data. The astronomer then wants to be able to combine multi wavelength data taking into account differences in units and photometric systems; spatial, wavelength and time coverage; resolution, point spread functions and observing techniques. We set ourselves a challenging target!
The advantages of VO data access in addressing these challenges is to make accessing multi wavelength data easier in that you do not need to access multiple interfaces but can access data from one single entry point. Furthermore the user can then build workflows, i.e. pieces of code which run on the server and are reusable.
The range and complexity of datasets and resources published to the VO is rapidly increasing. These resources are heterogeneous - and are published through various standard interfaces allowing access to images, catalogues, spectra, transient event data, tool interfaces and so on. Providing access to these resources is a success of the VO movement, where effective use of newly emerging publishing standards as provided by the International Virtual Observatory Alliance (IVOA, http://www.ivoa.net) has been made by the astronomy community. Information about each resource published to the VO is entered into a top level, continually updating “registry”, this providing in effect a record of where and what the resource is.
With the advent of these many resources available through the VO, an emerging challenge is how to offer the astronomer a reliable and usable means to search, retrieve and visualise the relevant data and resources to meet the needs of their particular science problem.
2 Introducing the AstroGrid VO Desktop
In April 2008, the UK AstroGrid VO project made the first public release of the VO Desktop suite of applications which consists of several interlinked tools including the VOExplorer resource browser, File Explorer, Task Runner and Query Builder. You can search for resources and data in the VO; bookmark your favourites; fetch images, spectra, light curves and catalogues; run queries on databases; save and share files in VOSpace; and invoke remote applications. VO Desktop also runs background software called “Astro Runtime” which handles all interactions with the remote services.
VOExplorer offers a powerful data-centric visualisation for browsing and filtering the entire VO registry using a familiar “iTunes” type interface. The Registry stores information about Resources all round the world. A “Resource” could mean a data collection like UKIDSS, or an application like Sextractor that you can invoke as a remote service, or just information about an organisation. Data collection resources will usually have one or more “capabilities”, i.e. ways of accessing the data, like an image cut out service, or a catalogue conesearch, or a full query-language (ADQL) interface. Each registry entry contains metadata describing the resource - basically a set of standard attribute=value pairs. This information will tell you whether the resource is a catalogue or an image atlas, whether it has infrared or X-ray data, as well as who curates the data. To locate particular object(s) of interest, say, you need to send a query to the resource itself. Note that the Registry is maintained by AstroGrid, but the information in it is provided by the resource owners, not by the AstroGrid project. This allows you to bookmark your own personalised lists of resources for repeat use, filter using any available metadata and then to run tasks on the selected resources as desired.
We now illustrate the use of the AstroGrid software to tackle a typical multi wavelength science case involving X-ray selected clusters of galaxies at different levels of complexity and show how data or search and correlation results may be saved to remote or local storage as well as passed to any suitably enabled VO tool for further visualisation and analysis.
3 VO Desktop in action: X-ray clusters of galaxies
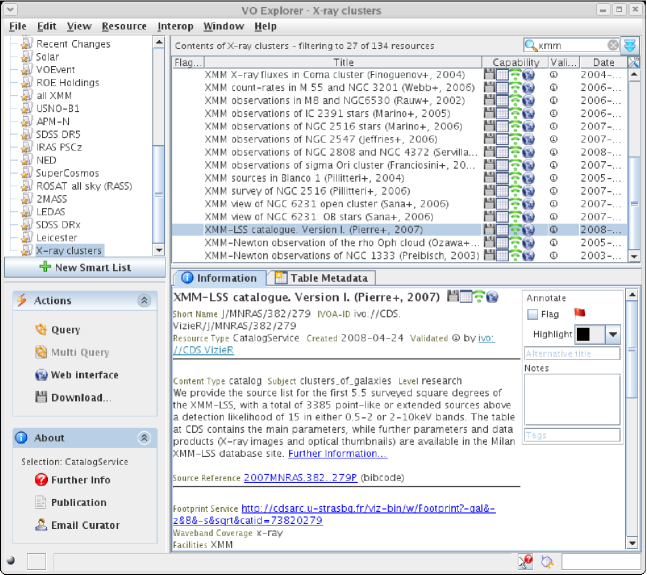
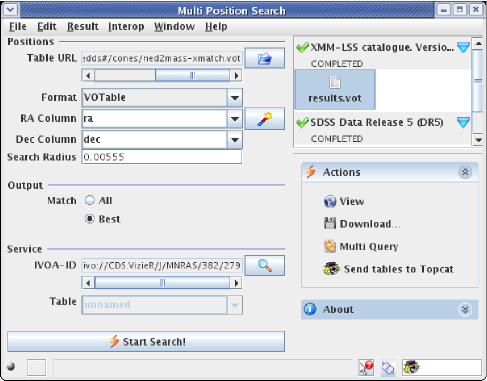
In Fig 1 we show a screenshot of the VOExplorer resource search interface which allows a user to build a set of AND, OR conditions. This example is a simple search for resources containing both “X-ray” in the waveband AND requiring the subject contains the word “cluster”. A list of resources is then returned and the search may now be refined further by means of metadata filter wheels acting on content, coverage or other resource type. In Fig 2 the resultant resources that satisfy this condition are displayed following a further filtering to any resource including the keyword “XMM” denoting the XMM-Newton satellite. On selecting the XMM-LSS catalogue of X-ray selected clusters of galaxies (Pierre et al 2007), relevant “Actions” available for the selected resource are listed including a positional search facility “Query” which launches the AstroScope search tool and also a “Multi Query” may be launched for a list of positions to be supplied by the user (Figure 3). The output can then be passed directly into any VO tool also running such as TopCat or saved to disk. Similarly for solar datasets or transient event data one can launch the HelioScope or VOScope tool on selected datasets to search by time interval.
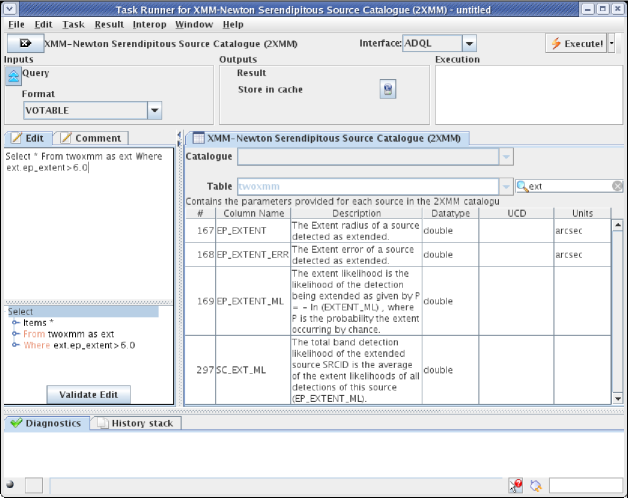
As an example of a more advanced task, Figure 4 illustrates how VOExplorer can be used to identify an ADQL (a standard Astronomical Data Query Language, based on a simple subset of SQL) query interface to the recent XMM-Newton X-ray serendipitous survey catalogue, 2XMM (http://xmmssc-www.star.le.ac.uk/Catalogue/2XMM/, Watson et al 2009), available in the VO registry alongside thumbnail image and other related products via LEDAS (LEicester Database and Archive Service, http://ledas-www.star.le.ac.uk) or in more basic form via ESA and CDS archives. The user can then filter the available 2XMM columns and set conditions on suitable extent parameters and then perform a simple 3-line ADQL query to select and return all extended X-ray sources (column ep_extent 6 arcsecs) in the catalogue to standard VOTable or other format.
4 More advanced querying and data mining: cross matching 2XMM and SDSS
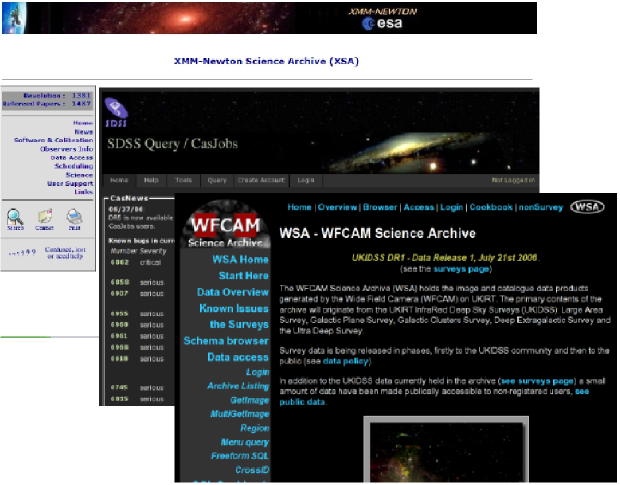
Typically, the modern multi wavelength astronomer has to access many different mission archives in order to select samples from each using a number of individual project webpages (Figure 5). Of course the expert information provided for each catalogue or data product for each differnet mission under study is usually essential in order to fully understand the criteria before a full scientific analysis. But each different interface is also likely to have it’s own terminology and a particular flavour of SQL querying also. Hence even to perform simple cross matching involves searching each one separately and then stitching back together each of the outputs afterwards. This can be a non-trivial task.
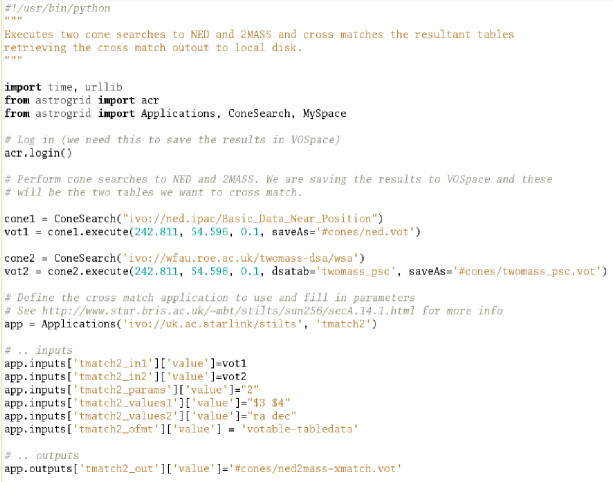
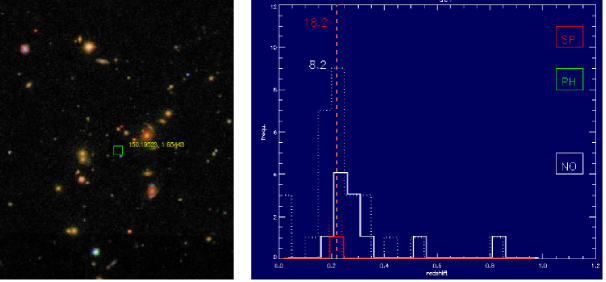
However, ADQL searches and in particular more advanced cross matching to other archives as well as other complex tasks may now be performed using a common schema in python with AstroGrid. The user may run commands directly from the command line as long as the AstroGrid Runtime capability is running in the background. Figure 6 shows a reasonably simple example chosen from a number of template python scripts for the VO, as provided by AstroGrid. In it, the user executes cone searches to NED and 2MASS around a particular individual object position and then cross matches the resultant outputs before saving to local disk. Now, by selecting an X-ray extended source sample from the 2XMM serendipitous source catalogue, as described previously using ADQL or python scripting, and then correlating the results with the Sloan Digital Sky Survey (SDSS) optical catalogues, e.g. Adelman-McCarthy et al (2008), one could derive an averaged photometric redshift for each X-ray selected galaxy cluster candidate and then repeat for the entire sample and compare to any catalogued spectroscopic redshifts. Figure 7 shows an example of the fruits of this kind of work for one such XMM cluster candidate by Lamer et al (in prep) and now made possible for large samples using the VO in a fraction of the time.
Finally, once a science sample is made the user is offered the opportunity to process and act on those data sets. For this purpose a range of data visualisation and analytical tools, often building on previously existing tools developed over many years, are available via the PLASTIC/SAMP messaging protocol. Popular tools include TopCat for catalogues, Aladin and Gaia for images, SPLAT and VOSpec for spectra. These are described in more detail elsewhere in these proceedings.
Acknowledgements
The author wishes to acknowledge the superb team effort by everyone involved in the UK AstroGrid project, working in partnership with our European-VO and IVOA colleagues. This research has made use of data obtained and software provided by AstroGrid, which is funded by the UK Science and Technology Facilities Council and through the EU’s Framework 6 and 7 programmes. We also acknowledge the contributions to this work by the XMM-Newton Survey Science Centre funded by STFC and European Space Agency partners.
References
- (1) Pierre M., et al. 2007, MNRAS 382, 279
- (2) Watson M.G., et al. 2009, A&A 493, 339
- (3) Adelman-McCarthy J.K., et al. 2008, ApJS 175, 297