Anomalous Pressure Dependence of the Superconducting Transition Temperature in FeSe1-x Studied by DC Magnetic Measurements
Abstract
The pressure dependence of superconducting transition temperature has been investigated through the DC magnetic measurements for FeSe0.8 and FeSe1.0. For both samples, with increasing pressure , the curve exhibits a two-step increase, showing a local maximum of 11 K at 1.0 GPa and a rapid increase with an extremely large pressure coefficient for 1.5 GPa. saturates at 25 K (21 K) in FeSe1.0 (FeSe0.8) for 3 GPa. A rapid decrease in superconducting volume fraction is observed with an increase in above 1.5 GPa, suggesting the presence of electronic inhomogeneity.
Since the discovery of superconductivity in LaFeAsO1-xFx (=26 K)[1], a great deal of effort has been devoted to explore new superconductors in the related compounds, leading to a rich variety of Fe-based superconductors, such as Ba1-xKxFe2As2[2, 3], Li1-xFeAs[4, 5] and FeSe[6], and an increase in up to 55 K, which is demonstrated by replacing La with Sm in LaFeAsO1-xFx[7]. Indeed, the appearance of superconductivity in Fe-based compounds is intriguing because these compounds are mostly magnetic. The superconducting phase is therefore in the vicinity of the magnetic phase suggesting the possible pairing mechanism of the magnetic origin.
The application of pressure also increases in LaFeAsO1-xFx. The measurements of electrical resistivity () under pressure have been performed by Takahashi ., suggesting that increases with increasing pressure and shows a maximum of 43 K at 4 GPa[8, 9]. In contrast, for NdFeAsO1-δ has been found to decrease monotonically from 54 to 16 K by the application of pressure up to 18 GPa[10]. The rapid increase in under pressure in LaFeAsO1-xFx is expected, considering that SmFeAsO1-xFx with a higher of 55 K has smaller lattice constants. It is somewhat surprising that the maximum of for LaFeAsO1-xFx is fairly lower than 55 K. In SrFe2As2, pressure-induced superconductivity has been found through the measurements of ()[11, 12]. The application of pressure affects strongly because it gives rise to structural modulations in the compound. It is important to elucidate the relationship between and the local lattice deformation under pressure to gain more insight into the mechanism of superconductivity.
FeSe has a PbO-type crystal structure composed of the stacking layers of Fe2Se2, which is analogous to the Fe2As2 layers commonly contained in iron-arsenide-based superconductors. The occurrence of superconductivity below 8 K has been reported first by Hsu . for FeSe0.88[6]. Fang . have studied the superconductivity of Fe(Se1-xTex)0.82 and found that Fe(Se0.4Te0.6)0.82 has a of 14 K[13]. Moreover, Mizuguchi . have found that the application of pressure increases the of FeSe in the () measurements[14]. They suggest that is 27 K at =1.48 GPa, regarding the onset temperature of resistivity drop as . Recently, Medvedev . have performed the () measurements under high pressure, suggesting that shows a broad maximum of 37 K at 9 GPa[15]. They also adopt the onset of resistivity drop as . There are some other groups who have reported the relation determined from the onset of resistivity drop[16, 17]. In contrast, Masaki . have defined by zero resistance temperature and suggested that the pressure dependence of shows a plateau between =0.51.5 GPa and a broad maximum of 21 K at 3.5 GPa in FeSe0.92[18]. It is a difficult problem to determine from the resistivity data when the resistivity drop occurs over a wide temperature range under pressure. The pressure dependence of in FeSe is currently a subject of controversy.
In the present work, we have performed DC magnetization measurements for FeSe1-x (=0 and 0.2) under pressure using a diamond anvil cell (DAC) to determine the relation precisely. Our DC magnetic measurement using DAC is a powerful technique to establish the relation, since is uniquely determined from the diamagnetic onset temperature. For AOs2O6 (A=K, Rb, Cs) pyrochlore superconductors, the characteristic relations have been successfully revealed by the measurements[19]. In this Letter, it has been found that the curve is nonmonotonic and shows a maximum at 1.0 GPa and an abrupt increase for 1.5 GPa followed by the saturation at 25 K (21 K) for 3 GPa in FeSe1.0 (FeSe0.8). The curves are qualitatively similar to that determined by Masaki [18].
The polycrystalline samples with nominal compositions FeSe1-x (=0 and 0.2) used in this study were synthesized by a solid-state reaction technique similar to that described in the literature.[6, 13, 14] at ambient pressure determined from the diamagnetic onset was 7 K for both samples. For the magnetic measurements under high pressure, a miniature DAC with an outer diameter of 8 mm was used to generate high pressure and combined with a sample rod of a commercial SQUID magnetometer. The details of the DAC are given elsewhere.[20] The FeSe1-x sample was loaded into the gasket hole together with a small piece of high-purity lead (Pb) to realize the observation of pressure by determining the pressure from the shift of Pb. Magnetization data for the small amounts of FeSe1-x and Pb were obtained by subtracting the magnetic contribution of DAC measured in an empty run from the total magnetization data. Most of the measurements have been done by using Daphne oil 7373 as a pressure transmitting medium. Daphne oil 7474 that solidifies at 3.7 GPa at room temperature, which is higher than for Daphne 7373 (2.2 GPa), was also used.

We show the temperature variations of zero-field-cooled DC magnetization measured with a magnetic field of =20 Oe for FeSe1.0 under various pressures in Fig. 1. In the figure, the curve at =0.54 GPa exhibits a sudden decrease at 10 K, indicating the superconducting transition of FeSe1.0. In addition, a sharp decrease at 7 K that corresponds to the diamagnetic onset of Pb for pressure calibration is observed. A sharp diamagnetic response of FeSe1.0 is also observed at =1.18 GPa, indicating 11 K, slightly higher than at =0.54 GPa. At =1.64 GPa, is further increased to 12.5 K, but the superconducting transition appears to lose its sharpness. On further application of pressure up to =3.14 GPa, increases very rapidly and reaches 25 K, although the transition becomes even broader. The curve at =3.48 GPa also indicates 25 K, suggesting that is independent of pressure above 3 GPa.
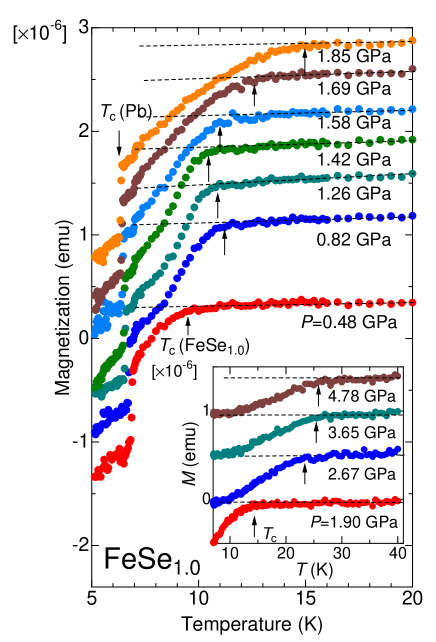
To clarify the pressure variation in in FeSe1.0 in detail, the data under pressure were collected by changing pressure in small steps. The results for 2 GPa are shown in Fig. 2. In the figure, it is found that at =0.82 GPa is 11 K, which is higher than at =0.42 GPa. However, gradually decreases to 10.5 K as pressure increases from 0.82 to 1.42 GPa, suggesting that exhibits a local maximum near 0.82 GPa. Above =1.42 GPa, a rapid increase in is observed. In the inset of Fig. 2, the curves obtained at higher pressures up to =4.78 GPa are shown. As seen in the inset, a rapid increase in is also seen above =1.90 GPa, and the saturation of is marked for 2.67 GPa.
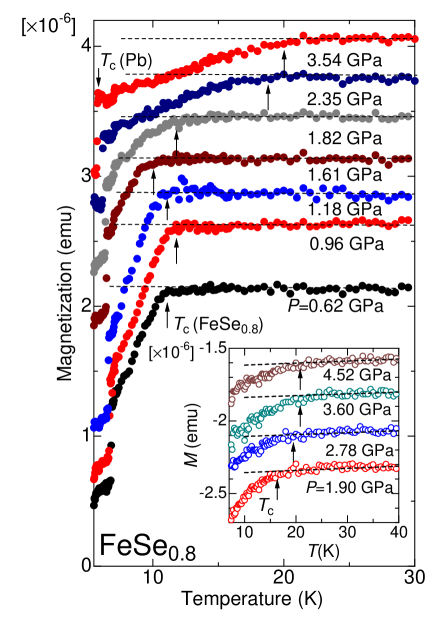
We have also performed measurements at various pressures for FeSe0.8 in order to investigate the sample dependence of the relation. Figure 3 shows the results of the measurements. In Fig. 3, it is found that the curve at =0.96 GPa indicates 11.5 K, which is the highest for 1.61 GPa. This suggests a local maximum of at =0.81 GPa, similar to the case of FeSe1.0. Furthermore, a rapid increase in is demonstrated in the curves above =1.61 GPa. The curves above =2.35 GPa suggest a saturation tendency of . The curves are also shown in the inset of Fig. 3, where is found to take a constant value of 21 K for 3.6 GPa. We should note that the slope of the curve below and the amplitude of magnetization at 5 K decrease significantly with increasing pressure up to 3.54 GPa, indicating a decrease in superconducting volume fraction under high pressure. The behavior appears above =1.61 GPa, similar to that observed in FeSe1.0. In Fig. 3, the volume fraction () at =3.54 GPa is estimated to be 14 of that at =0.62 GPa by comparing the amplitude of magnetization at =. For 2.5 GPa, the volume fraction appears to be pressure independent.
for FeSe1.0 and FeSe0.8 is plotted as a function of pressure in Figs. 4(a) and 4(b), respectively. For both samples, it is found that the curve exhibits a maximum of 11 K at 1.0 GPa. By the further application of pressure, is found to increase rapidly with an extremely large pressure coefficient of dd10 K/GPa after the sharp upturn at 1.5 GPa. Above 3 GPa, for FeSe1.0 saturates and takes a constant value of 25 K. In FeSe0.8, is also pressure independent above 3 GPa, reaching 21 K. The curve for FeSe0.8 is almost identical to that determined from the zero resistive temperature for FeSe0.92 by Masaki .[18], but these curves are different from those determined from the onset of resistivity drop[15, 16, 17]. Thus, the diamagnetic onset agrees with the zero resistive temperature in the FeSe superconductor for a wide pressure range, and they are considered as reliable markers of . It should be noted that , the maximum of for 3.0 GPa, is 25 K for FeSe1.0 but it is 21 K for FeSe0.8 and FeSe0.92[18]. appears to depend on the presence of Se deficit. However, the composition of our specimens is nominal and the exact value is unknown. Recently, McQueen . have prepared the specimens from iron pieces and selenium shot so as to prevent the formation of spurious oxides and defects, and showed that Fe1.01Se (FeSe0.99) and Fe1.02Se (FeSe0.98) are superconducting but Fe1.03Se (FeSe0.97) is not, suggesting that the superconductivity of FeSe is destroyed by very small changes in stoichiometry[21]. They have also revealed that a sample prepared from Fe powder starting with a significant iron excess contains secondary phases of Fe and Fe3O4 and the main phase of stoichiometric FeSe. Thus, the FeSe0.8 samples used in this study are considered to contain an almost stoichiometric FeSe phase as well as FeSe1.0. Also, FeSe0.92 used in the () measurements would contain an almost stoichiometric FeSe phase. The origin of the difference in is unclear, but we could not exclude the possibility that other specimens of slightly different composition exhibit a more than 25 K.
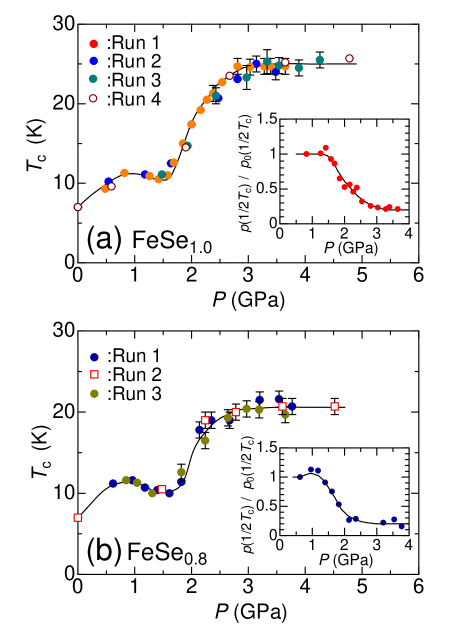
In the insets of Figs. 4(a) and 4(b), the superconducting volume fraction at = normalized to that at low pressure () is plotted as a function of pressure for FeSe1.0 and FeSe0.8, respectively. For both samples, ()() is found to decrease rapidly above 1.5 GPa and shows a constant value of 0.2 above 2.53.0 GPa. This indicates that the volume fraction of superconductivity at is reduced to only 20 of the initial value by the application of pressure. Thus, it is found that the rapid increase in above 1.5 GPa accompanies a significant decrease in superconducting volume fraction in the FeSe superconductor. The decrease in volume fraction above 1.5 GPa was observed regardless of the use of Daphne 7373 or Daphne 7474, indicating that the behavior is not due to the pressure distribution arising from the solidification of Daphne 7373 in the sample space. In addition, our preliminary observation of AC susceptibility () using an indenter-type cell (3 GPa) also revealed the broadening of the transition and the rapid increase in above 1.5 GPa. Furthermore, the decrease in volume fraction is also inferred from the () data above =2 GPa showing the occurrence of resistivity drop over a wide temperature range[18]. The recent X-ray experiments focused on the pressure evolution of the crystal structure and bonding have revealed that no structural transition is detected below 9 GPa, but a sharp decrease in Se height from the Fe plane is observed[16]. The relationship between the structural modification and the rapid increase above 1.5 GPa has not been clarified. Recently, Imai . have performed 77Se NMR investigations of FeSe and observed the disappearance of paramagnetic NMR signals below a peak of 1/ as a typical signature of a magnetic phase transition or spin freezing[22]. The decrease in superconducting volume fraction above 1.5 GPa is considered to be caused by the electronic inhomogeneity realized such as that in the vicinity of the magnetic phase. At the pressures above =3 GPa, a kink is observed in the curve at 50 K[18]. The anomaly at may indicate a magnetic phase transition under pressure, although no static magnetic ordering is evidenced from the Mssbauer spectroscopy[15]. In the FeSe superconductor, there is an intriguing possibility that the superconducting phase is divided into two regions in the phase diagram, where an electronically inhomogeneous superconducting state is realized above 1.5 GPa. To elucidate it, further intensive studies are desired above =1.5 GPa.
In summary, it has been found that the curve both for FeSe1.0 and FeSe0.8 exhibits a local maximum of 11 K at 1 GPa, then shows an abrupt increase with an extremely large pressure coefficient for 1.53 GPa, and finally becomes constant for 3 GPa. The maximum of for 3 GPa is 25 K (21 K) for FeSe1.0 (FeSe0.8). A remarkable feature is the decrease in superconducting volume fraction accompanied by an abrupt increase in above 1.5 GPa. The decrease in volume fraction is considered as a signature of the electronic inhomogeneity in the superconduting state above 1.5 GPa.
Acknowledgements.
This work is financially supported by a Grant-in-Aid for Scientific Research (No. 20540355) from the Japanese Ministry of Education, Culture, Sports, Science and Technology.References
- [1] Y. Kamihara, T. Watanabe, M. Hirano, and H. Hosono: J. Am. Chem. Soc. 130 (2008) 3296.
- [2] M. Rotter, M. Tegel, and D. Johrendt: Phys. Rev. Lett. 101 (2008) 107006.
- [3] K. Sasmal, B. Lv, B. Lorenz, A. M. Guloy, F. Chen, Y. Y. Xue, and C. W. Chu: Phys. Rev. Lett. 101 (2008) 107007.
- [4] J. H. Tapp, Z. Tang, B. Lv, K. Sasmal, B. Lorenz, P. C. W. Chu, and A. M. Guloy: Phys. Rev. B 78 (2008) 060505(R).
- [5] X. C. Wang, Q. Q. Liu, Y. X. Lv, W. B. Gao, L. X. Yang, R. C. Yu, F. Y. Li, and C. Q. Jin: Solid State Commun. 148 (2008) 538.
- [6] F.-C. Hsu, J.-Y. Luo, K.-W. Yeh, T.-K. Chen, T.-W. Huang, P. M. Wu, Y.-C. Lee, Y.-L. Hung, Y.-Y. Chu, D.-C. Yan, and M.-K. Wu: Proc. Natl. Acad. Sci. U.S.A. 105 (2008) 14262.
- [7] X. H. Chen, T. Wu, G. Wu, R. H. Liu, H. Chen, and D. F. Fang: Nature 453 (2008) 761.
- [8] H. Takahashi, K. Igawa, K. Arii, Y. Kamihara, M. Hirano, and H. Hosono: Nature 453 (2008) 376.
- [9] H. Okada, K. Igawa, H. Takahashi, Y. Kamihara, M. Hirano, H. Hosono, K. Matsubayashi, and Y. Uwatoko: J. Phys. Soc. Jpn. 77 (2008) 113712.
- [10] N. Takeshita, A. Iyo, H. Eisaki, H. Kito, and T. Ito: J. Phys. Soc. Jpn 77 (2008) 075003.
- [11] H. Kotegawa, H. Sugawara, and H. Tou: J. Phys. Soc. Jpn 78 (2009) 013709.
- [12] K. Igawa, H. Okada, H. Takahashi, S. Matsuishi, Y. Kamihara, M. Hirano, H. Hosono, K. Matsubayashi, and Y. Uwatoko: J. Phys. Soc. Jpn 78 (2009) 025001.
- [13] M. H. Fang, H. M. Pham, B. Qian, T. J. Liu, E. K. Vehstedt, Y. Liu, L. Spinu, and Z. Q. Mao: Phys. Rev. B 78 (2008) 224503.
- [14] Y. Mizuguchi, F. Tomioka, S. Tsuda, T. Yamaguchi, and Y. Takano: Appl. Phys. Lett. 93 (2008) 152505.
- [15] S. Medvedev, T. M. McQueen, I. Trojan, T. Palasyuk, M. I. Eremets, R. J. Cava, S. Naghavi, F. Casper, V. Ksenofontov, G. Wortmann, and C. Felser: arXiv:0903.2143.
- [16] S. Margadonna, Y. Takabayashi, Y. Ohishi, Y. Mizuguchi, Y. Takano, T. Kagayama, T. Nakagawa, M. Takata, and K. Prassides: arXiv:0903.2204.
- [17] G. Garbarino, A. Sow, P. Lejay, A. Sulpice, P. Toulemonde, W. Crichton, M. Mezouar and M. Nez-Regueiro: Europhys. Lett. 86 (2009) 27001.
- [18] S. Masaki, H. Kotegawa, Y. Hara, H. Tou, K. Murata, Y. Mizuguchi, and Y. Takano: J. Phys. Soc. Jpn 78 (2009) 063704.
- [19] K. Miyoshi, Y. Takaichi, Y. Takamatsu, M. Miura, and J. Takeuchi: J. Phys. Soc. Jpn 77 (2008) 043704.
- [20] M. Mito, M. Hitaka, T. Kawae, K. Takeda, T. Kitai, and N. Toyoshima: Jpn. J. Appl. Phys. 40 (2001) 6641.
- [21] T. M. McQueen, Q. Huang, V. Ksenofontov, C. Felser, Q. Xu, H. Zandbergen, Y. S. Hor, J. Allred, A. J. Williams, D. Qu, J. Checkelsky, N. P. Ong, and R. J. Cava: Phys. Rev. B 79 (2009) 014522.
- [22] T. Imai, K. Ahilan, F. L. Ning, T. M. McQueen, and R. J. Cava: Phys. Rev. Lett. 102 (2009) 177005.