Spectropolarimetry of the Unique Type Ib Supernova 2005bf: Larger Asymmetry Revealed by Later-Phase Data 11affiliation: Based on data collected at Subaru Telescope, which is operated by the National Astronomical Observatory of Japan.
Abstract
We present an optical spectropolarimetric observation of the unique Type Ib supernova (SN) 2005bf at 8 days after the second maximum. The data, combined with the polarization spectrum taken at 6 days before the second maximum (Maund et al. 2007a), enable us to closely examine the intrinsic properties of the SN. The polarization percentage is smaller at the later epoch over a wide wavelength range, while the position angle is similar at the two epochs. We find that an assumption of complete depolarization of strong lines at the emission peak is not necessarily correct. The intrinsic polarization of the SN is larger, and thus, the ejecta of SN 2005bf would be more asymmetric than previously expected. The axis ratio of the photosphere projected on the sky deviates from unity by at least 20 %. If the position angle of interstellar polarization is aligned with the spiral arm of the host galaxy, the deviation is larger than 25 %. The line polarization at the He i, Ca ii and Fe ii lines is also smaller at the later epoch. The changes in the position angle across these lines, which were observed at the earlier epoch, are still marginally present at the later epoch. The similar polarimetric behavior suggests that the distributions of these ions are correlated. Properties of polarization, as well as the light curve and the spectra both at photospheric and nebular phases, can be explained by an aspherical, possibly unipolar explosion of a WN star in which the blob of 56Ni penetrates C+O core and stops within the He layer.
Subject headings:
polarization — supernovae: individual (SN 2005bf)1. Introduction
Asymmetry is one of the keys to understand the explosion mechanism of core-collapse supernovae (SNe). Various mechanisms that could lead to aspherical explosions have been studied, including e.g., rotation and magnetic field (e.g., Müller & Hillebrandt, 1981; Yamada & Sato, 1994; Takiwaki et al., 2004), convection (e.g., Burrows et al., 1995; Janka & Müller, 1996) or standing accretion shock instability (e.g., Blondin et al., 2003; Iwakami et al., 2008).
Observational constraints on SN asymmetry can be obtained via direct imaging (e.g., Wang et al., 2002; Hwang et al., 2004) only for a few, very nearby SNe or supernova remnants. For extragalactic SNe, polarimetry is one of the most direct methods to study asymmetry of the explosion. Polarization is produced by electron scattering within the SN ejecta. Since the polarization vectors are canceled out in spherically symmetric ejecta, no polarization would be detected from a spherical explosion. In other words, the detection of polarization undoubtedly indicates asymmetry of the explosion (Shapiro & Sutherland, 1982; McCall, 1984; Höflich, 1991).
Spectropolarimetry is a more powerful tool than imaging polarimetry because polarization across lines possesses information on the element distribution (see Wang & Wheeler, 2008, for a recent review). Since the scattering by the line depolarizes the light, line polarization is detected when the distributions of elements or ions are not uniform (even when the underlying photosphere is spherically symmetric). The asymmetric nature of core-collapse SNe has been studied in detail by spectropolarimetry (e.g., Cropper et al., 1988; Trammell et al., 1993; Wang et al., 2001, 2003a; Leonard et al., 2001, 2002, 2006; Kawabata et al., 2002, 2003; Maund et al., 2007a, b, c; Hoffman et al., 2008; Tanaka et al., 2008a).
In this paper, we present a spectropolarimetric observation of the Type Ib SN2005bf, which appears to be a unique supernova because of the following aspects: (1) The light curves showed double peaks (Anupama et al., 2005; Tominaga et al., 2005; Folatelli et al., 2006). (2) The SN was at first classified as Type Ic (SNe without H or He lines) but then re-classified as Type Ib (SNe with He lines) because of the emergence of strong He lines (Wang & Baade, 2005; Modjaz et al., 2005). (3) The decline of the luminosity after the second maximum was very rapid (Tominaga et al., 2005; Folatelli et al., 2006). In addition, the luminosity around 300 days after the explosion was much fainter than expected from of 56Ni necessary to account for the second SN luminosity maximum (Maeda et al., 2007).
In order to explain the two peaks of the light curve by radioactivity, the distribution of 56Ni must have two components. This fact led Tominaga et al. (2005) and Folatelli et al. (2006) to propose a jet-like explosion for SN 2005bf. However, the low luminosity at nebular phases may suggest another heating source for the second peak, such as central remnant’s activity (Maeda et al., 2007).
Maund et al. (2007a) (hereafter M07) presented a spectropolarimetric observation of SN 2005bf taken with the Very Large Telescope (VLT) at 6 days before the second visual maximum, i.e., at days, where indicates the epoch relative to the second visual maximum, JD 2453498.8 (Folatelli et al., 2006). Based on detected large polarization levels and changes in the polarization position angle at the lines of He i, Ca ii and Fe ii, they suggested a tilted-jet model, i.e., a scenario in which the asphericity is due to the ejection of blob(s) (or jets) in a tilted direction with respect to the symmetry axis of the SN.
One difficulty in polarimetric observations is accounting for the degree of interstellar polarization (ISP) caused by interstellar extinction (Davis & Greenstein, 1951). Although a correct estimate of ISP is essential to determine the intrinsic polarization of the SN, such an estimate is especially difficult to determine with an observation at a single epoch.
We present spectropolarimetric data of SN 2005bf taken with the 8.2 m Subaru telescope at 14 days after the observation by M07. The two-epoch data enable us to estimate ISP more carefully. In §2, we present the observations and data reduction. The data taken at the two epochs are compared, and updated estimates of ISP are shown in §3. In §4, our interpretation of spectropolarimetric data is discussed. Finally, we give the conclusions in §5.
2. Observations and Data Reduction
Spectropolarimetry of SN 2005bf was performed with the 8.2 m Subaru telescope equipped with the Faint Object Camera and Spectrograph (FOCAS, Kashikawa et al., 2002) on 2005 May 15 UT (JD 2453506.76). This epoch corresponds to days (14 days after the observation by M07).
We used a slit of width and two 300 lines mm-1 grisms. Blue ( Å) and red ( Å) spectra were taken separately. No filter was used for the blue spectrum, while the O58 filter was used for the red spectrum to eliminate the second order light. The wavelength resolution is .
The linear polarimetric module of FOCAS consists of a rotating superachromatic half-wave plate and a crystal quartz Wollaston prism. Both the ordinary and extraordinary rays are recorded on the CCD simultaneously. From four integrations at the and positions of the half-wave plate, Stokes and were derived as in Tinbergen (1996). The total exposure time of four integrations was 2400 sec for each part of the spectrum.
The position angle was calibrated by the observation of the strongly polarized star HD 155197 (Turnshek et al., 1990). The wavelength dependence of the optical axis of the half-wave plate was also corrected using this observation. Since sky conditions were better during the observation of the blue spectrum, the polarization data are binned into 30 Å and 50 Å for the blue and red spectra, respectively. This yields an average signal-to-noise ratio S/N . For the degree of polarization , the polarization bias was corrected using the results of Patat & Romaniello (2006).
The flux spectrum was calibrated using the observation of the spectrophotometric standard star Feige34 (Oke, 1990) and further calibrated using previously reported photometry of the SN (Tominaga et al., 2005). Telluric absorption lines are removed using the spectrum of the standard star.
3. Results
3.1. Spectropolarimetric Properties at the Two Epochs
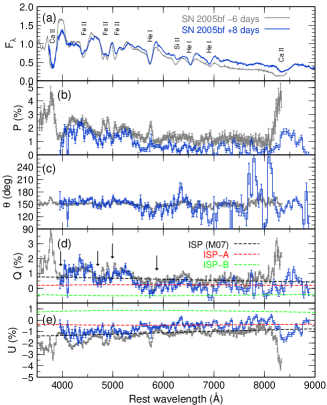
Figure 1 shows comparison of flux spectrum and polarization spectrum at days (blue) with those at days (gray). Line identifications are given in the panel for the total light spectrum (). It is interesting to note that He line velocities increase with time (Tominaga et al., 2005). This is in contrast to the usual behavior, i.e., the photosphere recedes and line velocities decrease with time in expanding ejecta. This peculiar behavior of SN 2005bf may suggest increasing non-thermal excitation of the He lines (Harkness et al., 1987; Lucy, 1991).
The Stokes parameter at days is smaller than that at days in the continuum (). The difference in the Ca ii triplet region is larger than in the continuum. The difference in the Stokes parameter between the two epochs is more prominent than over the whole wavelength range (). The parameter at days is larger than that at days (about half in absolute value).
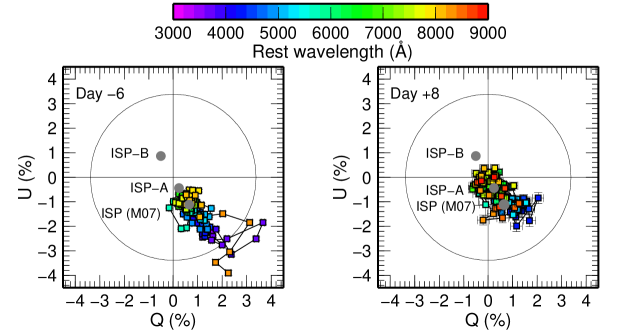
The difference in the Stokes and between the two epochs is more easily seen in the - plane (Fig. 2). In the - plane, the data at days are closer to zero point. The position angle is similar at the two epochs, [, see also panel () of Fig. 1].
As a result, the degree of polarization [] is smaller at days over the whole wavelength range (panel () of Fig. 1). In the line-free region, the difference in the polarization is . The polarization at the strong lines, e.g., He i 5876, Ca ii IR triplet and Fe ii lines at 4300-5100 Å is also smaller at days. In particular, the polarization in the Ca ii triplet region decreases by a factor of in absolute value.
Multi-epoch spectropolarimetry of Type Ib/c SNe has not been performed for many objects (Wang & Wheeler, 2008). One of the well-observed example is Type Ic SN 2002ap. For SN 2002ap, the continuum polarization level increases with time before the maximum brightness (Wang et al., 2003a). After maximum, the polarization decreases or it is almost unchanged (Kawabata et al., 2002; Leonard et al., 2002; Wang et al., 2003a). For SN 2005bf, polarization decreases in the interval from to days. However, since we don’t know the polarization around the maximum, the time evolution could possibly be similar to that of SN 2002ap 111A decreasing trend in polarization is reported for Type Ic SN 2006aj associated with X-ray flash 060218 (Gorosabel et al., 2006), although the observation consists only in imaging polarimetry [see Maund et al. 2007b for a single-epoch spectropolarimetry of SN 2006aj]..
3.2. Updated Estimates of Interstellar Polarization
To discuss intrinsic properties of SN polarization, polarization caused by interstellar extinction (ISP) must be corrected. First, we give an upper limit of ISP by the total amount of reddening (Serkowski et al., 1975). In the line of sight to SN 2005bf, Galactic extinction is mag (Schlegel et al., 1998). M07 estimated the extinction by the host galaxy to be mag by using the equivalent width of the Na i D line and the relation given by Turatto et al. (2003). Thus, the relation of (Serkowski et al., 1975) gives the maximum degree of ISP %. This maximum value is shown by the large circle in Figure 2.
The wavelength dependence of ISP is represented by
| (1) |
which is valid for the Milky Way-like dust (Serkowski et al., 1975). Here is the wavelength at the peak of ISP, is the degree of ISP at , and is given as (Whittet et al., 1992). M07 estimated ISP (the black dashed lines in Fig. 1) by assuming complete depolarization at the emission peak of He i, Ca ii and Fe ii lines (marked by arrows in panel () of Fig. 1). This is often assumed when ISP must be estimated from a single epoch spectropolarimetry. As a result, ISP was estimated as %, Å, and .
However, our data show that the assumption of the complete depolarization at days is not necessarily true. The polarization levels at the emission peak of the Fe ii lines and He i 5876 are different between and days. This fact indicates that the contribution of ISP should be smaller, as already cautioned by M07.
ISP can be estimated more carefully from multi-epoch data. The position angle is similar at the two epochs. This fact suggests that the position angle of ISP is (similar to the position angle of the observed data) or (the opposite side in the - plane) if the SN does not have a complex change of position angle. If the position angle of ISP were far from the above two values, the intrinsic SN polarization would have a complex wavelength dependence and a time dependence.
If we take a position angle of ISP as in M07, a new upper limit of ISP can be obtained by fitting the polarization at the emission peak of strong lines at days, e.g., He i 5876, Ca ii H&K and IR triplet and Fe ii lines. Under the conventional assumption of Å, good simultaneous fits are obtained with %. This is shown with the red dashed lines in Figure 1 and in the gray circle in Figure 2. We call this upper limit ISP-A.
It should be noted, however, that the position angle of ISP-A is orthogonal to the spiral arm of the host galaxy (see Fig. 1 of M07). This is in contradiction to the expectation that ISP is aligned with the spiral arm due to the alignment of dusts by the magnetic field (Scarrott et al., 1987, 1993). Thus, it is also quite likely that ISP has a position angle , being aligned with the spiral arm. In addition, this does not cause any complex change in the position angle of SN (see above). In this case, the degree of ISP is only weakly constrained by the total extinction, i.e., . We take as an example. This ISP, hereafter denoted as ISP-B, is shown in the green dashed lines in Figure 1 and in the gray circle in Figure 2. Since the correct value of is unclear, it is cautioned that the exact value of the intrinsic polarization is also arbitrary.
4. Asymmetry of SN 2005bf
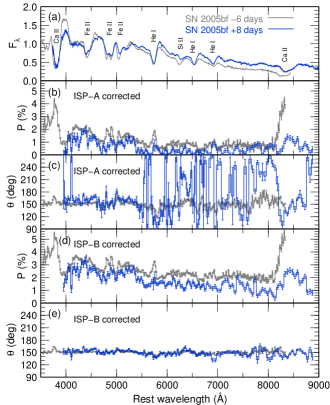
Figure 3 shows polarization and position angle corrected with ISP-A () and ISP-B (). We discuss asymmetric geometry of SN 2005bf inferred from the two-epoch spectropolarimetric data and other observational facts.
4.1. Continuum Polarization
Intrinsic continuum polarization (defined in the line-free region at 7000-8000 Å) at days was estimated as % under the assumption of ISP by M07. However, with our updated ISP estimates, it is at least (Fig. 3). Using the results of Höflich (1991), with the opacity at the photosphere and oblate geometry, this suggests that the axis ratio of the photosphere projected on the sky deviates from unity by 20 %.
If the position angle of ISP is aligned with the spiral arm of the host galaxy, intrinsic continuum polarization is . This suggests even larger asymmetry of the photosphere, being . Since is not strongly constrained in this case, the intrinsic polarization is uncertain. For example, under the assumption of ISP-B (), the axis ratio can be deviated from unity by as large as 50 %.
After the correction of ISP, the difference in the polarization between the two epochs is larger in the redder part than in the bluer. This could indicate that the ISP peaks at bluer than 5500 Å as suggested by M07.
The intrinsic polarization level at days largely depends on the choice of ISP. If the position angle of ISP is , the continuum polarization at days is . The variation of the position angle along the wavelength is very small since is aligned with the observed data in the - plane. In addition, the agreement in the position angle at two epochs is extremely good when ISP-B is corrected (panel () in Fig. 3). This is because ISP-B is out of scatter around the zero point in the - plane at days. These facts may support the possibility that the position angle of ISP is aligned with the spiral arm of the host galaxy. Although is quite uncertain in the case of , may be preferable to avoid a complex wavelength-dependence of the position angle of the SN at days.
Since the interval of the two epochs is not close, the exact evolution of the continuum polarization is not clear. It is true, however, that the polarization is smaller at the later epoch. This can be understood by (1) decreasing optical depth of electron scattering or (2) decreasing asphericity of the photosphere. In optically thin case, the effect of (1) is important, as observed after plateau phase of Type II SNe (Leonard et al., 2006). However, the epoch of our observation seems to be earlier than the epoch when the transition to the nebular phase happens. Thus, the actual change of the photospheric shape (2) could also be likely.
4.2. Line Polarization
At both epochs, a large polarization is observed at the He i 5876, Ca ii IR triplet and Fe ii lines. Little polarization is seen at the He i 6678 and 7065, but this may be due to the weakness of these lines. The line polarizations at strong lines at days are smaller than at days. This can be caused partly by the smaller polarization of the underlying photospheric radiation at the later epoch.
The difference of the polarization between the two epochs is the largest at the Ca ii IR triplet region among three strong lines. The large change may suggest that asphericity of the Ca ii distribution depends on the velocity (radius), i.e., larger asphericity in the outer layers. Since the change in the velocities of the He i and Fe ii lines is smaller than that in the Ca ii line, the radial dependence of asphericity cannot be discussed for the He and Fe.
M07 discussed the change in the position angle at the He i, Ca ii and Fe ii lines. This appears as a loop in the - plane and indicates that the photosphere and the line forming region do not share a common symmetry axis. At days, the change in the position angle at these lines is also seen at the Ca ii line, and marginally at the He i and Fe ii lines, although the loop in the - plane is not as prominent as that at days. The similar polarimetric behaviors of these lines, i.e., the similar position angle especially under ISP-B and the smaller polarization level at the later epoch, suggest that the distributions of these ions are correlated.
At both epochs, no strong polarization is observed at the Si ii and the O i . Since these lines are very weak, no detection of polarization does not necessarily indicate sphericity of the distribution of Si ii and O i. Although M07 discussed polarization of H lines, the H lines are not clearly identified at days (see Folatelli et al., 2006).
4.3. Aspherical Explosion Model
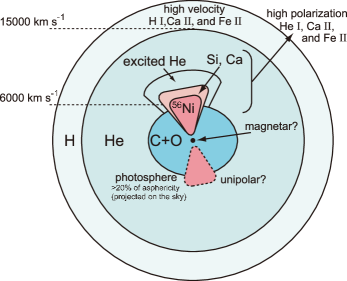
We discuss explosion geometry of SN 2005bf. To explain spectropolarimetric behaviors as well as the behaviors of the light curve and spectra both at photospheric ( days after the explosion) and nebular ( year after the explosion) phases, we suggest an aspherical model as illustrated in Figure 4.
The progenitor star of SN 2005bf is suggested to be a WN star by the identification of the high velocity H line (Anupama et al., 2005; Tominaga et al., 2005; Folatelli et al., 2006). The velocity at the bottom of the H layer is km s-1.
The He layer is located below the H layer. The velocity at the bottom of the He layer is around 6,000 km s-1, constrained by the minimum velocities of the He lines (Tominaga et al., 2005). Since the velocities of the He lines increase with time, it is suggested that the excitation of He i grows with time. Thus, 56Ni is not completely mixed with the He layer. The distribution of 56Ni is clumpy, which is suggested by the high polarization level of the Fe lines. Around the 56Ni blob, non-thermal electrons are created by Compton scattering of -rays emitted in the decay of 56Ni and 56Co. Thus, the He lines are formed around the 56Ni blob.
Heavy elements such as Si and Ca must also be synthesized around 56Ni. The polarization of the Ca ii line that depends on the velocity (radius, §4.2) could be explained by the flared distribution of synthesized, heavy elements as illustrated in Fig. 4, which is often seen in simulations of jet-like explosion (e.g., Tominaga, 2009). Since the absorption of Si is very weak, no detection of polarization at the Si line is not inconsistent with this geometry. The geometry discussed above can explain the similar polarization properties of the He i, Ca ii, and Fe ii lines.
The C+O core is located below the He layer at 6,000 km s-1. The photosphere at and days is located in the C+O core (Tominaga et al., 2005). The photosphere is deformed so that the projected photosphere has asymmetry. This degree of asphericity can be formed by the ejection of the blob (or jets) toward the polar region (e.g., Khokhlov et al., 1999; Maeda et al., 2002). However, the photosphere and the distribution of 56Ni do not share a common symmetry axis as suggested by the changes in the position angle across the lines. This could be due to the fact that the direction where the blob is ejected is tilted with respect to the symmetry axis of the photosphere (as in a tilted-jet model suggested by M07). Such distributions could possibly be realized by, for example, a magnetorotational explosion, where the rotational axis is inclined with respect to the magnetic field (Mikami et al., 2008).
The 56Ni blob toward us is responsible for the first peak of the light curve (Maeda et al., 2007). It may also explain the velocity shifts of the emission lines seen in the nebular spectra. In this case, the explosion may be unipolar. In addition, the second peak of the light curve is powered by another heating source. Maeda et al. (2007) proposed magnetar as a central remnant of SN 2005bf and reproduced the observed light curve until late phases.
Folatelli et al. (2006) and Parrent et al. (2007) suggested that the high velocity Ca ii and Fe ii lines that were present at early epochs ( days) support the jet-like explosion. However, since the velocities of these lines coincide to that of H ( km s-1), the high velocity Ca ii and Fe ii lines are formed in the H layer. If the jet or blob-like structure does not penetrate the He layer as illustrated in Figure 4, these lines are unlikely to be associated with the blob. Alternatively, these high velocity lines can result from the solar abundance in the H layer because of a high electron density in the H layer, enhancing the recombination of Ca iii and Fe iii (Mazzali et al., 2005; Tanaka et al., 2008b).
5. Conclusions
We have presented an optical spectropolarimetric observation of the unique Type Ib SN 2005bf taken with the Subaru telescope at days. Comparison with the data taken with VLT at days enables us to closely study the intrinsic properties of the SN.
Polarization at days is smaller than that at days, with an almost constant position angle at a wide wavelength range. We find that an assumption of complete depolarization at the emission peak of strong lines is not necessarily correct. This requires reanalysis of the ISP contribution in the observed data. We put a smaller upper limit for ISP. Thus, the intrinsic polarization of the SN is larger, i.e., the ejecta of SN 2005bf would be more asymmetric. The axis ratio of the photosphere projected on the sky deviates from unity by at least 20%.
It is likely that the position angle of ISP is aligned with the spiral arm of the host galaxy. If this is the case, the continuum polarization at days is at least . Then the asymmetry of the projected photosphere is even larger, being .
The degrees of the line polarization at the He i, Ca ii and Fe ii lines similarly decrease from to days. The change in the position angle across the line, making a loop in the - plane, is seen in the Ca ii line and also marginally in the He i and Fe ii lines at days. The similar behavior of these lines suggests that the distribution of these ions are correlated.
We propose an aspherical, possibly unipolar explosion model of a WN star as shown in Figure 4. In this model, the 56Ni-rich blob penetrates C+O core and stops within the He layer. The direction in which the 56Ni-rich blob is ejected is tilted with respect to the symmetry axis of the aspherical photosphere (M07). The blob is responsible for the first peak of the light curve. If the explosion is unipolar, the shifted nebular emission lines are also explained by the blob (Maeda et al., 2007). The non-thermal electrons originating from the 56Ni-rich blob selectively excite He around the blob, and this configuration can explain the similar polarization properties of the He i, Ca ii and Fe ii lines.
References
- Anupama et al. (2005) Anupama, G. C., Sahu, D. K., Deng, J., Nomoto, K., Tominaga, N., Tanaka, M., Mazzali, P. A., & Prabhu, T. P. 2005, 631, 125
- Blondin et al. (2003) Blondin, J.M., Mezzacappa, A., & DeMarino, C., 2003, ApJ, 584, 971
- Burrows et al. (1995) Burrows, A., Hayes, J., Fryxell, B. A. 1995, ApJ, 450, 830
- Cropper et al. (1988) Cropper, M., Bailey, J., McCowage, J., Cannon, R. D., & Couch, Warrick J. 1988, MNRAS, 231, 695
- Davis & Greenstein (1951) Davis, L. Jr., Greenstein, J. L. 1951, ApJ, 114, 206
- Folatelli et al. (2006) Folatelli, G., et al. 2006, ApJ, 641, 1039
- Gorosabel et al. (2006) Gorosabel, J., et al. 2006, A&A, 459, L33
- Harkness et al. (1987) Harkness, R. P., et al. 1987, ApJ, 317, 355
- Hoffman et al. (2008) Hoffman, J. L., Leonard, D. C., Chornock, R., Filippenko, A. V., Barth, A. J., Matheson, T. 2008, ApJ, 688, 1186
- Höflich (1991) Höflich, P. 1991, A&A, 246, 481
- Hwang et al. (2004) Hwang, U., et al. 2004, ApJ, 615, L117
- Iwakami et al. (2008) Iwakami, W., Kotake, K., Ohnishi, N., Yamada, S., & Sawada, K 2008, ApJ, 678, 1207
- Janka & Müller (1996) Janka, H.-Th., Müller, E. 1996, A&A, 306, 167
- Kashikawa et al. (2002) Kashikawa, N., et al. 2002, PASJ, 54, 819
- Kawabata et al. (2002) Kawabata, K.S., et al. 2002, ApJ, 580, L39
- Kawabata et al. (2003) Kawabata, K.S., et al. 2003, ApJ, 593, L19
- Khokhlov et al. (1999) Khokhlov, A. M., Höflich, P. A., Oran, E. S., Wheeler, J. C., Wang, L., & Chtchelkanova, A. Yu. 1999, ApJ, 524, L107
- Leonard et al. (2001) Leonard, D.C., Filippenko, A. V., Ardila, D. R., & Brotherton, M. S. 2001, ApJ, 553, 861
- Leonard et al. (2002) Leonard, D.C., Filippenko, A.V., Chornock, R., & Foley, R. 2002, PASP, 114, 1333
- Leonard et al. (2006) Leonard, D.C., et al. 2006, Nature, 440, 505
- Lucy (1991) Lucy, L. B. 1991, ApJ, 383, 308
- Maeda et al. (2002) Maeda, K., et al. 2002, ApJ, 565, 405
- Maeda et al. (2007) Maeda, K., et al. 2007, ApJ, 666, 1069
- Maund et al. (2007a) Maund, J. R., Wheeler, J. C., Patat, F., Baade, D., Wang, L., & Höflich, P. 2007a, MNRAS, 381, 201 (M07)
- Maund et al. (2007b) Maund, J. R., Wheeler, J. C., Patat, F., Baade, D., Wang, L., & Höflich, P. 2007b, A&A, 475, L1
- Maund et al. (2007c) Maund, J. R., Wheeler, J. C., Patat, F., Wang, L., Baade, D., Höflich, P. A. 2007c, ApJ, 671, 1944
- Mazzali et al. (2005) Mazzali, P.A. Benetti, S., Stehle, M., Branch, D., Deng, J., Maeda, K., Nomoto, K., & Hamuy, M. 2005, MNRAS, 357, 200
- McCall (1984) McCall, M. L. 1984, MNRAS, 210, 829
- Mikami et al. (2008) Mikami, H., Sato, Y., Matsumoto, T., & Hanawa, T. 2008, ApJ, 683, 357
- Modjaz et al. (2005) Modjaz, M., Kirshner, R.P., & Challis, P. 2005, IAU Circ., 8522, 2
- Müller & Hillebrandt (1981) Müller, E., & Hillebrandt, S. 1981, A&A, 103, 358
- Oke (1990) Oke, J.B. 1990, AJ, 99, 1621
- Parrent et al. (2007) Parrent, J., et al 2007, PASP, 119, 135
- Patat & Romaniello (2006) Patat, F. & Romaniello, M., 2006, PASP, 118, 146
- Scarrott et al. (1987) Scarrott, S. M., Ward-Thompson, D., & Warren-Smith, R. F. 1987, MNRAS, 224, 299
- Scarrott et al. (1993) Scarrott, S. M., Draper, P. W., Stockdale, D. P., & Wolstencroft, R. D., 1993, MNRAS, 264, L7
- Serkowski et al. (1975) Serkowski, K., Mathewson, D.L., & Ford, V.L. 1975, ApJ, 196, 261
- Schlegel et al. (1998) Schlegel, D. J., Finkbeiner, D. P., & Davis, M. 1998, ApJ, 500, 525
- Shapiro & Sutherland (1982) Shapiro, P.R., & Sutherland, P.G. 1982, ApJ, 263, 902
- Takiwaki et al. (2004) Takiwaki, T., Kotake, K., Nagataki, S., & Sato, K. 2004, ApJ, 616, 1086
- Tanaka et al. (2008a) Tanaka, M., Kawabata, K. S., Maeda, K., Hattori, T., & Nomoto, K. 2008a, ApJ, 689, 1191
- Tanaka et al. (2008b) Tanaka, M., et al. 2008b, ApJ, 677, 448
- Tinbergen (1996) Tinbergen, J. 1996, Astronomical Polarimetry (New York: Cambridge Univ. Press)
- Tominaga et al. (2005) Tominaga, N., et al. 2005, ApJ, 633, L97
- Tominaga (2009) Tominaga, N., 2009, ApJ, 690, 526
- Trammell et al. (1993) Trammell, S.R., Hines, D.C., & Wheeler, J.C. 1993, ApJ, 414, L21
- Turatto et al. (2003) Turatto M., Benetti S., Cappellaro E., 2003, in From Twilight to Highlight: The Physics of Supernovae, ed. by Hillebrandt W., Leibundgut B., Springer, Berlin, 200
- Turnshek et al. (1990) Turnshek, D. A., Bohlin, R. C., Williamson, R. L., II, Lupie, O. L., Koornneef, J., & Morgan, D. H. 1990, AJ, 99, 1243
- Wang et al. (2001) Wang, L., et al. 2001, ApJ, 550, 1030
- Wang et al. (2002) Wang, L., et al. 2002, ApJ, 579, 671
- Wang et al. (2003a) Wang, L., Baade, D., Höflich, P., & Whheler, J.C 2003, ApJ, 592, 457
- Wang & Baade (2005) Wang, L., & Baade, D. 2005, IAU Circ., 8521, 2
- Wang & Wheeler (2008) Wang, L., & Wheeler, J. C. 2008, ARA&A, 46, 433
- Whittet et al. (1992) Whittet, D. C. B., Martin, P. G., Hough, J. H., Rouse, M. F., Bailey, J. A., & Axon, D. J. 1992, ApJ, 386, 562
- Yamada & Sato (1994) Yamada, S., & Sato, K. 1994, ApJ, 434, 268